. 2025 Feb 3;23(2):e3003025.
doi: 10.1371/journal.pbio.3003025. eCollection 2025 Feb.

Tonic ubiquitination of the central body weight regulator melanocortin receptor 4 (MC4R) promotes its constitutive exit from cilia

Affiliations

Tonic ubiquitination of the central body weight regulator melanocortin receptor 4 (MC4R) promotes its constitutive exit from cilia

Irene Ojeda-Naharros et al. PLoS Biol. .

Abstract

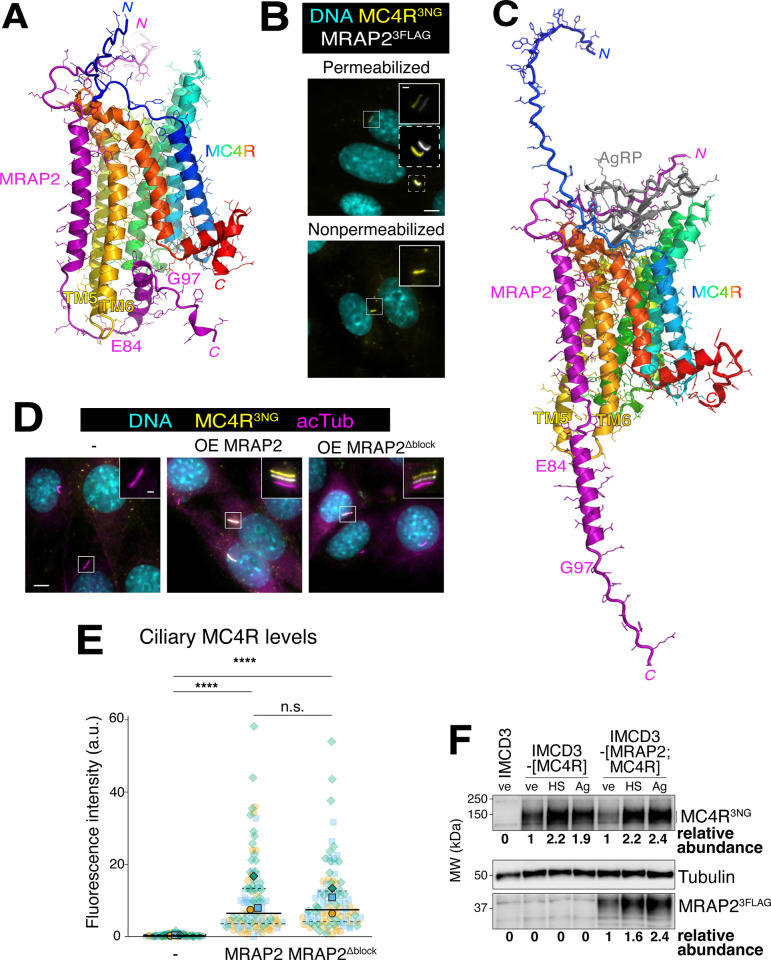
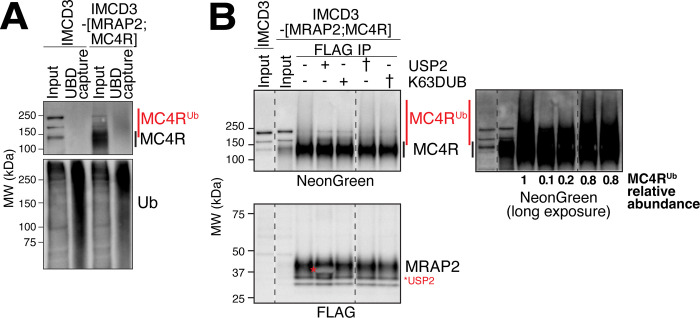
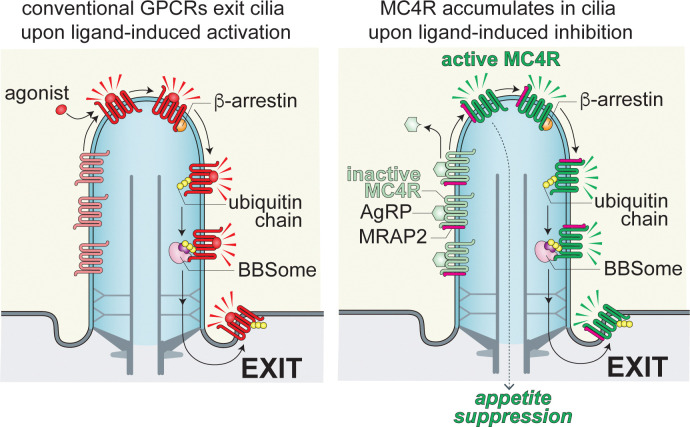
The G protein-coupled receptor (GPCR) melanocortin receptor 4 (MC4R) is an essential regulator of body weight homeostasis. MC4R is unusual among GPCRs in that its activity is regulated by 2 opposing physiological ligands, the agonist ⍺-MSH and the antagonist/inverse agonist AgRP. Paradoxically, while MC4R localizes and functions at the cilium of hypothalamic neurons, the ciliary levels of MC4R are very low under unrestricted feeding conditions. Here, we find that the constitutive activity of MC4R is responsible for the continuous depletion of MC4R from cilia and that inhibition of MC4R's activity via AgRP leads to a robust accumulation of MC4R in cilia. Ciliary targeting of MC4R is mediated by its partner MRAP2 and the constitutive exit of MC4R from cilia relies on the sensor of activation β-arrestin, on ubiquitination, and on the BBSome ciliary trafficking complex. Thus, while MC4R exits cilia via conventional mechanisms, it only accumulates in cilia when its activity is suppressed by AgRP.


Conflict of interest statement

The authors have declared that no competing interests exist

Figures

Fig 1
Fig 1. The ciliary abundance of MC4R is considerably lower than that of other GPCRs.
(A) Representative images of clonal IMCD3 lines stably expressing GPR1613NG under the control of the ultra-weak δ-crystallin promoter (pCrysδ) or MRAP23FLAG/MC4R3NG under the control of the attenuated promoter pEF1⍺Δ. Serum-starved cells were fixed and stained for acetylated tubulin (acTub, magenta) and DNA (cyan). GPR1613NG and MC4R3NG were visualized through the intrinsic fluorescence of NG (yellow). The yellow and magenta channels are shifted to facilitate visualization of ciliary signals in the insets. Scale bars: 5 μm (main panel) and 1 μm (inset). (B) Superplots of the ciliary fluorescence intensities of GPR1613NG vs. MC4R3NG. n = 3 independent experiments. Data points belonging to each different experiment are encoded by translucent points of different color and shape. The average of each experiment is represented by solid points. A solid line has been used to represent the median of all combined data and dashed lines to represent the interquartile values. Asterisks indicate statistical significance values calculated by a parametric unpaired t test on individual cilia (**** p < 0.0001). All underlying data are found S1 Data. (C) Relative transcript levels of GPR1613NG vs. MC4R3NG assessed by qRT-PCR amplification of 3NG. GAPDH was used to normalize signals between samples. Values are displayed relative to the mRNA levels in the IMCD3-[GPR1613NG] cell line. n = 3 independent biological replicates. Each point represents the mean of 3 averaged qRT-PCR runs of a biological replicate. Error bars represent standard deviations. Asterisks indicate statistical significance values calculated by a parametric ratio-paired t test (*** p < 0.001). All underlying data are found S1 Data. GPCR, G protein-coupled receptor; MC4R, melanocortin receptor 4.
Fig 2
Fig 2. Blocking the tonic activity of MC4R increases its ciliary abundance.
(A) Representative images of IMCD3-[MRAP23FLAG/MC4R3NG] cells treated with either HS014, AgRP or vehicle were fixed at the indicated time points. Cells were stained for acetylated tubulin (acTub, magenta) and FLAG (MRAP23FLAG, white). MC4R3NG was visualized through the intrinsic fluorescence of NG (yellow). The white, yellow, and magenta channels are shifted to facilitate visualization of ciliary signals. Scale bar: 1 μm. (B) IMCD3-[MRAP23FLAG/MC4R3NG] cells treated with AgRP or vehicle were lysed at the indicated time points. Cell lysates were resolved by SDS-PAGE and probed for NG (MC4R3NG), Tubulin, and FLAG (MRAP23FLAG) to assess total protein levels. MC4R3NG and MRAP23FLAG band intensities were measured and normalized to the tubulin density (loading control). The abundances of MC4R3NG and MRAP23FLAG relative to their levels at t = 0 are indicated below the blots. (C) IMCD3-[MRAP23FLAG/MC4R3NG] cells treated with HS014 or vehicle were lysed at the indicated time points. Cell lysates were resolved by SDS-PAGE and probed for NG (MC4R3NG), Tubulin, and FLAG (MRAP23FLAG) to assess total protein levels. MC4R3NG and MRAP23FLAG band densities were measured and normalized to the tubulin density (loading control). The abundances of MC4R3NG and MRAP23FLAG relative to their levels at t = 0 are indicated below the blots. (D) Plots of ciliary MC4R3NG (orange) and MRAP23FLAG (green) in MRAP23FLAG/MC4R3NG cells treated for the indicated time points with either AgRP or vehicle. All underlying data are found S1 Data. (E) Plots of ciliary MC4R3NG (orange) and MRAP23FLAG (green) in MRAP23FLAG/MC4R3NG cells treated for the indicated time points with either HS014 or vehicle. All underlying data are found S1 Data. AgRP, agouti-related peptide; MC4R, melanocortin receptor 4; MRAP2, melanocortin receptor accessory protein 2.
Fig 3
Fig 3. Effects of co-treatment with AgRP and ⍺-MSH on the ciliary levels of MC4R and MRAP2.
(A) Representative images of IMCD3-[MRAP23FLAG/MC4R3NG] cells treated with either vehicle or 50 nM AgRP and increasing concentrations of ⍺-MSH (from 0 nM to 1,000 nM). Cells were stained for acetylated tubulin (acTub, magenta) and FLAG (MRAP23FLAG, white). MC4R3NG was visualized through the intrinsic fluorescence of NG (yellow). The white, yellow, and magenta channels are shifted to facilitate visualization of ciliary signals. Scale bar: 1 μm. (B) Superplot comparing the ciliary fluorescence intensity of MC4R3NG in IMCD3-[MRAP23FLAG;MC4R3NG] treated with either vehicle or 50 nM AgRP ± ⍺-MSH at different concentrations. n = 3 independent experiments. Data points belonging to each different experiment are encoded by translucent points of different color and shape. The average of each experiment is represented by solid points. A solid line has been used to represent the median of global data and dashed lines to represent the interquartile values. All underlying data are found S1 Data. (C) Superplot comparing the ciliary fluorescence intensity of MRAP3FLAG in IMCD3-[MRAP23FLAG;MC4R3NG] treated with either vehicle or 50 nM AgRP ± ⍺-MSH at different concentrations. n = 3 independent experiments. Data points belonging to each different experiment are encoded by translucent points of different color and shape. The average of each experiment is represented by solid points. A solid line has been used to represent the median of global data and dashed lines to represent the interquartile values. All underlying data are found S1 Data. AgRP, agouti-related peptide; MC4R, melanocortin receptor 4; MRAP2, melanocortin receptor accessory protein 2.
Fig 4
Fig 4. MRAP2 does not suppress MC4R exit by blocking its tonic activity.
(A) AlphaFold2.3 model of human MC4R/MRAP2. The predicted MC4R blocking motif extends from E84 to G97. (B) Representative images of IMCD3-[MRAP23FLAG;MC4R3NG] cells stained for FLAG in permeabilized vs. nonpermeabilized conditions, (MRAP23FLAG, white) and DNA (cyan). MC4R3NG was visualized through the intrinsic fluorescence of NG (yellow) and provides a reference for primary cilium. The white and yellow channels are shifted to facilitate visualization of ciliary signals in the insets. Scale bars: 5 μm (main panel) and 1 μm (inset). (C) AlphaFold2.3 model of human MC4R/MRAP2 in a 1:1:1 complex with human AgRP. (D) Representative images of IMCD3-[MC4R3NG] untransfected or transiently transfected cells with MRAP23FLAG or the MRAP2 version lacking the candidate MC4R inhibitory motif MRAP2Δblock-3FLAG. DNA (cyan), MRAP23FLAG or MRAP2Δblock-3FLAG (white), MC4R3NG (yellow), cilia (acetylated tubulin, magenta). The white, yellow, and magenta channels have been shifted in the insets for better visualization. Scale bars: 5 μm (main panel) and 1 μm (inset). (E) Superplots of the ciliary fluorescence intensities of MC4R3NG in IMCD3-[MC4R3NG] untransfected or transiently transfected cells with MRAP23FLAG or the MRAP2 version lacking the candidate MC4R inhibitory motif MRAP2Δblock-3FLAG. n = 3 independent experiments. Data points belonging to each different experiment are encoded by translucent points of different color and shape. The average of each experiment is represented by solid points. A solid line has been used to represent the median of all combined data and dashed lines to represent the interquartile values. Asterisks indicate statistical significance values calculated by one-way ANOVA on individual cilia followed by Tukey post hoc test (n.s., nonsignificant; **** p < 0.0001). All underlying data are found S1 Data. (F) Western blot showing total MC4R3NG and MRAP23FLAG protein levels in whole cell lysates of cells expressing MC4R3NG alone or co-expressing MRAP23FLAG/MC4R3NG, treated for 24 h with either HS014, AgRP, or vehicle. MC4R3NG and MRAP23FLAG band densities were measured and normalized to the tubulin density (loading control). The abundances of MC4R3NG and MRAP23FLAG relative to their vehicle-treated levels are indicated below the blots. AgRP, agouti-related peptide; MC4R, melanocortin receptor 4; MRAP2, melanocortin receptor accessory protein 2.
Fig 5
Fig 5. MRAP2 facilitates the import of MC4R into cilia.
(A) Representative images of IMCD3-[MC4R3NG] (top row) or IMCD3-[MRAP23FLAG;MC4R3NG] (bottom row). Serum-starved cells were treated for 24 h with either HS014, AgRP, or vehicle, then fixed and stained for acetylated tubulin (acTub, magenta) and DNA (cyan). MC4R3NG was visualized through the intrinsic fluorescence of NG (yellow). The yellow and magenta channels are shifted to facilitate visualization of ciliary signals in the insets. Scale bars: 5 μm (main panel) and 1 μm (inset). (B) Superplots of the ciliary fluorescence intensities of MC4R3NG in IMCD3-[MC4R3NG] and IMCD3-[MRAP23FLAG;MC4R3NG] treated with HS014, AgRP, or vehicle. n = 3 independent experiments. Data points belonging to each different experiment are encoded by translucent points of different color and shape. The average of each experiment is represented by solid points. A solid line has been used to represent the median of global data and dashed lines to represent the interquartile values. Asterisks indicate statistical significance values calculated by one-way ANOVA on individual cilia followed by Tukey post hoc test (**** p < 0.0001). All underlying data are found S1 Data. (C) Representative images of IMCD3-[MC4R3NG] (top row) or IMCD3-[MRAP23FLAG;MC4R3NG] (bottom row). Cells were transfected with either siArl6 or siLuc2 (negative control, siCtrl). DNA (cyan), MC4R3NG (yellow), cilia (acetylated tubulin, magenta). The yellow and magenta channels have been shifted in the insets for better visualization. Scale bars: 5 μm (main panel) and 1 μm (inset). (D) Superplot comparing the ciliary fluorescence intensity of MC4R3NG in IMCD3-[MC4R3NG] or IMCD3-[MRAP23FLAG;MC4R3NG] cells, treated with either siLuc2 (negative control, siCtrl) or siArl6. n = 3 independent experiments. Data points belonging to each different experiment are encoded by translucent points of different color and shape. The average of each experiment is represented by solid points. A solid line has been used to represent the median of global data and dashed lines to represent the interquartile values. Asterisks indicate statistical significance values calculated by one-way ANOVA on individual cilia followed by Tukey post hoc test (**** p < 0.0001). All underlying data are found S1 Data. (E) Representative images of IMCD3-[MC4R3NG] (top row) or IMCD3-[MRAP23FLAG;MC4R3NG] (bottom row) transiently transfected with V5MRAP2, to distinguish the newly delivered MRAP2 from the stably expressed MRAP23FLAG. DNA (cyan), V5MRAP2 (white), MC4R3NG (yellow), cilia (acetylated tubulin, magenta). The white, yellow, and magenta channels have been shifted in the inserts for better visualization. Scale bars: 5 μm (main panel) and 1 μm (inset). (F) Superplot comparing the ciliary fluorescence intensity of MC4R3NG in cells expressing MC4R3NG alone or co-expressing MRAP23FLAG/MC4R3NG, transiently transfected with V5MRAP2. n = 3 independent experiments. Data points belonging to each different experiment are encoded by translucent points of different color and shape. The average of each experiment is represented by solid points. A solid line has been used to represent the median of global data and dashed lines to represent the interquartile values. Asterisks indicate statistical significance values calculated by one-way ANOVA on individual cilia followed by Tukey post hoc test (n.s., nonsignificant; **** p < 0.0001). All underlying data are found S1 Data. AgRP, agouti-related peptide; MC4R, melanocortin receptor 4; MRAP2, melanocortin receptor accessory protein 2.
Fig 6
Fig 6. Constitutive MC4R removal from cilia depends on β-arrestin and the BBSome.
(A) Representative images of IMCD3-[MRAP23FLAG;MC4R3NG] in wild-type, Arl6-/- and Barr1-/-/Barr2-/- cells. DNA (cyan), MRAP23FLAG (white) MC4R3NG (yellow), cilia (acetylated tubulin, magenta). The white, yellow, and magenta channels have been shifted in the insets for better visualization. Scale bars: 5 μm (main panel) and 1 μm (inset). (B) Superplot comparing the ciliary fluorescence intensity of MC4R3NG in IMCD3-[MRAP23FLAG;MC4R3NG] in wild-type, Arl6-/- and Barr1-/-/Barr2-/- cells. n = 3 independent experiments. Data points belonging to each different experiment are encoded by translucent points of different color and shape. The average of each experiment is represented by solid points. A solid line has been used to represent the median of global data and dashed lines to represent the interquartile values. Asterisks indicate statistical significance values calculated by one-way ANOVA on individual cilia followed by Tukey post hoc test (n.s., nonsignificant; **** p < 0.0001). All underlying data are found S1 Data. (C) Superplot comparing the ciliary fluorescence intensity of MRAP23FLAG in IMCD3-[MRAP23FLAG;MC4R3NG] in wild-type, Arl6-/- and Barr1-/-/Barr2-/- cells. n = 3 independent experiments. Data points belonging to each different experiment are encoded by translucent points of different color and shape. The average of each experiment is represented by solid points. A solid line has been used to represent the median of global data and dashed lines to represent the interquartile values. Asterisks indicate statistical significance values calculated by one-way ANOVA on individual cilia followed by Tukey post hoc test (n.s., nonsignificant; **** p < 0.0001). All underlying data are found S1 Data. (D) Western blot showing total MC4R3NG protein levels in whole cell lysates of IMCD3-[MRAP23FLAG;MC4R3NG] in wild-type, Arl6-/- and Barr1-/-/Barr2-/- cells. MC4R3NG band densities were measured and normalized to the tubulin density (loading control). The abundances of MC4R3NG and MRAP23FLAG relative to the wild-type levels are indicated below the blots. MC4R, melanocortin receptor 4; MRAP2, melanocortin receptor accessory protein 2.
Fig 7
Fig 7. MC4R is K63-polyubiquitinated in the absence of ligand.
(A) Western blot of UBD-captured proteins in IMCD3-[MRAP23FLAG;MC4R3NG] and FlpIn parental cells. The top panel shows MC4R3NG detected with anti-NeonGreen antibody. A band below 150 kDa (black bracket) that is absent in the parental lanes can be seen in the IMCD3-[MRAP23FLAG;MC4R3NG] input lane. MC4R is detected as a higher molecular smear above 150 kDa in the UBD-captured lane (red bracket). The bottom panel shows the efficiency of the ubiquitinated protein capture as increased smears of ubiquitin. (B) Western blot of MRAP23FLAG-captured proteins in IMCD3-[MRAP23FLAG;MC4R3NG] and FlpIn parental cells. MC4R3NG co-immunoprecipitates with MRAP2 and appears as a band below 150 kDa (black bracket) and a higher molecular smear that corresponds to polyubiquitinated MC4R (red brackets). The higher molecular smear disappears when the eluates are treated with the K63-specific deubiquitinase AMSH (K63DUB) and the pan-linkage deubiquitinase USP2. The smear stays intact when the deubiquitinases are heat-inactivated (†) prior to the eluate treatment. An overexposed anti-NeonGreen blot is shown to better visualize the smears. The asterisk points to the band of USP2 added protein that overlaps with the MRAP23FLAG band. MC4R, melanocortin receptor 4; MRAP2, melanocortin receptor accessory protein 2; UBD, ubiquitin-binding domain.
Fig 8
Fig 8. Acceptor lysines required for ciliary exit are distributed on MC4R and its ciliary partners.
(A) Representative images of IMCD3-[MRAP23FLAG;MC4R3NG] cells transiently transfected with cilia-targeted K63-specific deubiquitinase catalytic domain of AMSH (cilia-K63DUB), the catalytically inactive counterpart (cilia-K63DUB) or the cilia targeting sequence alone fused to the mScarlet reporter (cilia-) used for all constructs. DNA (cyan), transiently transfected construct (white), MC4R3NG (yellow), cilia (acetylated tubulin, magenta). The white, yellow, and magenta channels have been shifted in the insets for better visualization. Scale bars: 5 μm (main panel) and 1 μm (inset). (B) Superplot comparing the ciliary fluorescence intensity of IMCD3-[MRAP23FLAG;MC4R3NG] cells transiently transfected with cilia-targeted K63-specific deubiquitinase catalytic domain of AMSH (cilia-K63DUB), the catalytically inactive counterpart (cilia-K63DUB) or the cilia targeting sequence alone fused to the mScarlet reporter (cilia-). n = 3 independent experiments. Data points belonging to each different experiment are encoded by translucent points of different color and shape. The average of each experiment is represented by solid points. A solid line has been used to represent the median of global data and dashed lines to represent the interquartile values. Asterisks indicate statistical significance values calculated by one-way ANOVA on individual cilia followed by Tukey post hoc test (**** p < 0.0001). All underlying data are found S1 Data. (C) Serpentine schematic representing the location of the lysine-to-arginine substitutions (lysine appears as a filled circle, whereas arginine appears as an empty circle) in MC4R3NG (pink) and MRAP23FLAG (orange). Representative images of non-clonal IMCD3 lines stably co-expressing combinations of wild-type MRAP23FLAG/MC4R3NG (WT) or the ubiquitination-refractory variants where the intracellular lysines have been substituted by arginine residues (cK0). DNA (cyan), MRAP23FLAG (white), MC4R3NG (yellow), cilia (acetylated tubulin, magenta). The white, yellow, and magenta channels have been shifted in the insets for better visualization. Scale bars: 5 μm (main panel) and 1 μm (inset). (D) Superplot comparing the ciliary fluorescence intensity of MC4R3NG in non-clonal IMCD3 lines stably co-expressing wild-type MRAP23FLAG/MC4R3NG (WT, serpentine schematic without empty circles), or the ubiquitination-refractory variants where the intracellular lysines have been substituted by arginine residues (K0, serpentine schematic with empty circles indicating the location of the lysine-to-arginine substitution). n = 3 independent experiments. Data points belonging to each different experiment are encoded by translucent points of different color and shape. The average of each experiment is represented by solid points. A solid line has been used to represent the median of global data and dashed lines to represent the interquartile values. Asterisks indicate statistical significance values calculated by one-way ANOVA on individual cilia followed by Tukey post hoc test (** p < 0.005; **** p < 0.0001). (E) Representative images of IMCD3-[MRAP2cK03FLAG;MC4R cK03NG] cells transiently transfected with the cilia-targeted K63-specific deubiquitinase catalytic domain of AMSH (cilia-K63DUB), the catalytically inactive counterpart (cilia-K63DUB) or the cilia targeting sequence alone fused to the mScarlet reporter (cilia-). DNA (cyan), transiently transfected construct (white), MC4R3NG (yellow), cilia (acetylated tubulin, magenta). The white, yellow, and magenta channels have been shifted in the insets for better visualization. Scale bars: 5 μm (main panel) and 1 μm (inset). All underlying data are found S1 Data. (F) Superplot comparing the ciliary fluorescence intensity of IMCD3-[MRAP2cK03FLAG;MC4R cK03NG] cells transiently transfected with cilia-targeted K63-specific deubiquitinase catalytic domain of AMSH (cilia-K63DUB), the catalytically inactive counterpart (cilia-K63DUB) or the cilia targeting sequence alone fused to the mScarlet reporter (cilia-). n = 3 independent experiments. Data points belonging to one individual experiment are encoded by translucent points of a specific color and shape. The average of each experiment is represented by solid points. A solid line has been used to represent the median of global data and dashed lines to represent the interquartile values. Asterisks indicate statistical significance values calculated by one-way ANOVA on individual cilia followed by Tukey post hoc test (**** p < 0.0001). All underlying data are found S1 Data. MC4R, melanocortin receptor 4; MRAP2, melanocortin receptor accessory protein 2.
Fig 9
Fig 9. General and MC4R-specific models of regulated trafficking.
Most ciliary GPCRs undergo exit once activated by their agonist. In the case of MC4R, exit is spontaneous in the absence of ligand and only in the presence of an inverse agonist does MC4R exit become interrupted. In both models, β-arrestin senses the activated state of the GPCR (agonist bound for most GPCRs, ligand free or agonist-bound for MC4R) and recruits the ubiquitination machinery to the activated GPCR. Unique to MC4R is that the receptor constitutively couples to β-arrestin. Once ubiquitinated, ciliary GPCRs are committed for retrieval back into the cell via TOM1L2 (dark purple) which endows the BBSome (pink) with the ability to recognize ubiquitin chains and move ubiquitinated proteins out of cilia. AgRP, agouti-related peptide; GPCR, G protein-coupled receptor; MC4R, melanocortin receptor 4; MRAP2, melanocortin receptor accessory protein 2.

References

    1. Friedman JM. Leptin and the endocrine control of energy balance. Nat Metab. 2019;1:754–764. doi: 10.1038/s42255-019-0095-y - DOI - PubMed
    1. Lowell BB. New Neuroscience of Homeostasis and Drives for Food, Water, and Salt. N Engl J Med. 2019;380:459–471. doi: 10.1056/NEJMra1812053 - DOI - PubMed
    1. Coll AP, Farooqi IS, O’Rahilly S. The hormonal control of food intake. Cell. 2007;129:251–262. doi: 10.1016/j.cell.2007.04.001 - DOI - PMC - PubMed
    1. Anvarian Z, Mykytyn K, Mukhopadhyay S, Pedersen LB, Christensen ST. Cellular signalling by primary cilia in development, organ function and disease. Nat Rev Nephrol. 2019;15:199–219. doi: 10.1038/s41581-019-0116-9 - DOI - PMC - PubMed
    1. Nachury MV, Mick DU. Establishing and regulating the composition of cilia for signal transduction. Nat Rev Mol Cell Biol. 2019;20:389–405. doi: 10.1038/s41580-019-0116-4 - DOI - PMC - PubMed