

Temporal shifts in dengue epidemic in Guangdong Province before and during the COVID-19 pandemic: a Bayesian model study from 2012 to 2022
- PMID: 39899610
- PMCID: PMC11805405
- DOI: 10.1371/journal.pntd.0012832
Temporal shifts in dengue epidemic in Guangdong Province before and during the COVID-19 pandemic: a Bayesian model study from 2012 to 2022
Abstract
Background: During the coronavirus disease 2019 (COVID-19) pandemic, the implementation of public health intervention measures have reshaped the transmission patterns of other infectious diseases. We aimed to analyze the epidemiological characteristics of dengue in Guangdong Province, China, and to investigate the temporal shifts in dengue epidemic in Guangdong Province during the COVID-19 pandemic.
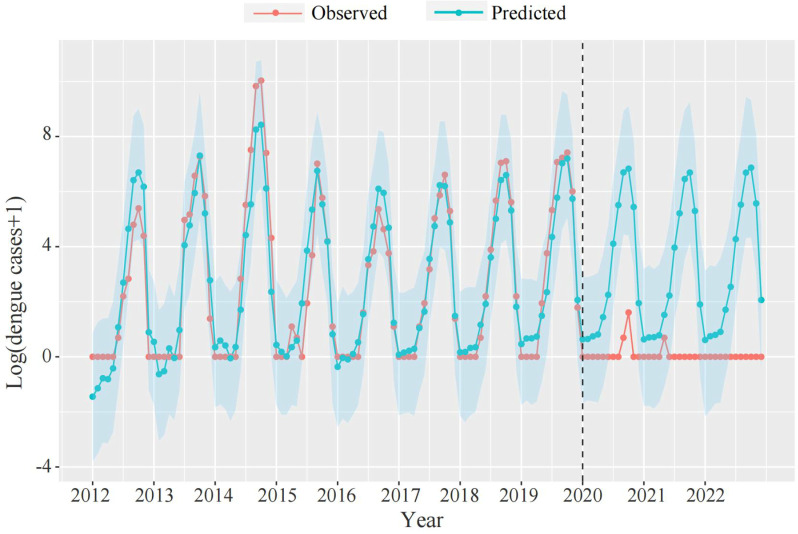
Methods: Based on the data of dengue reported cases, meteorological factors, and mosquito vector density in Guangdong Province from 2012 to 2022, wavelet analysis was applied to investigate the relationship between the dengue incidence in Southeast Asian (SEA) countries and the local dengue incidence in Guangdong Province. We constructed the dengue importation risk index to assess the monthly risk of dengue importation. Based on the counterfactual framework, we constructed the Bayesian structural time series (BSTS) model to capture the epidemic trends of dengue.
Results: Wavelet analysis showed that the local dengue incidence in Guangdong Province was in phase correlation with the dengue incidence of the prior month in relative SEA countries. The dengue importation risk index showed an increasing trend from 2012 to 2019, then decreased to a low level during the COVID-19 pandemic. From 2020 to 2022, the average annual number of reported imported cases and local cases of dengue in Guangdong Province were 26 and 2, respectively, with a decrease of 95.62% and 99.94% compared to the average during 2017-2019 (594 imported cases and 3,118 local cases). According to BSTS model estimates, 6557 local dengue cases may have been reduced in Guangdong Province from 2020 to 2022, with a relative reduction of 99.91% (95%CI: 98.85-99.99%).
Conclusion: The incidence of dengue in Guangdong notably declined from 2020 to 2022, which may be related to the co-benefits of COVID-19 intervention measures and the intensified interventions against dengue during that period. Furthermore, our findings further supported that dengue is not currently endemic in Guangdong.
Copyright: © 2025 Xu et al. This is an open access article distributed under the terms of the Creative Commons Attribution License, which permits unrestricted use, distribution, and reproduction in any medium, provided the original author and source are credited.
Conflict of interest statement
The authors have declared that no competing interests exist.
Figures


Similar articles
-
[Analysis of the impact of health management measures for entry personnel on imported Dengue fever in Guangdong Province, 2020-2022].Zhonghua Liu Xing Bing Xue Za Zhi. 2023 Jun 10;44(6):954-959. doi: 10.3760/cma.j.cn112338-20221021-00899. Zhonghua Liu Xing Bing Xue Za Zhi. 2023. PMID: 37380419 Chinese.
-
Assessing the impact of COVID-19 interventions on the hand, foot and mouth disease in Guangdong Province, China: a Bayesian modeling study.Front Public Health. 2024 Jan 11;11:1307321. doi: 10.3389/fpubh.2023.1307321. eCollection 2023. Front Public Health. 2024. PMID: 38348379 Free PMC article.
-
Phylodynamics unveils invading and diffusing patterns of dengue virus serotype-1 in Guangdong, China from 1990 to 2019 under a global genotyping framework.Infect Dis Poverty. 2024 Jun 11;13(1):43. doi: 10.1186/s40249-024-01211-6. Infect Dis Poverty. 2024. PMID: 38863070 Free PMC article.
-
Travel-related control measures to contain the COVID-19 pandemic: a rapid review.Cochrane Database Syst Rev. 2020 Oct 5;10:CD013717. doi: 10.1002/14651858.CD013717. Cochrane Database Syst Rev. 2020. Update in: Cochrane Database Syst Rev. 2021 Mar 25;3:CD013717. doi: 10.1002/14651858.CD013717.pub2. PMID: 33502002 Updated.
-
International travel-related control measures to contain the COVID-19 pandemic: a rapid review.Cochrane Database Syst Rev. 2021 Mar 25;3(3):CD013717. doi: 10.1002/14651858.CD013717.pub2. Cochrane Database Syst Rev. 2021. PMID: 33763851 Free PMC article.
Cited by
-
Clinical features and laboratory indicators of dengue infection in China: a retrospective study of adult patients in a hospital of traditional Chinese medicine.Front Med (Lausanne). 2025 Jul 7;12:1624554. doi: 10.3389/fmed.2025.1624554. eCollection 2025. Front Med (Lausanne). 2025. PMID: 40692953 Free PMC article.
References
MeSH terms
LinkOut - more resources
Full Text Sources
Medical
