. 2025 Feb 3;9(2):e0613.
doi: 10.1097/HC9.0000000000000613. eCollection 2025 Feb 1.

Deletion of sphingosine 1-phosphate receptor 1 in myeloid cells reduces hepatic inflammatory macrophages and attenuates MASH

Affiliations

Deletion of sphingosine 1-phosphate receptor 1 in myeloid cells reduces hepatic inflammatory macrophages and attenuates MASH

Gopanandan Parthasarathy et al. Hepatol Commun. .

Abstract

Background: Immune cell-driven inflammation is a key mediator of metabolic dysfunction-associated steatohepatitis (MASH) progression. We have previously demonstrated that pharmacological sphingosine 1-phosphate (S1P) receptor modulation ameliorates MASH and is associated with attenuated accumulation of intrahepatic macrophage and T-cell subsets. Although S1P receptors are expressed on several immune cell types, given the prominent role of monocyte-derived recruited macrophages in the sterile inflammation of MASH, we hypothesized that deletion of S1P receptor 1 (S1P1) on myeloid cells may ameliorate MASH by reducing the accumulation of proinflammatory monocyte-derived macrophages in the liver.

Methods: The LyzMCre approach was used to generate myeloid cell-specific knockout mice, termed S1pr1MKO. Littermate S1pr1loxp/loxp mice were used as wild-type controls. MASH was established by feeding mice a high-fat, -fructose, and -cholesterol (FFC) diet for 24 weeks, which led to the development of steatohepatitis and MASH-defining cardiometabolic risk factors. Liver injury and inflammation were determined by histological and gene expression analyses. Intrahepatic leukocyte populations were analyzed by mass cytometry and immunohistochemistry.

Results: Histological examination demonstrated a reduction in liver inflammatory infiltrates and fibrosis in high-fat, -fructose, and -cholesterol-fed S1pr1MKO compared to wild-type. There was a corresponding reduction in alanine aminotransferase, a sensitive marker for liver injury. As determined by mass cytometry, a significant decrease in recruited macrophages was noted in the livers of high-fat, -fructose, and -cholesterol-fed S1pr1MKO mice compared to wild-type. Gene ontology pathway analysis revealed significant suppression of the peroxisome proliferator-activated receptor gamma and mitogen-activated protein kinase pathways in S1pr1MKO consistent with attenuated MASH in mice.

Conclusions: Deletion of S1P1 in myeloid cells is sufficient to attenuate intrahepatic accumulation of monocyte-derived macrophages and ameliorate murine MASH.


Conflict of interest statement

The authors have no conflicts to report.

Figures

None
Graphical abstract
FIGURE 1
FIGURE 1
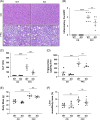
S1P deletion in myeloid cells reduces liver injury in MASH. (A) H&E staining shows liver histology for S1pr1 loxp/loxp WT and S1pr1 MKO mice in CD and FFC cohorts. (B) Inflammatory foci graded according to the NAS for CD- and FFC-fed S1pr1 loxp/loxp and S1pr1 MKO mice. Each mouse was graded based on inflammatory foci as follows: if per ×20 field, there are no inflammatory foci = 0, <2 inflammatory foci = 1, 2–4 inflammatory foci = 2, >4 inflammatory foci = 3. Each dot represents 1 biological replicate. Ten random fields were assessed per mouse sample and averaged. (C) Plasma ALT levels, (D) liver triglyceride content, (E) terminal body mass, and (F) relative liver weight (liver mass/body mass) for CD- and FFC-fed S1pr1 loxp/loxp WT and S1pr1 MKO mice. **p < 0.01, ***p < 0.001, **** p < 0.0001. Abbreviations: CD, chow diet; FFC, high-fat, -fructose, and -cholesterol; H&E, hematoxylin and eosin; MASH, metabolic dysfunction–associated steatohepatitis; NAS, NAFLD activity score; S1P, sphingosine 1-phosphate; WT, wild type.
FIGURE 2
FIGURE 2
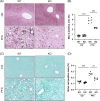
Liver inflammation and fibrosis are reduced in FFC-fed S1pr1 MKO mice. (A) Representative images showing Mac-2–stained liver sections in CD- and FFC-fed S1pr1 loxp/loxp WT and S1pr1 MKO mice. (B) Quantification of percent surface area of Mac-2–stained liver sections. (C) Representative images showing Picrosirius red–stained liver sections in CD- and FFC-fed S1pr1 loxp/loxp WT and S1pr1 MKO mice. (D) Quantification of positive Picrosirius red–stained areas. **p < 0.01, ***p < 0.001. Abbreviations: CD, chow diet; FFC, high-fat, -fructose, and -cholesterol; WT, wild type.
FIGURE 3
FIGURE 3
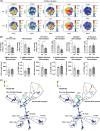
Proinflammatory gene expression is reduced in FFC-fed S1pr1 MKO mice. RNA was isolated from CD- and FFC-fed S1pr1 loxp/loxp WT and S1pr1 MKO whole liver and used for RNA sequencing. (A) PC analysis shows the clustering of samples with predictive relationships based on differential gene expression. PC 1 (x-axis) and PC 2 (y-axis) explain the largest variation in the data set. Sample PC 1 and PC 2 scores are calculated based on each sample’s “influence score,” or how much it influenced each principal component. Samples that are like each other will cluster together. (B) Volcano plot displays genes that have significant fold changes and p values between FFC-fed S1pr1 loxp/loxp WT and S1pr1 MKO mice. (C) Bar graphs display RPKM values for Timd4, Marco, Ly6G, and Ccl2 in CD- and FFC-fed S1pr1 loxp/loxp WT and S1pr1 MKO mice. (D) Gene ontology pathway analysis displays significant enrichment of suppressed pathways in FFC-fed S1pr1 MKO mice. Circle size refers to the amount of differently expressed genes enriched in the respective pathway, and the color of the circle denotes the enrichment significance of the bubble *p < 0.05, **p < 0.01, ***p < 0.001. Abbreviations: CD, chow diet; FFC, high-fat, -fructose, and -cholesterol; PC, principal components; RPKM, reads per kilobase per million mapped reads; WT, wild type.
FIGURE 4
FIGURE 4
CyTOF analysis shows an increase in restorative macrophages in S1pr1 MKO mice. (A) viSNE analysis of all macrophages in FFC-fed S1pr1 loxp/loxp WT and S1pr1 MKO mice for 24 weeks on a diet. viSNE plots depict tSNE1 (y-axis) versus tSNE2 (x-axis) of clustering after viSNE analysis and are colored by expression levels of CX3CR1, Timd4, CD206, Ly6C, and CCR2. (B) Number and percentage of recruited and resident macrophages, Timd4+ and CD206+ resident macrophages, and CCR2+ recruited macrophages. (C) SPADE analysis on CD45+ cells resulted in all events being organized into a SPADE tree. Immune cell populations were identified among the cellular clusters in the SPADE tree. The color channel displays Timd4 expression in all clusters. Node size represents cellular abundance. *p < 0.05. Abbreviations: CyTOF, mass cytometry by time-of-flight; FFC, high-fat, -fructose, and -cholesterol; PC, principal components; tSNE, t-distributed stochastic neighbor embedding; WT, wild type.
FIGURE 5
FIGURE 5
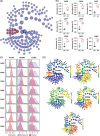
CITRUS analysis of intrahepatic leukocytes identified a significant increase in the abundance of macrophage clusters in FFC-fed S1pr1MKO mice. (A) Radial hierarchy tree of CITRUS defined 8 clusters that have significantly altered median abundances between FFC-fed S1pr1 loxp/loxp WT and S1pr1 MKO mice. (B) Boxplots show the difference in abundance for FFC-fed S1pr1 loxp/loxp WT and S1pr1 MKO mice in each of the significant clusters identified in the CITRUS analysis. Each individual value represents 1 biological replicate. (C) Line graph overlays display differences in median expression of Timd4, CD206, and CCR2 between FFC-fed S1pr1 loxp/loxp WT and S1pr1 MKO mice. (D) Marker plots show expression levels of various marker channels (Timd4, CX3CR1, CD206, CCR2, and Ly6C) layered on top of the CITRUS hierarchy tree in a heatmap visualization. *p < 0.05, **p < 0.01, ***p < 0.001. Abbreviation: FFC, high-fat, -fructose, and -cholesterol.
FIGURE 6
FIGURE 6
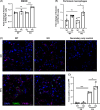
S1P1-deficient macrophages are susceptible to palmitate-induced cell death. (A) Quantification of apoptotic BMDMs isolated from CD-fed S1pr1 loxp/loxp (WT) and S1pr1 MKO (KO) mice treated for 20 hours with vehicle (VC) or 400 µM palmitic acid (PA). (B) Quantification of apoptotic peritoneal macrophages isolated from CD-fed S1pr1 loxp/loxp (WT) and S1pr1 MKO (KO) mice treated for 20 hours with vehicle (VC) or 400 µM palmitic acid (PA). (C) Representative images of F4/80 immunofluorescence signal (pink), TUNEL-positive signal (green), and nuclei (blue) stained liver sections in CD-fed and FFC-fed S1pr1 loxp/loxp WT and S1pr1 MKO mice. (D) Quantification of TUNEL-positive nuclei per HPF. *p < 0.05, ***p < 0.001. Abbreviations: BMDM, bone marrow–derived macrophages; CD, chow diet; FFC, high-fat, -fructose, and -cholesterol; HPF, high power field; WT, wild type

References

    1. Parthasarathy G, Revelo X, Malhi H. Pathogenesis of nonalcoholic steatohepatitis: An overview. Hepatol Commun. 2020;4:478–492. - PMC - PubMed
    1. Morinaga H, Mayoral R, Heinrichsdorff J, Osborn O, Franck N, Hah N, et al. Characterization of distinct subpopulations of hepatic macrophages in HFD/obese mice. Diabetes. 2015;64:1120–1130. - PMC - PubMed
    1. Kakazu E, Mauer AS, Yin M, Malhi H. Hepatocytes release ceramide-enriched pro-inflammatory extracellular vesicles in an IRE1alpha-dependent manner. J Lipid Res. 2016;57:233–245. - PMC - PubMed
    1. Malhi H, Gores GJ. Molecular mechanisms of lipotoxicity in nonalcoholic fatty liver disease. Semin Liver Dis. 2008;28:360–369. - PMC - PubMed
    1. Nehra V, Angulo P, Buchman AL, Lindor KD. Nutritional and metabolic considerations in the etiology of nonalcoholic steatohepatitis. Dig Dis Sci. 2001;46:2347–2352. - PubMed

Substances