In Vivo Bone Mineral Density Assessment With Spectral Localizer Radiographs From Photon-Counting Detector CT: Prospective Comparison With DXA
- PMID: 39899807
- PMCID: PMC12233169
- DOI: 10.1097/RLI.0000000000001159
In Vivo Bone Mineral Density Assessment With Spectral Localizer Radiographs From Photon-Counting Detector CT: Prospective Comparison With DXA
Abstract
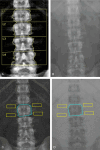
Purpose: The aim of this study was to determine in a prospective patient study the accuracy of areal bone mineral density (aBMD) measurements with spectral localizer radiographs obtained with a clinical photon-counting detector computed tomography (PCD-CT) scanner in comparison with dual-energy x-ray absorptiometry (DXA).
Methods: In this institutional review board-approved, prospective study, 41 patients (15 females, 26 males; mean age 61.3 years, age range 35-78 years) underwent PCD-CT of the abdomen with a spectral localizer radiograph (tube voltage 140 kVp, tube current 30 mA) and DXA within a median of 45 days. aBMD values were derived for lumbar vertebrae L1-L4 from both methods and were compared with linear regression, Pearson correlation, intraclass correlation coefficients (ICCs), and Bland-Altman plots. T-scores were calculated on a patient level and were compared between methods.
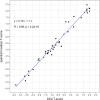
Results: DXA and spectral localizer radiographs showed strong correlation in aBMD measurements ( R = 0.97, P < 0.001) and patient level T-scores ( R = 0.99, P < 0.001). There was a strong agreement between aBMD from both methods (ICC, 0.96; 95% CI, 0.94-0.97). Bland-Altman analysis revealed a very small mean difference in aBMD between methods (mean absolute error 0.019 g/cm 2 ) with narrow limits of agreement (-0.083 g/cm 2 to 0.121 g/cm 2 ). Similarly, there were small differences in regard to the T-score (mean absolute error 0.156) with narrow limits of agreement (-0.422 to 0.734) between methods. ICCs indicated an excellent agreement between T-scores from DXA and spectral localizer radiographs (ICC, 0.98; 95% confidence interval, 0.95-0.99).
Conclusions: Our prospective patient study indicates that spectral localizer radiographs obtained with a clinical PCD-CT system enable accurate quantification of the lumbar bone areal mineral density. This opens up the opportunity for opportunistic screening of osteoporosis in patients who undergo CT for other indications.
Keywords: bone mineral density; computed tomography; localizer radiographs; photon-counting detector; spectral imaging.
Copyright © 2025 The Author(s). Published by Wolters Kluwer Health, Inc.
Conflict of interest statement
Conflicts of interest and sources of funding: none declared.
Figures


Similar articles
-
Opportunistic Bone Mineral Density Measurement Using Photon-Counting Detector CT Spectral Localizer Images: A Prospective Study.AJR Am J Roentgenol. 2025 Jan;224(1):e2431909. doi: 10.2214/AJR.24.31909. Epub 2024 Oct 30. AJR Am J Roentgenol. 2025. PMID: 39475199
-
The correlation between osteoporotic vertebrae fracture risk and bone mineral density measured by quantitative computed tomography and dual energy X-ray absorptiometry: a systematic review and meta-analysis.Eur Spine J. 2023 Nov;32(11):3875-3884. doi: 10.1007/s00586-023-07917-9. Epub 2023 Sep 23. Eur Spine J. 2023. PMID: 37740786
-
Photon-counting CT Spectral Localizer Radiographs for Lumbar Areal Bone Mineral Density Quantification: A Clinical Study on Accuracy, Reliability, and Diagnostic Performance for Osteoporosis.Acad Radiol. 2025 Jun;32(6):3540-3551. doi: 10.1016/j.acra.2025.01.038. Epub 2025 Feb 11. Acad Radiol. 2025. PMID: 39934075
-
Photon-counting CT-derived extracellular volume in acute myocarditis: Comparison with cardiac MRI.Diagn Interv Imaging. 2025 Jul-Aug;106(7-8):255-263. doi: 10.1016/j.diii.2025.03.001. Epub 2025 Mar 18. Diagn Interv Imaging. 2025. PMID: 40102107
-
Alternatives to DEXA for the assessment of bone density: a systematic review of the literature and future recommendations.J Neurosurg Spine. 2023 Jan 6;38(4):436-445. doi: 10.3171/2022.11.SPINE22875. Print 2023 Apr 1. J Neurosurg Spine. 2023. PMID: 36609369
References
-
- Consensus development conference: diagnosis, prophylaxis, and treatment of osteoporosis. Am J Med. 1993;94:646–650. - PubMed
-
- Hernlund E Svedbom A Ivergård M, et al. Osteoporosis in the European Union: medical management, epidemiology and economic burden. A report prepared in collaboration with the International Osteoporosis Foundation (IOF) and the European Federation of Pharmaceutical Industry Associations (EFPIA). Arch Osteoporos. 2013;8:136. - PMC - PubMed
-
- US Preventive Services Task Force, Curry SJ Krist AH, et al. Screening for osteoporosis to prevent fractures: US preventive services task force recommendation statement. JAMA. 2018;319:2521–2531. - PubMed
Publication types
MeSH terms
LinkOut - more resources
Full Text Sources
Medical

