. 2025 Apr:207:106819.
doi: 10.1016/j.nbd.2025.106819. Epub 2025 Feb 1.

B cells upregulate NMDARs, respond to extracellular glutamate, and express mature BDNF to protect the brain from ischemic injury

Affiliations

B cells upregulate NMDARs, respond to extracellular glutamate, and express mature BDNF to protect the brain from ischemic injury

Vanessa O Torres et al. Neurobiol Dis. 2025 Apr.

Abstract

Following stroke, B cells enter brain regions outside of the ischemic injury to mediate functional recovery. Although B cells produce neurotrophins that support remote plasticity, including brain-derived neurotrophic factor (BDNF), it remains unclear which signal(s) activate B cells in the absence of infarct-localized pro-inflammatory cues. Activation of N-methyl-d-aspartate (NMDA)-type receptor (NMDAR) subunits on neurons can upregulate mature BDNF (mBDNF) production from a pro-BDNF precursor, but whether this occurs in B cells is unknown. We identified GluN2A and GluN2B NMDAR subunits on B cells that respond to glutamate and mediate nearly half of the glutamate-induced Ca2+ responses in activated B cell subsets. Ischemic stroke recruits GluN2A+ B cells into the ipsilesional hemisphere and both stroke and neurophysiologic levels of glutamate regulate gene and surface expression. Regardless of injury, pro-BDNF+ B cells localize to spleen/circulation whereas mBDNF+ B cells localize to the brain, including in aged male and female mice. We confirmed B cell-derived BDNF was required for in vitro and in vivo B cell-mediated neuroprotection. Lastly, GluN2A, GluN2B, glutamate-induced Ca2+ responses, and BDNF expression were all clinically confirmed in B cells from healthy donors, with BDNF+ B cells present in post-stroke human parenchyma. These data suggest that B cells express functional NMDARs that respond to glutamate, enhance NMDAR signaling with activation, and upregulate mature BDNF expression within the brain. This study identifies potential glutamate-induced neurotrophic roles for B cells in the brain; an immune response to neurotransmitters unique from established pro-inflammatory stimuli and relevant to any CNS-localized injury or disease.

Keywords: B lymphocytes; Brain-derived neurotrophic factor; Cerebral ischemia; GluN2A; GluN2B; IL-10; Neuroprotection.


Conflict of interest statement

Declaration of competing interest The authors declare that they have no known competing financial interests or personal relationships that could have appeared to influence the work reported in this paper.

Figures

Fig. 1.
Fig. 1.
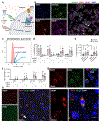
B cell NMDARs are engaged after stroke injury and glutamate treatment. (a) Images of GluN2A subunit expression on hippocampal neurons with higher magnification inset to the right (GluN2A (red); DAPI (blue) show punctate neuronal staining (scale bar 25 μm). (b,c) Images at 120× magnification of (b) GluN2A and (c) GluN2B subunit expression on uninjured splenic B220+ B cells show a similar pattern of expression (GluN2A (red); B220 (green); DAPI (blue)), evident in sequential GluN2A confocal z-stack images (scale bar 10 μm). Assessment of (d) GluN2A and (e) GluN2B surface protein expression (n = 3 mice, 2 images/mouse, average of 14.10 ± 0.94 B cells counted per image) in uninjured (circles; white bars) and 4-day post-stroke (squares; red bars) splenic B220+ B cells. Splenic B cells following a 24-h treatment with 1 μM glutamate show an effect of both stroke and LPS stimulation on subunit expression. Significance determined by mixed effects three-way ANOVA (LPS vs. glutamate vs. tMCAo) with interaction significance shown in Supplemental Table 1. (f) A novel flow cytometry panel identified GluN2A B220+ B cells isolated from mouse (left) spleen and (right) brain tissue. Example histograms are from a post-stroke animal, with gating strategy in Supp. Fig. 2. (g-i, please note % and count data in same subpanel). (g) The (left) percents and (right) counts of GluN2A B220+ B cells isolated from the left/ipsilesional (ipsi) and right/ contralesional (contra) hemispheres 4 days following sham surgery or tMCAo were compared to splenic and blood samples within the same mouse. GluN2A percent and count were both affected by tMCAo within the brain, with higher expression in the ipsilesional hemisphere. This did not occur for (h) GluN2B. (i) Flow cytometry identified GluN2A on B220+CD38+ memory B cells and found the highest CNS percent expression in the ipsilesional hemisphere after stroke, which was also elevated in counts. Statistics determined by repeated measure two-way ANOVA (tissue vs. tMCAo). #p < 0.05, ##p < 0.01, ###p < 0.001 vs. splenic population within a cohort or *p < 0.05, **p < 0.01 as indicated by brackets. (For interpretation of the references to colour in this figure legend, the reader is referred to the web version of this article.)
Fig. 2.
Fig. 2.
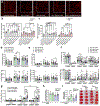
Mouse B cell subsets exhibit distinct Ca2+ responses to glutamate. (a) Representative time course for Ca2+ flux from one uninjured splenic sample for various B cell subsets identified by flow cytometry. (b) General Ca2+ response to ionomycin (grey bars) in splenic B cells isolated from uninjured mice (top graph, circles) and mice 4 days following tMCAo (bottom graph, squares). Ca2+ responses to anti-IgM (turquoise bars) and glutamate (L-glu; red bars) are significantly higher than the EGTA controls (blue bars) in uninjured subsets only. (c) The distribution of B cell subset Ca2+ flux normalized to ionomycin of uninjured (white bars, circles) and post-stroke (red bars, squares) mice in resting (open symbols) and LPS-activated (filled symbols) conditions. The individual Ca2+ responses to 1 μM glutamate are dependent on subset, with significant increase in Ca2+ flux for activated effector, regulatory B cell (Breg) and B220+ antibody secreting cell (ASC) populations. (d) Time to peak Ca2+ flux for each sample in seconds. (e) The Ca2+ flux of B220+ ASCs to 1 μM glutamate in the presence or absence of NMDAR antagonists TCN201 (GluN2A-targeting), Ifenprodil (GluN2b-targeting), or DAPV (competitive NMDAR antagonist). Significance determined by (b) one-way or (c-e) two-way ANOVA. *p < 0.05, **p < 0.01, ***p < 0.001 vs. unstimulated controls within-sample unless indicated by brackets; n = 5–6 mice per group. (For interpretation of the references to colour in this figure legend, the reader is referred to the web version of this article.)
Fig. 3.
Fig. 3.
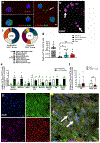
Brain-specific B cells co-localize with mature BDNF. (a) Schematic depicting NMDAR and BDNF signaling in neurons to show pro-survival vs. pro-injury activation via BDNF receptors. (b) Images are from activated (LPS) and glutamate-stimulated splenic B cells isolated by magnetic bead separation, with triple labeling to show GluN2A (Alexa 488; green), B220 (Alexa-594; red) and BDNF (Alexa-647; purple) with DAPI (345; blue) for nuclei (scale bar 50 μm). Strong cytoplasmic expression of BDNF in B220+ B cell denoted by white asterisk and B cells with low B220 expression by white arrow. (c) A novel flow cytometry panel was used to identify mature BDNF (pro-BDNF mBDNF+) vs. pro-BDNF (pro-BDNF+mBDNF ) B220+ B cells isolated from spleen, blood, and left/ipsilesional (ipsi) or right/contralesional (contra) hemispheres at 4 days following sham surgery or tMCAo, respectively. B cells in the double-positive pro-BDNF+mBDNF+ gate were not used in analyses. (d) The percent of pro-BDNF B cells are localized to spleen and blood, while mBDNF B cells are found in the brain, with (e) significant elevation of mBDNF B cell counts compared to the spleen. (f) Mean fluorescent intensity (MFI) of the pro-BDNF and mBDNF antibodies used in flow confirm highest expression in brain-specific B cells. (g-h) Confocal microscopy with double labeling to show B cells (Alexa 488; green), BDNF (Alexa-594; red) with DAPI (345; blue) in (g) healthy brain (scale bar 10 μm) and (h) ipsilesional tissue collected 4 days after a 60-min tMCAo, with two examples of BDNF signal in B220+ B cells within the post-stroke brain (left composite scale bar 20 μm, right composite scale bar 10 μm). Significance determined by mixed-effects or repeated measures two-way or three-way ANOVA. Comparisons of pro vs mature BDNF isoforms is based on statistics (three-way REML: isoforms X tissue X injury) on the single-positive populations (# p < 0.05 vs. within-cohort splenic populations; *p < 0.05, **p < 0.01, ***p < 0.001, ****p < 0.0001 vs. within-tissue proBDNF population unless indicated by bracket); n = 6–11 mice per group. (For interpretation of the references to colour in this figure legend, the reader is referred to the web version of this article.)
Fig. 4.
Fig. 4.
B cell-derived BDNF provides neuronal protection. (a) Images at 10× magnification of microtubule-associated protein (MAP2) neurons (red) co-cultured with WT, BDNF-KO or BDNF-overproducing (i.e., CMV/BDNF/mCh) B cells in uninjured (circles, white bars) and injury (squares, red bars) conditions. Injury included oxygen-glucose deprivation (OGD). Higher magnification inset is also shown (scale bar 50 μm). (b) Number of MAP2+ neurons or (c) neurons with dendrites following a 3–4-day co-culture with BDNF-KO or BDNF-overproducing B cells in the presence or absence of OGD injury. Ratio of B cells:cortical cells shown in parentheses. (d-g) Replication of NMDAR and BDNF flow cytometry in aged female (circles; green bars) and male (squares; blue bars) mice under naïve conditions or 3 weeks after a 30-min tMCAo (red symbols). Aged mice show elevated percent representation (top graphs) and overall population counts (lower graphs) for both (d) GluN2A+ B cell and (e) GluN2B+ B cell populations. (f) As in young mice, splenic B cells expressed mature (m)BDNF vs. proBDNF, but aged mice showed elevated populations for both neurotrophic subsets. (g) Only mBDNF B cells showed elevated mean fluorescence intensity (MFI) on flow cytometry, with similar intensity to young males in Fig. 3. (h, i) Induction of a 30-min tMCAo in tamoxifen-treated female (traingles, green bars) or male (triangles, blue bars) aged mice, with transgenic animals depleted of B cell-derived BDNF indicated below the x axis. BDNF+ B cell depletion (h) did not affect initial neurological deficit at time of occlusion but (i) but increased infarct volume in female mice (TTC images from representative mice close to the mean, with white areas indicative of injured tissue). Significance determined by two-way or three-way ANOVA or REML (#p < 0.05, ##p < 0.01, ###p < 0.001, ####p < 0.0001 vs. splenic population within a cohort or *p < 0.05, **p < 0.01, ***p < 0.001, ****p < 0.0001 as indicated by bracket). (For interpretation of the references to colour in this figure legend, the reader is referred to the web version of this article.)
Fig. 5.
Fig. 5.
Human B cells express GluN2A and GluN2B subunits, respond to glutamate stimulation, and co-localize with BDNF. (a) Cytospins from human donor peripheral blood mononuclear cells (PBMCs) show punctate GluN2A staining (red) in B220+ B cells (green) similar to neuronal expression shown in Fig. 1. (scale bar 2 μm) (b) BDNF staining confirms both surface expression as well as cytoplasmic expression of BDNF (white arrows). (c) The distribution of CD27+ B cell subsets in (left) unstimulated or (right) stimulated healthy PBMCs, with significant changes in population percentages identified in the legend beneath the pie charts. (d) The Ca2+ responses of various stimuli normalized to ionomycin in healthy stimulated CD19+ PBMC B cells; the positive response to 1 μM glutamate (L-glu) in 8/8 stimulated healthy donor B cells (black circles) is significantly higher than the EGTA control. (e) The Ca2+ response of positive (open green triangles) and non-responding (closed green triangles along the x-axis) B cell subsets to 1 μM glutamate, with non-responders defined as L-Glu responses not higher than the within-subject EGTA negative control. (f) The Ca2+ response to glutamate (green open triangles) in positive-responding, stimulated plasmablasts (PB)s and CD38+ B10 B cells after antagonizing the GluN2A subunit with TCN201 (red open triangles). (g) Confocal microscopy with triple labeling (white arrows) to show B cells (CD19; Alexa-594; red), BDNF (Alexa-647; purple), GluN2A (Alexa-488; green) with DAPI (345; blue) to confirm BDNF+ B cells in peri-infarct parenchyma in a stroke patient. (scale bar 10 μm). Significance in d and f determined by mixed-effects one-way ANOVA vs. Ionomycin control unless indicated by brackets (*p < 0.05, **p < 0.01, n = 4–9 donors per group). (For interpretation of the references to colour in this figure legend, the reader is referred to the web version of this article.)

References

    1. Baba Y, Kurosaki T, 2016. Role of calcium signaling in B cell activation and biology. Curr. Top. Microbiol. Immunol 393, 143–174. - PubMed
    1. Balkaya M, Cho S, 2019. Genetics of stroke recovery: BDNF val66met polymorphism in stroke recovery and its interaction with aging. Neurobiol. Dis 126, 36–46. - PMC - PubMed
    1. Barouch R, Appel E, Kazimirsky G, Braun A, Renz H, Brodie C, 2000. Differential regulation of neurotrophin expression by mitogens and neurotransmitters in mouse lymphocytes. J. Neuroimmunol 103 (2), 112–121. - PubMed
    1. Bekeredjian-Ding I, Jego G, 2009. Toll-like receptors–sentries in the B-cell response. Immunology 128 (3), 311–323. - PMC - PubMed
    1. Bodhankar S, Chen Y, Vandenbark AA, Murphy SJ, Offner H, 2013. IL-10-producing B-cells limit CNS inflammation and infarct volume in experimental stroke. Metab. Brain Dis 28 (3), 375–386. - PMC - PubMed

Publication types

Substances

LinkOut - more resources