. 2025 Feb 3;16(1):1302.
doi: 10.1038/s41467-025-56518-1.

RECQ4-MUS81 interaction contributes to telomere maintenance with implications to Rothmund-Thomson syndrome

Affiliations

RECQ4-MUS81 interaction contributes to telomere maintenance with implications to Rothmund-Thomson syndrome

Raghib Ashraf et al. Nat Commun. .

Abstract

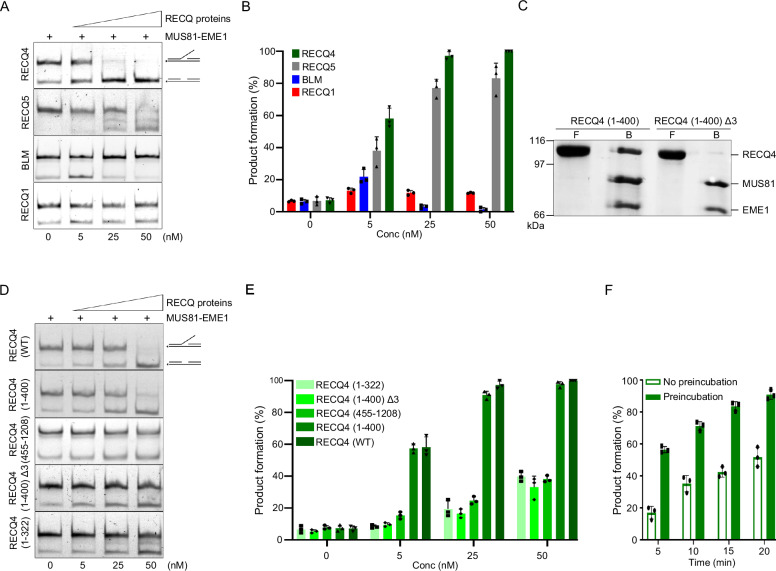
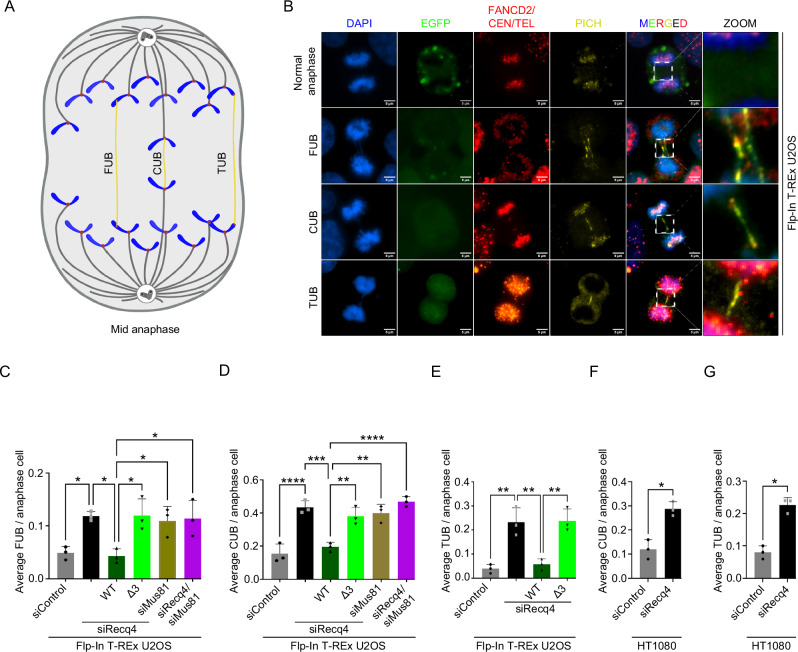
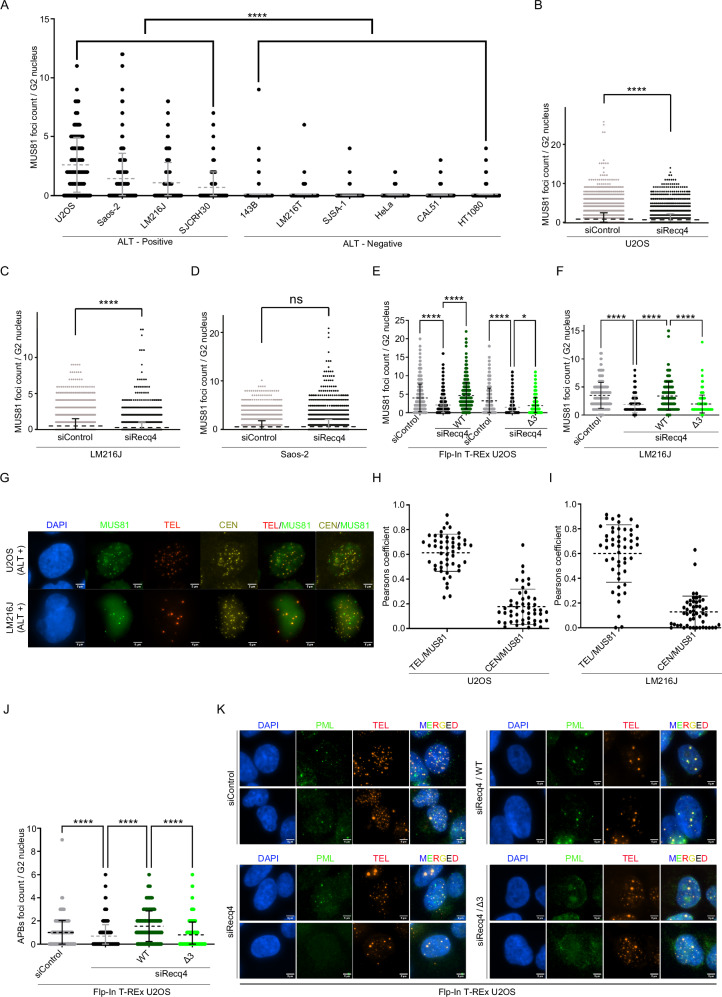
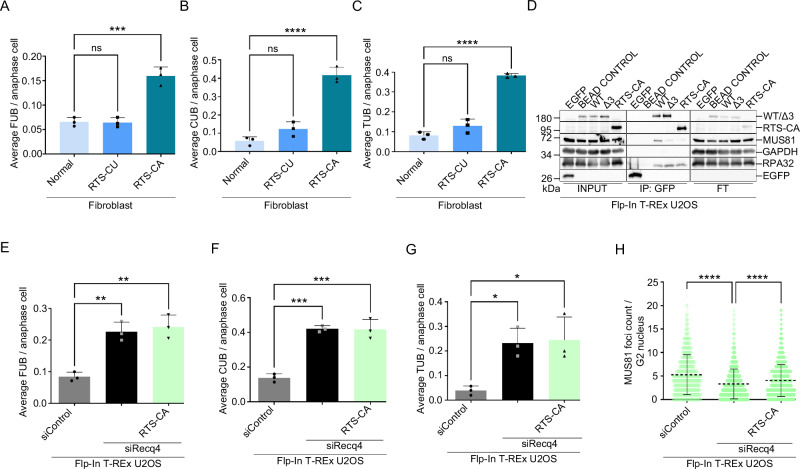
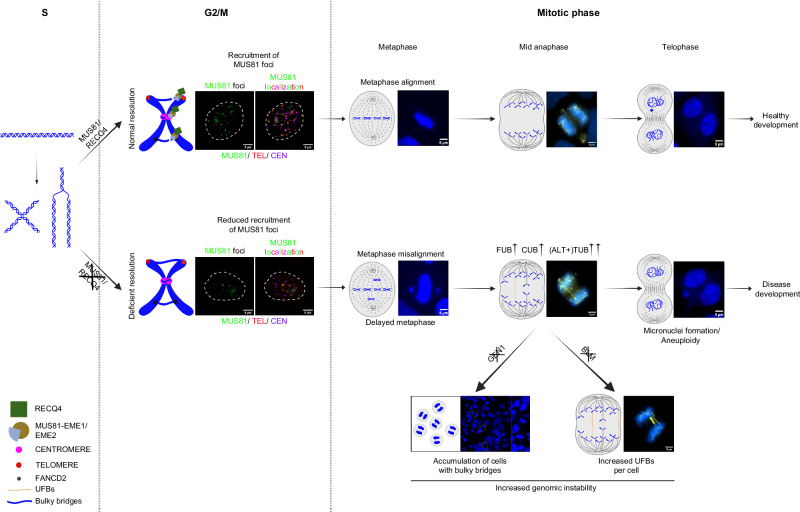
Replication stress, particularly in hard-to-replicate regions such as telomeres and centromeres, leads to the accumulation of replication intermediates that must be processed to ensure proper chromosome segregation. In this study, we identify a critical role for the interaction between RECQ4 and MUS81 in managing such stress. We show that RECQ4 physically interacts with MUS81, targeting it to specific DNA substrates and enhancing its endonuclease activity. Loss of this interaction, results in significant chromosomal segregation defects, including the accumulation of micronuclei, anaphase bridges, and ultrafine bridges (UFBs). Our data further demonstrate that the RECQ4-MUS81 interaction plays an important role in ALT-positive cells, where MUS81 foci primarily colocalise with telomeres, highlighting its role in telomere maintenance. We also observe that a mutation associated with Rothmund-Thomson syndrome, which produces a truncated RECQ4 unable to interact with MUS81, recapitulates these chromosome instability phenotypes. This underscores the importance of RECQ4-MUS81 in safeguarding genome integrity and suggests potential implications for human disease. Our findings demonstrate the RECQ4-MUS81 interaction as a key mechanism in alleviating replication stress at hard-to-replicate regions and highlight its relevance in pathological conditions such as RTS.


Conflict of interest statement

Competing interests: The authors declare no competing interests.

Figures

Fig. 1
Fig. 1. RECQ4 interacts and stimulates MUS81-EME1 endonuclease activity.
A Increasing concentrations of individual RECQ helicases (RECQ4, RECQ5, BLM, and RECQ1) were incubated with 3’-flap DNA substrate (6 nM) in the presence of MUS81-EME1 (0.5 nM) for 20 min. The reaction mixtures were resolved on a native PAGE gel. B Quantification of data in (A); n = 3 independent experiments; data are means ± SD. (C) Interaction of purified MBP-RECQ4 (1-400) and MBP-RECQ4 (1-400) Δ3 with GST-MUS81-EME1. The flow (F) and bound (B) fractions were analysed by SDS-PAGE, followed by Coomassie blue staining. D MUS81-EME1 (0.5 nM) and increasing amounts of RECQ4 (WT), RECQ4 (1-322), RECQ4 (1-400), RECQ4 (1-400) Δ3, and RECQ4 (455-1208) were incubated with 3’flap DNA substrate (6 nM) for 20 min at 37 °C before analysis by native gel electrophoresis. E Quantification of data in (D); n = 3 independent experiments; data are means ± SD. F RECQ4 (1-400) (25 nM) was either preincubated (Preincubation) with 3’-flap DNA substrate (6 nM) followed by the addition of MUS81-EME1 (0.5 nM) or mixed with DNA and MUS81-EME1 without any preincubation (No preincubation). Reactions were incubated for the indicated time at 37 °C prior to analysis by native gel electrophoresis. n = 3 independent experiments; data are means ± SD. Source data are provided as a Source data file.
Fig. 2
Fig. 2. RECQ4 interacts and is required for MUS81 function in cells.
A Immunoprecipitation (IP) was done from whole cell extracts expressing EGFP, EGFP-RECQ4 -WT, and the mutant EGFP-REQ4-Δ3. Proteins from each cell extract (500 µg) were incubated with GFP beads for 1 h and then resolved on SDS-PAGE, followed by western blotting detecting corresponding proteins. Input (IP), and FT fractions were run on different gels respectively. B Quantification of MUS81 binding from data represented in (A); n = 3 independent experiments; data are means ± SD; one-way ANOVA followed by Tukey’s multiple comparison test; p-value were adjusted by GraphPad Prism software; WT vs Δ3 **p = 0.0011. C Cell cycle-specific interaction between RECQ4 and MUS81. IP was done from whole cell extracts expressing EGFP-RECQ4-WT synchronised in different cell cycle phases. Protein from each extract (500 µg) was incubated with GFP beads for 1 h and then resolved on SDS-PAGE, followed by western blotting detecting corresponding proteins. D Graphical representation and representative images of binucleated cells by immunofluorescence with DAPI. Created in BioRender. Ashraf, R. (2025) https://BioRender.com/n17i536. Quantification of the average number of micronuclei per binucleated cell for each treatment; n = 3 independent experiments; data are means ± SD; one-way ANOVA followed by Tukey’s multiple comparison test; p-value were adjusted by GraphPad Prism software; siControl vs siRECQ4 **p = 0.0018; siControl vs siMUS81 ***p = 0.0003; siControl vs siMUS81/siRecq4 ***p = 0.0003. E Representative images and a graphical depiction of anaphase cells with bulky bridges. Created in BioRender. Ashraf, R. (2025) https://BioRender.com/n17i536. Quantification of the average number of bulky bridges per anaphase cell (DAPI positive bridges); n = 3 independent experiments; data are means ± SD; one-way ANOVA followed by Tukey’s multiple comparison test; p-value were adjusted by GraphPad Prism software; siControl vs siRECQ4 **p = 0.0015; siRecq4 vs WT/siRecq4 *p = 0.0155; WT/siRecq4 vs Δ3/siRECQ4 **p = 0.0025; WT/siRecq4 vs siMus81 *p = 0.0135; WT/siRecq4 vs siRecq4/siMus81 **p = 0.0094. Source data are provided as a Source data file.
Fig. 3
Fig. 3. RECQ4 cooperates with MUS81 to prevent ultrafine bridges formation.
A Graphical depiction of ultrafine bridges. Created in BioRender. Ashraf, R. (2025) https://BioRender.com/o36w298. B Representative immunofluorescence images of UFBs stained by PICH, fragile sites visualised by FANCD2 staining, centromere staining by Anti centromere antibodies (CEN), and telomere staining with telomere PNA probe (TEL) in Flp-In T-REx U2OS cells. Scale bar = 5 µm. CE Quantification of the average number of UFBs per anaphase cell with different types of UFBs for each treatment. (C) Fragile sites ultrafine bridges, FUB; n = 3 independent experiments; data are means ± SD; one-way ANOVA followed by Tukey’s multiple comparison test; p-value were adjusted by GraphPad Prism software; siControl vs siRECQ4 *p = 0.0343; siRecq4 vs WT/siRecq4 *p = 0.0211; WT/siRecq4 vs Δ3/siRECQ4 *p = 0.0191; WT/siRecq4 vs siMus81 *p = 0.0449; WT/siRecq4 vs siRecq4/siMus81 *p = 0.0312. (D) Centromeric ultrafine bridges (CUB); n = 3 independent experiments; data are means ± SD; one-way ANOVA followed by Tukey’s multiple comparison test; p-value were adjusted by GraphPad Prism software; siControl vs siRECQ4 ****p < 0.0001; siRecq4 vs WT/siRecq4 ***p = 0.0003; WT/siRecq4 vs Δ3/siRECQ4 **p = 0.0034; WT/siRecq4 vs siMus81 **p = 0.0014; WT/siRecq4 vs siRecq4/siMus81 ****p < 0.0001. (E) Telomeric ultrafine bridges (TUB); n = 3 independent experiments; data are means ± SD; one-way ANOVA followed by Tukey’s multiple comparison test; p-value were adjusted by GraphPad Prism software; siControl vs siRECQ4 **p = 0.0020; siRecq4 vs WT/siRecq4 **p = 0.0039; WT/siRecq4 vs Δ3/siRECQ4 **p = 0.0032. Depletion of endogenous RECQ4 and expression of RECQ4 constructs with doxycycline was done for 48 h. F, G Quantification of the average number of UFBs per anaphase cell in wild-type and RECQ4-depleted HT1080 (ALT-negative) cell line. F Centromeric ultrafine bridges (CUB); n = 3 independent experiments; data are means ± SD; Mann–Whitney test; one-tailed; *p = 0.0500. G Telomeric ultrafine bridges (TUB); n = 3 independent experiments; data are means ± SD; Mann–Whitney test; one-tailed; *p = 0.0500. Source data are provided as source data file.
Fig. 4
Fig. 4. ALT-dependent MUS81 foci require RECQ4 and colocalise with telomeres.
A Quantification of MUS81 foci from IF analysis in a panel of ALT-positive and ALT-negative cell lines. n = minimum 900 cells; data are means ± SD; one-way ANOVA followed by Tukey’s multiple comparison test; p-value were adjusted by GraphPad Prism software; ****p < 0.0001. BD IF analysis of MUS81 foci with indicated siRNA for 48 h. n = minimum 5000 cells; data are means ± SD; Mann Whitney test; (B) U2OS; ****p < 0.0001. (C) LM216J; ****p < 0.0001. (D) Saos-2; ns p = 0.13. E QIBC analysis of MUS81 foci in Flp-In T-REx U2OS cells expressing either EGFP-REQ4-WT or EGFP-RECQ4-Δ3, with indicated siRNA (48 h). n = minimum 5000 cells; data are means ± SD; one-way ANOVA followed by Tukey’s multiple comparison test; p-value were adjusted by GraphPad Prism software; WT set: siControl vs siRECQ4 ****p < 0.0001; siRecq4 vs WT/siRecq4 ****p < 0.0001; Δ3 set: siControl vs siRECQ4 ****p < 0.0001; siRecq4 vs Δ3/siRECQ4 *p = 0.0268. F Quantification of MUS81 foci in LM216J cells transiently transfected with indicated constructs and treated with the specified siRNA for 48 h. n = minimum 200 cells; data are means ± SD; one-way ANOVA followed by Tukey’s multiple comparison test; p-value were adjusted by GraphPad Prism software; siControl vs siRECQ4 ****p < 0.0001; siRecq4 vs WT/siRecq4 ****p < 0.0001; WT/siRecq4 vs Δ3/siRECQ4 ****p < 0.0001. G Representative IF images of MUS81 foci and their colocalization with centromere (CEN) and telomere (TEL) in U2OS and LM216J cells. Scale bar = 5 µm. HI Quantification of data in (G). n = 50 cells in each cell line; data are means ± SD. J Quantification of (APBs) foci in Flp-In T-REx U2OS cells expressing either EGFP-REQ4-WT or EGFP-RECQ4-Δ3, with indicated siRNA (48 h). n = minimum 500 cells; data are means ± SD; one-way ANOVA followed by Tukey’s multiple comparison test; p-value were adjusted by GraphPad Prism software; siControl vs siRECQ4 ****p < 0.0001; siRecq4 vs WT/siRecq4 ****p < 0.0001; WT/siRecq4 vs Δ3/siRECQ4 ****p < 0.0001. K Representative IF images of APBs foci. Source data are provided as a Source data file.
Fig. 5
Fig. 5. RECQ4 exacerbates cellular function when challenged with other resolution pathways.
A Quantification of average bulky bridges per anaphase cell in HEK-293 (GEN1 -/-) and HEK-293 (wild-type) with siRNA as indicated. n = 3 independent experiments; data are means ± SD.; one-way ANOVA followed by Tukey’s multiple comparison test; p-value were adjusted by GraphPad Prism software; GEN1-WT/siControl vs GEN1-WT/siRecq4 **p = 0.0020; GEN1-WT/siControl vs GEN1-KO/siControl ***p = 0.0005; GEN1-WT/siControl vs GEN-KO/siRecq4 ****p < 0.0001; GEN1-WT/siRecq4 vs GEN1-KO/siControl ns p = 0.5461; GEN1-WT/siRecq4 vs GEN-KO/siRecq4 **p = 0.0034; GEN1-KO/siControl vs GEN-KO/siRecq4 *p = 0.0195. B Representative images of HEK-293 (GEN1 -/-) and HEK-293 (wild-type) cells treated with siRNA as indicated. Magnified images of anaphase cells displaying bulky bridges are shown. Scale bar = 5 µm. C Representative images of single and multiple UFBs. Scale bar = 5 µm. D Quantitative analysis of UFBs in U2OS cells (more than one UFB) with siRNA as indicated. n = 3 independent experiments; data are means ± SD.; one-way ANOVA followed by Tukey’s multiple comparison test; p-value were adjusted by GraphPad Prism software; siControl vs siRecq4 ns p = 0.0955; siControl vs siBLM ***p = 0.0007; siControl vs siRecq4/siBLM ****p < 0.0001; siRecq4 vs siBLM *p = 0.0195; siRecq4 vs siRecq4/siBLM ****p < 0.0001; siBLM vs sRecq4/siBLM **p = 0.0021. Source data are provided as a Source data file.
Fig. 6
Fig. 6. Patient-derived mutation phenocopies MUS81-interaction deficient RECQ4 mutation.
AC The average number of UFBs per anaphase cell in clinically affected (RTS-CA) and unaffected (RTS-CU) patient fibroblasts, along with normal fibroblasts as indicated. n = 3 independent experiments; data are means ± SD; one-way ANOVA followed by Tukey’s multiple comparison test; p-value were adjusted by GraphPad Prism software. (A) Fragile sites; Normal vs RTS-CU ns p = 0.9931; normal vs RTS-CA ***p = 0.0003 (B) Centromeric; Normal vs RTS-CU ns p = 0.1527; normal vs RTS-CA ****p < 0.0001. (C) Telomeric; Normal vs RTS-CU ns p = 0.0960; normal vs RTS-CA ****p < 0.0001. D Immunoprecipitation (IP) from whole cell extracts as shown in Fig. 2A except EGFP-RECQ4-RTS-CA mutant was also included. Proteins from each cell extract (500 µg) were incubated with GFP beads for 1 h and then resolved on SDS-PAGE, followed by western blotting detecting corresponding proteins. Input, IP, and FT fractions were run on different gels respectively. EG The average number of UFBs per anaphase cell in Flp-In T-REx U2OS cells expressing EGFP-RECQ4-RTS-CA in combination with siControl or siRECQ4; n = 3 independent experiments; data are means ± SD.; one-way ANOVA followed by Tukey’s multiple comparison test; p-value were adjusted by GraphPad Prism software. (E) Fragile sites; siControl vs siRecq4 **p = 0.0023; siRecq4 vs RTS-CA/siRecq4 **p = 0.0013. (F) Centromeric; siControl vs siRecq4 ***p = 0.0002; siRecq4 vs RTS-CA/siRecq4 ***p = 0.0002. (G) Telomeric; siControl vs siRecq4 *p = 0.0259; siRecq4 vs RTS-CA/siRecq4 *p = 0.0201. H Quantification of the MUS81 foci in Cyclin A positive Flp-In T-REx U2OS (EGFP-RECQ4-RTS-CA) cells in combination with siRNA as indicated from QIBC analysis in Supplementary Fig. 5I; n = minimum 5000 cells; data are means ± SD; one-way ANOVA followed by Tukey’s multiple comparison test; p-value were adjusted by GraphPad Prism software; siControl vs siRecq4 ****p < 0.0001; siControl vs RTS-CA/siRecq4 ****p < 0.0001. Source data are provided as a Source data file.
Fig. 7
Fig. 7. Model of RECQ4 coordination with MUS81 in processing replication/recombination intermediates.
MUS81 interacts with RECQ4 in the S phase and stimulates MUS81-EME2 to resolve replication, recombination intermediates/stalled replication forks. During the G2/M transition, RECQ4 further activates MUS81 in the form of MUS81-EME1 which helps in the resolution of Holliday junction/late replication intermediates, at this stage MUS81 foci are visible and colocalise predominantly with telomeres and partially with centromeres. The proper operation and activation of MUS81 complexes play a crucial role in ensuring a seamless transition from prometaphase to anaphase by preventing misalignment and the build-up of UFBs (with TUBs being more vulnerable in ALT-positive cells). These actions ultimately prevent the formation of micronuclei, which can lead to aneuploidy and disease development, including RTS. Loss of RECQ4 in the background of GEN1 knockout makes the cells very sick further proposing GEN1 as an essential resolution pathway which possibly is the final resolution check during the progression of the cell cycle as GEN1 is only accessible to DNA during the mitotic phase. Conversely, the depletion of both BLM and RECQ4 leads to an increase in unresolved SCEs, as evidenced by the presence of more UFBs per cell. Scale bar = 5 µm. Created in BioRender. Ashraf, R. (2025) https://BioRender.com/o78n251.

References

    1. Macheret, M. & Halazonetis, T. D. DNA replication stress as a hallmark of cancer. Annu Rev. Pathol.10, 425–448 (2015). - PubMed
    1. Wassing, I. E. & Esashi, F. RAD51: Beyond the break. Semin Cell Dev. Biol.113, 38–46 (2021). - PMC - PubMed
    1. Li, Z. et al. hDNA2 nuclease/helicase promotes centromeric DNA replication and genome stability. EMBO J.37, e96729 (2018). - PMC - PubMed
    1. Tiwari, A., Addis Jones, O. & Chan, K.-L. 53BP1 can limit sister-chromatid rupture and rearrangements driven by a distinct ultrafine DNA bridging-breakage process. Nat. Commun.9, 677 (2018). - PMC - PubMed
    1. Peripolli, S. et al. Oncogenic c-Myc induces replication stress by increasing cohesins chromatin occupancy in a CTCF-dependent manner. Nat. Commun.15, 1579 (2024). - PMC - PubMed

LinkOut - more resources