. 2025 Apr;20(4):532-542.
doi: 10.1038/s41565-024-01847-3. Epub 2025 Feb 3.

Nature-inspired platform nanotechnology for RNA delivery to myeloid cells and their bone marrow progenitors

Affiliations

Nature-inspired platform nanotechnology for RNA delivery to myeloid cells and their bone marrow progenitors

Stijn R J Hofstraat et al. Nat Nanotechnol. 2025 Apr.

Abstract

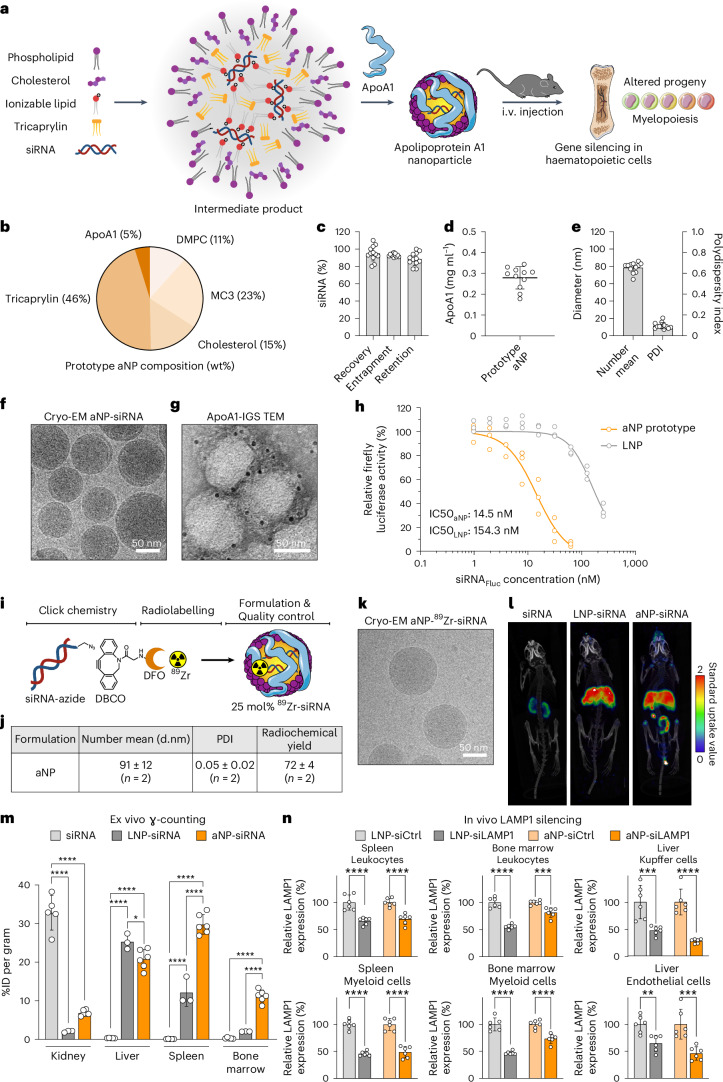
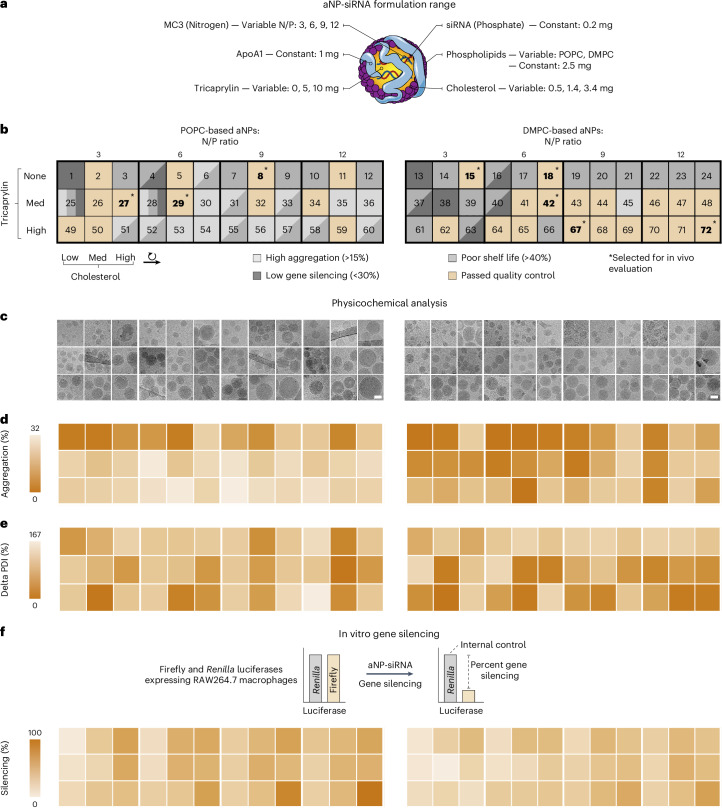
Nucleic acid therapeutics are used for silencing, expressing or editing genes in vivo. However, their systemic stability and targeted delivery to bone marrow resident cells remains a challenge. In this study we present a nanotechnology platform based on natural lipoproteins, designed for delivering small interfering RNA (siRNA), antisense oligonucleotides and messenger RNA to myeloid cells and haematopoietic stem and progenitor cells in the bone marrow. We developed a prototype apolipoprotein nanoparticle (aNP) that stably incorporates siRNA into its core. We then created a comprehensive library of aNP formulations and extensively characterized their physicochemical properties and in vitro performance. From this library, we selected eight representative aNP-siRNA formulations and evaluated their ability to silence lysosomal-associated membrane protein 1 (Lamp1) expression in immune cell subsets in mice after intravenous administration. Using the most effective aNP identified from the screening process, we tested the platform's potential for therapeutic gene silencing in a syngeneic murine tumour model. We also demonstrated the aNP platform's suitability for splice-switching with antisense oligonucleotides and for protein production with messenger RNA by myeloid progenitor cells in the bone marrow. Our data indicate that the aNP platform holds translational potential for delivering various types of nucleic acid therapeutics to myeloid cells and their progenitors.


Conflict of interest statement

Competing interests: M.G.N. and W.J.M.M. are scientific co-founders of and have equity in Trained Therapeutix Discovery. W.J.M.M. is CSO of Trained Therapeutix Discovery. M.G.N. and W.J.M.M. are scientific co-founders of and have equity in BioTrip. S.R.J.H., T.A., R.Z., H.M.J., P.M.F., W.J.M.M., E.K., and R.v.d.M. are listed as inventors on patent application WO2022268913A1 related to this manuscript. The other authors declare no competing interests.

Figures

Fig. 1
Fig. 1. Prototyping aNP platform technology for siRNA delivery to the myeloid cell compartment.
a, Schematic representation of siRNA apolipoprotein nanoparticle (aNP-siRNA) platform technology. b, Prototype aNP composition (wt%). c, siRNA recovery, entrapment and retention (n = 12 formulation batches). d, Apolipoprotein A1 (apoA1) content (n = 11 formulation batches). e, Hydrodynamic diameter presented as the number mean average, and the associated dispersity (n = 12 formulation batches). f, Cryo-EM. g, Transmission electron microscopy and apoA1-immunogold staining (IGS). h, Firefly luciferase (Fluc) reporter gene silencing in RAW 264.7 cells stably expressing Fluc and Renilla luciferase of prototype aNP compared with LNPs containing Fluc siRNA (n = 3 formulation batches). i, Complexation of zirconium-89 (89Zr) to DFO-siRNA. j, aNP-89Zr-siRNA physicochemical analysis (n = 2 formulation batches). d.nm, diameter (nm). k, aNP-89Zr-siRNA cryo-EM analysis. l, Positron emission tomography–computed tomography (PET–CT) imaging of mice 24 h after intravenous administration of unformulated 89Zr-siRNA, LNP-89Zr-siRNA and aNP-89Zr-siRNA. m, Quantitative biodistribution of unformulated 89Zr-siRNA, LNP-89Zr-siRNA and aNP-89Zr-siRNA 24 h after intravenous administration in mice (8 µCi per mouse) as determined by ex vivo gamma counting. Radioactivity is expressed as the percentage injected dose per gram of tissue (%ID per gram). Data represent mean ± s.d. of one experiment, each data point represents one animal (n = 3, 5 or 6 mice). The data were analysed by one-way ANOVA with a Bonferroni post-hoc test. n, Functional gene silencing of lysosomal-associated membrane protein 1 (Lamp1) expression in liver Kupffer cells and endothelial cells, as well as splenic and bone marrow leukocytes and myeloid cells following intravenous administration (4 × 0.5 mg kg–1 in six days, readout 36 h after the last injection) of LNP or aNP containing siCtrl or siLAMP1, as determined by flow cytometry. Data represent mean ± s.d. of one experiment (n = 6 mice) and analysed by one-way ANOVA using a Bonferroni post-hoc test. *P ≤ 0.05, ***P ≤ 0.001, ****P ≤ 0.0001. Source data
Fig. 2
Fig. 2. Establishing and screening a library of aNP-siRNA with diverse compositions.
a, aNP-siRNA library design space. N, nitrogen; P, phosphate. b, Compositions, identifiers, and characteristics of the aNP-siRNA formulations in the library. Formulations in bold and indicated by an asterisk (*) were selected for in vivo evaluation. c, Morphology and size were determined by cryo-EM analysis (see Supplementary Fig. 2 for extended cryo-EM data). Scale bars, 50 nm. df, Heatmaps represent formulation quality as assessed by percentage lipid aggregation quantified in cryo-EM images (d), shelf-life by percentage change in dispersity determined by dynamic light scattering after 28 days (e), and functional Fluc reporter gene silencing in vitro determined by bioluminescence measurements in RAW 264.7 dual-luciferase reporter cells after 48 h (f). Source data
Fig. 3
Fig. 3. Screening aNP-siRNA functional gene silencing in vivo.
a, Ex vivo LAMP1 silencing in BMDMs via transfection with aNP-siLAMP1. The normalized, relative gene expression levels of Lamp1 RNA (ΔΔCq) were determined by RT-qPCR. The primers are listed in Supplementary Table 3. Data represent mean ± s.d. of one experiment (n = 3 donors). b, Schematic screening workflow involving mice receiving repeated intravenous administrations of aNP containing siCtrl or siLAMP1 (0.5 mg kg–1 per administration, cumulative dose of 2 mg kg–1). LAMP1 expression was determined six days after the first administration by flow cytometry. c, Schematic overview of haematopoietic stem cells, myeloid progenitor cells and mature myeloid cells. d, Flow cytometry gating strategy (refer to Supplementary Fig. 4 for an extended overview of the gating strategy). Antibodies used for flow cytometry studies are listed in Supplementary Tables 5–8. e,f, Relative LAMP1 levels indicated by normalized expression levels (%) in haematopoietic stem cells (e) and myeloid progenitors (f) in the bone marrow. Data represent mean ± s.d. of one experiment (n = 4–6 mice) and analysed by one-way ANOVA with a Bonferroni post-hoc test. Statistically significant differences between aNP-siLAMP1 versus aNP-siCtrl formulations are indicated by: *P ≤ 0.05, **P ≤ 0.01, ***P ≤ 0.001. g, Heatmap representing relative LAMP1 silencing of selected aNP-siLAMP1 versus aNP-siCtrl formulations in haematopoietic stem and progenitor cells. Colour indicates the measure of silencing and statistically significant differences (P ≤ 0.05) are indicated by a hash (#). The data were analysed by one-way ANOVA with a Bonferroni’s post-hoc test. Source data
Fig. 4
Fig. 4. In-depth analysis of lead siRNA-aNP physicochemical properties, in vivo behaviour and therapeutic application.
a, Lead aNP-siRNA (aNP18) composition (wt%). b, siRNA recovery, entrapment and retention, data represent mean ± s.d. of one experiment (n = 12 formulation batches). c, Apolipoprotein A1 (apoA1) content. Data represent mean ± s.d. of one experiment (n = 9 formulation batches). d, Hydrodynamic diameter represented as the number mean and dispersity. Data represent mean ± s.d. of one experiment (n = 12 formulation batches). e, Zeta potential. Data represent mean ± s.d. of one experiment (n = 6 formulation batches). f, Cryo-EM analysis of six individual aNP18-siRNA batches. g, Quantitative biodistribution of aNP18-89Zr-siRNA 15 min, 1 h, 4 h and 24 h after intravenous administration in mice (8 µCi per mouse) determined by ex vivo gamma counting. Radioactivity is expressed as %ID per gram. Data represent mean ± s.d. of one experiment, and each data point represents one animal (n = 3 mice). h, Schematic showing therapeutic effect of CCR2 silencing by inhibiting immunosuppressive monocyte migration to the tumour microenvironment. i, Schematic treatment regimen involving MC38-tumour-bearing mice (n = 5 mice per group) receiving repeated intravenous administrations of aNP18 containing scrambled siRNA (aNP18-siCtrl) or CCR2 siRNA (aNP18-siCCR2) (0.5 mg kg–1 per administration, cumulative dose of 3.5 mg kg–1). CCR2 expression was determined 14 days after the first administration by flow cytometry. jl, CCR2 levels indicated by mean fluorescence intensity (MFI) in ly6Clo monocytes in the bone marrow (j), spleen (k) and blood (l). Data represent mean ± s.d. of one experiment (n = 5 mice) and were analysed using Student's t-test. Statistically significant differences between aNP18-siCCR2 versus aNP18-siCtrl formulations are indicated by: **P ≤ 0.01, ***P ≤ 0.001. m, Number of CCR2+ macrophages per gram of tumour tissue as determined by flow cytometry. Data represent mean ± s.d. of one experiment (n = 5 mice) n, Fraction of CCR2+ macrophages within tumour tissue expressed as percentage (%) of myeloid cells. Data represent mean ± s.d. of one experiment (n = 5 mice) and analysed using Student's t-test. Statistically significant differences between aNP18-siCCR2 versus aNP18-siCtrl formulations are indicated by: **P ≤ 0.01. o, Biocompatibility of siRNA-aNP18-siCCR2 as determined by serum levels of alanine aminotransferase (ALAT, left), aspartate aminotransferase (ASAT, middle left), creatinine (middle right) and urea (right) two days following treatment (cumulative dose of 3.5 mg kg–1). Data represent mean ± s.d. of one experiment (n = 3 or 4 mice). LLOQ, lower limit of quantification. p, Representative liver sections stained with haematoxylin and eosin from mice treated with aNP18-siCtrl (left) and aNP18-siCCR2 (right). Source data
Fig. 5
Fig. 5. aNP formulations for ASO and messenger RNA delivery to immune cells.
a, aNP-ASO composition (wt%). b, Cryo-EM image. c, Schematic of NATURA reporter cells that alter the expression of eGFP to tRFP upon ASO-mediated splice-switching. d, Splice-switching in RAW 264.7 reporter cells in vitro. Data represent mean ± s.d. of two experiments with two formulation batches (n = 2). e, aNP-mRNA composition (wt%). f, Cryo-EM image. g, Hydrodynamic diameter represented as the number mean and dispersity. Data represent mean ± s.d. of one experiment with 14 formulation batches (n = 14). h, mRNA recovery, entrapment and retention data represent mean ± s.d. of one experiment (n = 14 formulation batches). i, Zeta potential data represent mean ± s.d. of one experiment with three individual formulations (n = 3 formulations). j,k, Schematic workflow of intravenously (i.v.) administering aNPs containing mCherry mRNA (aNP-mRNA-mCherry) (j) at a dose of 0.5 mg kg–1 mRNA to C57/BL6 mice and determining expression in bone marrow cells by flow cytometry analysis (k). l, mCherry expression in bone marrow myeloid progenitors indicated by geometric mean fluorescence intensity (gMFI, left panel) and percentage of mCherry+ cells (right panel) 12 h after intravenous administration with LNP and aNP containing mCherry mRNA. Data represent mean ± s.d. of one experiment (n = 3 mice) and analysed by student t-test. Statistically significant differences between LNP-mRNA versus aNP-mRNA formulations are indicated by: *P ≤ 0.1. Source data
Extended Data Fig. 1
Extended Data Fig. 1. aNP-siRNA formulation procedure.
Lipid molecules dissolved in ethanol are rapidly mixed via a T-junction with siRNA dissolved in sodium acetate buffer (25 mM, pH 4). The resulting intermediate product is then dialysed against PBS buffer (pH 7.4). Next, the intermediate product is rapidly mixed with apoA1 dissolved in PBS. The final product is filtered, concentrated, and analyzed.
Extended Data Fig. 2
Extended Data Fig. 2. Radio-thin layer chromatography (radio-TLC) of aNP-89Zr-siRNA.
a. MALDI spectra indicating conjugation of DFO to the siRNA sense strand b. Radio-TLC analysis of free 89Zr (top left) showing a peak at 15 mm. The peak shifts when 89Zr is chelated to DFO-siRNA to yield 89Zr-siRNA (top right). 89Zr-siRNA was used for formulation of the prototype aNP (bottom right) and a control LNP (bottom left).
Extended Data Fig. 3
Extended Data Fig. 3. Ex vivo LAMP1 silencing in bone marrow-derived macrophages.
a. Ex vivo screening of siLAMP1 constructs (Supplementary Table 4) using bone marrow-derived macrophages (BMDMs). Cells were transfected with siRNA formulated with Lipofectamine RNAiMAX at a concentration of 10 and 100 nM for 24 h. 72 h after transfections, cells were harvested and prepared for flow cytometry. LAMP1 mean fluorescence intensity was measured by flow cytometry. For further experiments, siLAMP1e was selected (dark orange bar). Data represents mean ± SD of one experiment (minimal of n = 2 biological replicates). b. Ex vivo LAMP1 silencing in BMDMs after transfection with aNP-siLAMP1. Cells were incubated for 24 h with aNP-siRNAs. 48 h after incubation, the cells were processed for RT-qPCR. Lamp1 expression levels were determined by RT-qPCR and the ΔΔCq-values are displayed. The primers are listed in Supplementary Table 3. Data represent mean ± SD of one experiment (n = 3 donors). c. Ex vivo Lamp1 silencing in bone marrow-derived macrophages aNP18 dose response. Lamp1 expression was determined 48 h after incubation with RT-qPCR and the ΔCq-expression normalized to siCtrl-aNP18 at an equivalent concentration. The % knockdown is calculated according to the following formula: %KD = (1 − ∆∆Cq) × 100. The absolute IC50 value is 1.9 nM. Source data
Extended Data Fig. 4
Extended Data Fig. 4. In vivo aNP-induced LAMP1 knockdown effect in bone marrow progenitor cells.
Relative LAMP1 expression levels measured by flow cytometry in various cell populations in the bone marrow including HSCs, LT-HSCs, MPPs, MyPs, CMPs & GMPs. The gating strategy utilized in this experiment is displayed in Supplementary Fig. 4a. The knockdown effect compared to a negative control formulation is displayed. Data represent mean ± SD of one experiment (n = 6 animals) and analyzed by one-way ANOVA with Bonferroni post-hoc test. Statistically significant differences between aNP-siLAMP1 versus aNP-siCtrl formulations are indicated by: * indicates statistical significance (p ≤ 0.05), ** indicates statistical significance (p ≤ 0.01). Source data
Extended Data Fig. 5
Extended Data Fig. 5. In vivo aNP-induced LAMP1 knockdown effect in bone marrow myeloid cells.
Relative LAMP1 expression levels measured by flow cytometry in various cell populations in the bone marrow among which leukocytes, myeloid cells, dendritic cells, macrophages, monocytes, monocytes Ly6C high, neutrophils & monocytes Ly6C low. The gating strategy is displayed in Supplementary Fig. 4b. Data represent mean ± SD of one experiment (n = 6 animals) and analyzed by one-way ANOVA with Bonferroni post-hoc test. Statistically significant differences between aNP-siLAMP1 versus aNP-siCtrl formulations are indicated by: * indicates statistical significance (p ≤ 0.05), ** indicates statistical significance (p ≤ 0.01), *** indicates statistical significance (p ≤ 0.001), **** indicates statistical significance (p ≤ 0.0001). Source data
Extended Data Fig. 6
Extended Data Fig. 6. In vivo aNP-induced LAMP1 knockdown effect in splenic myeloid cells.
Relative LAMP1 expression levels measured by flow cytometry in various cell populations in the bone marrow among which leukocytes, myeloid cells, dendritic cells, macrophages, monocytes, monocytes Ly6C high, neutrophils & monocytes Ly6C low. The gating strategy is displayed in Supplementary Fig. 4b. Data represent mean ± SD of one experiment (n = 6 animals) and analyzed by one-way ANOVA with Bonferroni post-hoc test. Statistically significant differences between aNP-siLAMP1 versus aNP-siCtrl formulations are indicated by: * indicates statistical significance (p ≤ 0.05), ** indicates statistical significance (p ≤ 0.01), *** indicates statistical significance (p ≤ 0.001), **** indicates statistical significance (p ≤ 0.0001). Source data
Extended Data Fig. 7
Extended Data Fig. 7. aNP biodistribution and tolerability following single i.v. injection.
a. Quantitative biodistribution of aNP18-89Zr-siRNA 24 h following intravenous administration in mice (8 µCi/mouse) determined by gamma counting. Radioactivity is expressed as the percentage injected dose per gram of tissue (%ID/g). Data represent mean ± SD of one experiment, each data point represents one animal (n = 9 mice). b. Biocompatibility of siRNA-aNP18 as determined by serum levels of alanine aminotransferase (ALAT), aspartate aminotransferase (ASAT), creatinine, and urea one day (top) and 3 days (bottom) after intravenous administration (0.5 mg/kg) (n = 1-4 mice). Data represent mean ± SD of one experiment (n = 1-4 mice). c. Cytokine levels were determined by ELISA 4 h after intravenous administration of siRNA-aNP18 and intraperitoneal administration of LPS (0.5 mg/kg). Data represent mean ± SD of one experiment (n = 3-4 mice) and analyzed by one-way ANOVA with Bonferroni post-hoc test. Source data
Extended Data Fig. 8
Extended Data Fig. 8. Ex vivo CCR2 silencing and in vivo biological effects in aNP-treated MC38 tumour-bearing mice.
a. Screening of siCCR2 constructs (Supplementary Table 4) using bone marrow-derived macrophages. Transfection was performed with aNP18-siCCR2 or aNP18-siCtrl, at concentrations 1, 10, and 100 nM siRNA, respectively. Expression levels of Ccr2 were determined by RT-qPCR and the ΔΔCq-values are displayed. The primers are listed in Supplementary Table 3. Data represents mean ± SD of one experiment (minimal of n = 2 biological replicates). b. Number of myeloid cells per gram of tumour tissue as determined by flow cytometry. Data represent mean ± SD of one biological replicate (n = 4-5 mice) and analyzed by student’s t-test c. Fraction of CCR2-positive myeloid cells within tumour tissue expressed as percentage (%) of myeloid cells. Data represent mean ± SD of one experiment (n = 4-5 mice) and analyzed by student’s t-test. Statistically significant differences between aNP18-siCtrl versus aNP18-siCCR2 formulations are indicated by: ** indicates statistical significance (p = 0.0084). d. Individual tumour volumes of MC38 tumour-bearing mice (n = 5 per group) receiving repeated intravenous administrations of aNP18 containing scrambled siRNA (aNP18-siCtrl) or CCR2 siRNA (aNP18-siCCR2) (0.5 mg/kg per administration, cumulative dose 3.5 mg/kg). e. Individual mouse body weights (n = 5 mice). Source data
Extended Data Fig. 9
Extended Data Fig. 9. aNP-siRNA and aNP-mRNA shelf-life.
a. aNP18-siLAMP1’s RNA entrapment (left), hydrodynamic diameter presented as the number mean (middle), and associated dispersity (right) over a period of 8 weeks while stored at 4 °C. Data represents mean ± SD of one experiment with 3 formulation batches (n = 3 formulation batches). b. aNP-mRNA’s RNA entrapment (left), hydrodynamic diameter presented as the number mean (middle), and associated dispersity (right) over a period of 8 weeks while stored at 4 °C. Data represents mean ± SD of one experiment with 3 formulation batches (n = 3 formulation batches). Source data
Extended Data Fig. 10
Extended Data Fig. 10. aNP-ASO physicochemical properties and aNP-mRNA in vitro eGFP expression.
a. Schematic of the NATURA reporter system. NATURA reporter cells express eGFP, and switch to tRFP after ASO-induced splice-switching. aNP-ASO’s physicochemical characterization: b. Hydrodynamic diameter presented as number mean and associated dispersity, data represent mean ± SD of one experiment (n = 6 formulation batches). c. ASO recovery, entrapment and retention, data represent mean ± SD of one experiment (n = 6 formulation batches). In vitro transfection of RAW 264.7 macrophages with aNP-mRNA-encoding eGFP. d. eGFP MFI as characterized by flow cytometry. Data represent mean ± SD of 4 experiments with 4 individual batches of aNPs(n = 4). e. Percentage (%) eGFP positive cells as characterized by flow cytometry. Data represent mean ± SD of 4 experiments with 4 individual batches of aNPs (n = 4). Source data

References

    1. Kulkarni, J. A. et al. The current landscape of nucleic acid therapeutics. Nat. Nanotechnol.16, 630–643 (2021). - PubMed
    1. Akinc, A. et al. The Onpattro story and the clinical translation of nanomedicines containing nucleic acid-based drugs. Nat. Nanotechnol.14, 1084–1087 (2019). - PubMed
    1. Adams, D. et al. Patisiran, an RNAi therapeutic, for hereditary transthyretin amyloidosis. N. Engl. J. Med.379, 11–21 (2018). - PubMed
    1. Polack, F. P. et al. Safety and efficacy of the BNT162b2 mRNA Covid-19 vaccine. N. Engl. J. Med.383, 2603–2615 (2020). - PMC - PubMed
    1. Baden, L. R. et al. Efficacy and safety of the mRNA-1273 SARS-CoV-2 vaccine. N. Engl. J. Med.384, 403–416 (2021). - PMC - PubMed

MeSH terms

Substances

LinkOut - more resources