. 2025 Feb 3;16(1):1280.
doi: 10.1038/s41467-025-56624-0.

An abundant ginger compound furanodienone alleviates gut inflammation via the xenobiotic nuclear receptor PXR in mice

Affiliations

An abundant ginger compound furanodienone alleviates gut inflammation via the xenobiotic nuclear receptor PXR in mice

Xiaojuan Wang et al. Nat Commun. .

Erratum in

Abstract

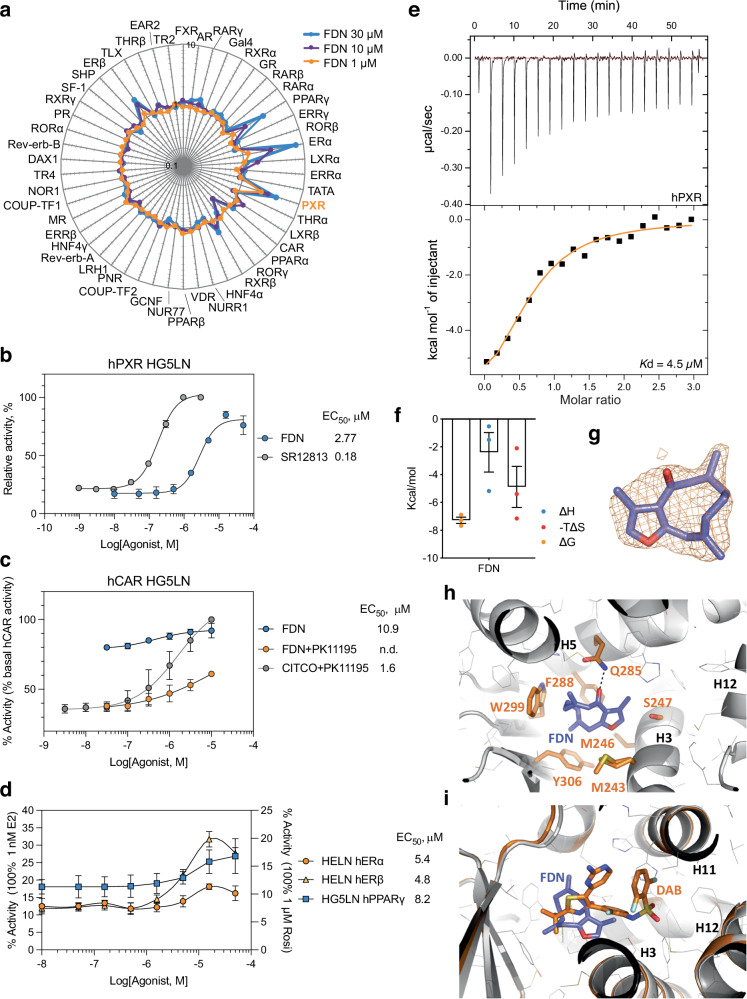
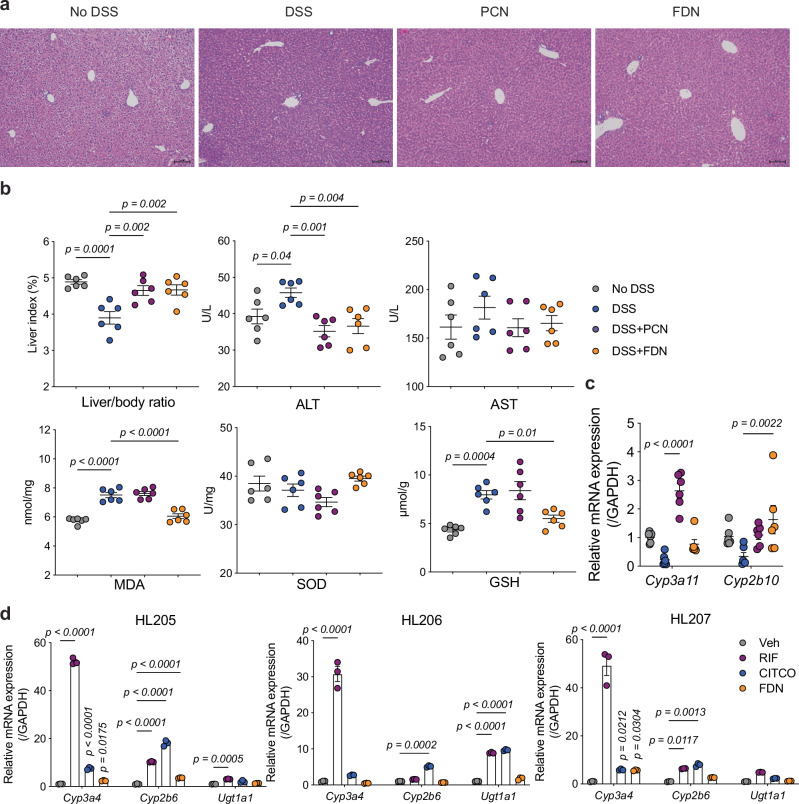
The literature documenting the value of drug-like molecules found in natural products is vast. Although many dietary and herbal remedies have been found to be effective for treating intestinal inflammation, the identification of their active components has lagged behind. In this study, we find that a major ginger component, furanodienone (FDN), is a selective pregnane X receptor (PXR) ligand with agonistic transcriptional outcomes. We show that FDN binds within a sub-pocket of the PXR ligand binding domain (LBD), with subsequent alterations in LBD structure. Using male mice, we show that orally provided FDN has potent PXR-dependant anti-inflammatory outcomes that are colon-specific. Increased affinity and target gene activation in the presence of synergistically acting agonists indicates further opportunities for augmenting FDN activity, efficacy and safety. Collectively, these results support the translational potential of FDN as a therapeutic agent for the treatment and prevention of colonic diseases.


Conflict of interest statement

Competing interests: The authors declare no competing interests.

Figures

Fig. 1
Fig. 1. Identification of ginger secondary metabolites as human nuclear receptor ligands.
a, b Relative abundance of NR expression in GTEx colon-sigmoid (n = 373) and colon-transverse (n = 406) specimens obtained from the GTEx Portal. The center line of the boxplot indicates the median value. Whiskers are drawn to 10% and 90% values with points below and above indicated as individual points. cf Volcano plots showing the distribution of mass features differentially enriched by PXR, CAR, RXRβ, and RXRγ from ginger in comparison to vehicle (DMSO). p-values were determined by a two-tailed unpaired Student’s t-test. Dashed lines represent significance cut-offs (p-value ≤ 0.05, fold change ≥ 1000). Masses of enriched metabolites are highlighted. g Mass features identified in (cf) are selectively enriched by the corresponding receptors. Pulldowns were performed in triplicate in at least three independent experiments, and data are expressed as mean ± SD. h Structure of FDN. E labels indicate double bond geometry. TPM transcript per million, FDN furanodienone. Source data are provided in the Source Data file.
Fig. 2
Fig. 2. Effects of FDN on human NR transcriptional activity and PXR structure.
a Trans-FACTORIAL assay showing the effect of FDN at different concentrations on the transcriptional activities of all 48 human NRs in HepG2 cells. Rings with different diameters indicate “1” no effect; “10,” a 10-fold increase; and “0.1,” a 10-fold decrease. Each profile is an average of three independent Trans-FACTORIAL NR assays. Rifampicin was used as a positive PXR control (Supplementary Fig. 3). b Transcriptional responses of PXR in GAL4-hPXR-LBD-transfected HG5LN cells exposed to different concentrations of FDN and SR12813 (n = 3). c HG5LN cells expressing GAL4-hCAR-LBD were treated with increasing amounts of FDN or CITCO in the presence of inverse agonist, PK11195 (agonism mode), or FDN in the absence of PK11195 (antagonism mode) (n = 3). d HELN-hERα, HELN-hERβ, and HG5LN-PPARγ cells were exposed to different concentrations of FDN (n = 3). Data are mean ± SD. e Isothermal titration calorimetry (ITC) characterization of PXR LBD interaction with FDN. Representative thermograms of heat are shown in the upper panel and corresponding binding isotherms are in the lower panel. The Kd value is the mean of two independent experiments. f Respective thermodynamic signatures of binding of FDN to the PXR LBD (n = 3 replicates) and represent the mean ± SD. g FDN placed in its 2Fo-Fc electron density map. Carbon atoms discussed in the text are labeled. h Close-up view of the ligand-binding pocket of PXR bound to FDN. Key PXR residues in contact with the compound (cut-off 4.2 Å) are depicted as orange sticks. Other residues are displayed as lines. Residues and secondary structural elements discussed in the text are labeled. The dashed line depicts a hydrogen bond. i Superposition of FDN- and dabrafenib (DAB)-bound PXR (orange, PDB code 6HJ2) structures. FDN furanodienone. Source data are provided in the Source Data file.
Fig. 3
Fig. 3. FDN alleviates DSS-induced colitis.
Colitis was induced by administration of 2.8% DSS in water (w/v) in C57BL/6 (6–8-week age old, n  =  6/group). Mice were pre-treated for 3 days prior to DSS treatment with either vehicle, PCN (10 mg/kg), or FDN (10 mg/kg), and then exposed to DSS for an additional 7 days. Representative data from one of two independent experiments are shown. a Disease activity index. b Body weight changes during DSS. Data were analyzed by one-way ANOVA and are expressed as mean ± SEM. p-values were determined by comparing them to the DSS group. c Images of colons. d Colon length. e Microphotographs of H&E stained sections of colons. Scale bar: 100 μm. n = 3 biological samples per group, the representative example shown. f Histological score. a, b, d, f Data were analyzed by one-way ANOVA with multiple comparisons and are expressed as mean ± SD. p-values are in comparison to the DSS group. FDN furanodienone, PCN pregnenolone-16a carbonitrile, DSS dextran sodium sulfate. Source data are provided in the Source Data file.
Fig. 4
Fig. 4. Mechanisms of FDN-mediated colon protection.
a, b Colonic mRNA expression of cyp3a11 (n = 5 for No DSS, n = 3 for DSS, n = 4 for DSS + PCN, n = 4 for DSS + FDN), mdr1a (n = 6 for No DSS, n = 6 for DSS, n = 4 for DSS + PCN, n = 5 for DSS + FDN), and cyp2b10 (n = 4 for No DSS, n = 5 for DSS, n = 5 for DSS + PCN, n = 3 for DSS + FDN) (a), and gsta (n = 6 except n = 5 for No DSS), and gstm (n = 6) (b) mRNA expression levels in wild-type mice. c Protein expression levels of p-p65, p65, p-IκBα, and IκBα in the colon measured by immunoblotting. α-Tubulin was used as the loading control. Experiments were performed in triplicate and repeated twice with similar results. d Colonic IL-6 (n = 6 mice), IL-1β (n = 6 mice except n = 5 for DSS and DSS + FDN), and TNF-α (n = 6 mice) levels. e Representative immunofluorescence images of Occludin (green) and ZO-1 (red) distributions in colon sections. n = 3 biological samples per group, the representative example shown. f Relative fluorescent intensity of Occludin and ZO-1 (n = 3 mice). a, b Data were analyzed by two-way ANOVA with multiple comparisons and are expressed as mean ± SD. d, f Data were analyzed by one-way ANOVA with multiple comparisons and are expressed as mean ± SD. p-values are in comparison to the DSS group. FDN furanodienone, PCN pregnenolone-16a carbonitrile, DSS dextran sodium sulfate. Source data are provided in the Source Data file.
Fig. 5
Fig. 5. FDN beneficial activities are PXR-dependent.
ad Colitis induced using DSS in wild-type C57BL/6 (6–8-week age old, n = 6 mice/group), and Nr1i2/ (6–8-week age old, n = 6 mice/group) mice. Mice were pre-treated for 3 days by intragastric administration with either vehicle, FDN (10 mg/kg), or PCN (10 mg/kg) and then for another 7 days during DSS treatment. a, c Percentage body weight loss. b, d Disease activity index. e, f Representative colon images. g Colon lengths. h Microphotographs of H&E stained sections. Scale bar indicates 100 μm. n = 3 mice per group, a representative example is shown. ik colonic IL-6, IL-1β and TNF-α levels (n = 6 mice). ad Data were analyzed by one-way ANOVA and are expressed as mean ± SEM. g, ik Data were analyzed by two-way ANOVA with multiple comparisons and are expressed as mean ± SD. p-values were determined by comparison to the DSS group. FDN furanodienone, PCN pregnenolone-16a carbonitrile, DSS dextran sodium sulfate. Source data are provided in the Source Data file.
Fig. 6
Fig. 6. FDN effects are intestine-specific.
a H&E staining of the liver from acute UC mice. Scale bar = 100 μm. n = 3 mice, biological samples per group, a representative example is shown. b Liver-to-body weight ratios (liver index) in treated mice. Serum levels of alanine transaminase (ALT), aspartate aminotransferase (AST), malondialdehyde (MDA), superoxide dismutase (SOD), and glutathione (GSH) were measured (n = 6 mice). c RT-qPCR analysis of PXR target gene expression cyp3a11 and cyp2b10 levels in liver (n = 6 mice). d RT-qPCR analysis of cyp3a4, cyp2b6, and ugt1a1 mRNA expression in PHH (from three donors) treated for 48 h with vehicle (Veh, 0.1% DMSO) or indicated concentrations of ligands (RIF and FDN at 10 μM; CITCO at 3 μM). Results were obtained from experiments performed in triplicate. b Data are shown as means ± SD, one-way ANOVA test, p-values compared to the DSS group. c, d Data were analyzed by two-way ANOVA with multiple comparisons and are expressed as mean ± SD. p-values compared to the DSS group (c) or the Veh (DMSO) group (d). RIF, rifampicin is a human PXR agonist. CITCO is a human CAR agonist. Veh vehicle, FDN furanodienone, PCN pregnenolone-16a carbonitrile, DSS dextran sodium sulfate. Source data are provided in the Source Data file.
Fig. 7
Fig. 7. Synergistic actions of FDN and steroids.
a Superposition of the structures of FDN-bound PXR and PXR bound to E2 and END (orange, PDB code 7AXK). b FDN docking pose obtained in the presence of E2. The docking pose (in gray) matches the PXR: FDN crystallographic structure (in violet, RMSD = 1.67 Å), and correctly reproduces the H-bond with residue Q285. c FDN docking pose obtained in the presence of EE2. The docking pose (in gray) matches the crystallographic structure (in violet, RMSD = 1.52 Å), and correctly reproduces the H-bond with residue Q285. d Crystal structure overlaying differential HDX indicates alternations in the structural conformation of PXR-SRC1 due to SR12813, FDN, FDN/E2, or FDN/EE2 (PDB ID: 3HVL) binding. Structures are color-coded according to the color bar at the bottom of the figure where colors represent differences in deuterium uptake (%D). Regions highlighted in black are areas not covered in HDX analysis. e Fractional uptake difference heatmaps showing variations of deuterium uptake between ligand-bound PXR-SRC1. f, g HG5LN GAL4-PXR-LBD cells were exposed to different concentrations of FDN in combination with E2 or EE2 (n = 4). Dashed lines represent the theoretical activation curves obtained for the additive combination of individual compound activities calculated using the Bliss independence model. Assays were performed in at least three independent experiments, and data are expressed as mean ± SEM. h RT-qPCR analysis of Mdr1, Cyp3a4, and Cyp1a1 mRNA expression in hPXR-overexpressing LS174T cells treated for 48 h with solvent (0.1% DMSO) or the indicated ligands (RIF and FDN at 10 μM; E2 and EE2 at 3 μM). Results were obtained from three separate experiments performed in triplicate. ik RT-qPCR analysis of Cyp3a4, Ugt1a1, and Mdr1 mRNA expression in human ileum organoids treated for 24 h with solvent (0.1% DMSO) or the indicated ligands (RIF and FDN at 10 μM; EE2 at 3 μM). Results were obtained from three separate experiments performed in quadruplicate. hk Data were analyzed by two-way ANOVA with multiple comparisons and are expressed as mean ± SD. E2 17β-estradiol, EE2 17α-ethinylestradiol, END endosulfan, FDN furanodienone, PCN pregnenolone-16a carbonitrile, RIF rifampicin. Source data are provided in the Source Data file.

References

    1. Wang, R., Li, Z., Liu, S. & Zhang, D. Global, regional and national burden of inflammatory bowel disease in 204 countries and territories from 1990 to 2019: a systematic analysis based on the Global Burden of Disease Study 2019. BMJ Open13, e065186 (2023). - PMC - PubMed
    1. Kaplan, G. G. & Windsor, J. W. The four epidemiological stages in the global evolution of inflammatory bowel disease. Nat. Rev. Gastroenterol. Hepatol.18, 56–66 (2021). - PMC - PubMed
    1. Kuenzig, M. E. et al. Twenty-first century trends in the global epidemiology of pediatric-onset inflammatory bowel disease: systematic review. Gastroenterology162, 1147–1159.e1144 (2022). - PubMed
    1. Collaborators, G. B. D. I. B. D. The global, regional, and national burden of inflammatory bowel disease in 195 countries and territories, 1990–2017: a systematic analysis for the Global Burden of Disease Study 2017. Lancet Gastroenterol. Hepatol.5, 17–30 (2020). - PMC - PubMed
    1. Burisch, J. et al. The cost of inflammatory bowel disease in high-income settings: a Lancet Gastroenterology & Hepatology Commission. Lancet Gastroenterol. Hepatol.8, 458–492 (2023). - PubMed

LinkOut - more resources