. 2025 Jul;30(7):2994-3007.
doi: 10.1038/s41380-025-02905-5. Epub 2025 Feb 3.

Maternal immune activation imprints translational dysregulation and differential MAP2 phosphorylation in descendant neural stem cells

Affiliations

Maternal immune activation imprints translational dysregulation and differential MAP2 phosphorylation in descendant neural stem cells

Sandra M Martín-Guerrero et al. Mol Psychiatry. 2025 Jul.

Abstract

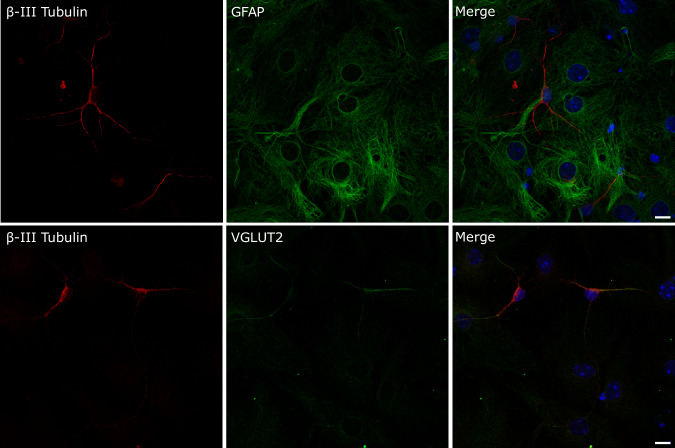
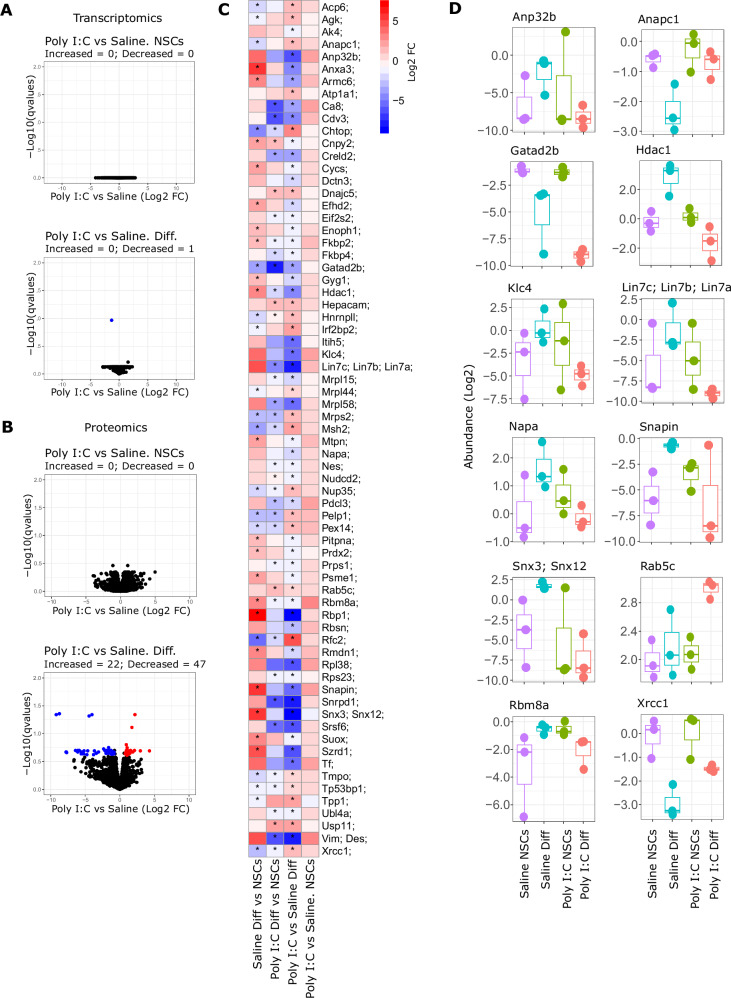
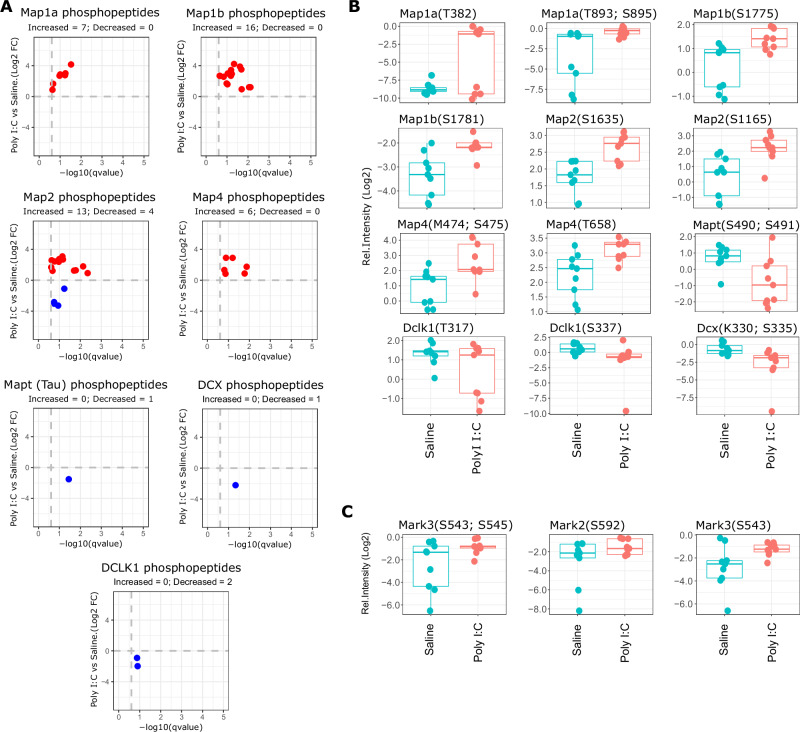
Alterations induced by maternal immune activation (MIA) during gestation impact the subsequent neurodevelopment of progeny, a process that in humans, has been linked to the development of several neuropsychiatric conditions. To undertake a comprehensive examination of the molecular mechanisms governing MIA, we have devised an in vitro model based on neural stem cells (NSCs) sourced from fetuses carried by animals subjected to Poly I:C treatment. These neural progenitors demonstrate proliferative capacity and can be effectively differentiated into both neurons and glial cells. Transcriptomic, proteomic, and phosphoproteomic analyses conducted on these cellular models, in conjunction with counterparts from control treatments, revealed discernible shifts in the expression levels of a specific subset of proteins implicated in neuronal function. Furthermore, the phosphoproteomic data highlighted a discernible discrepancy in the basal phosphorylation of proteins between differentiated cells from both experimental groups, particularly within proteins associated with cytoskeletal architecture and synaptic functionality, notably those belonging to the MAP family. Observed alterations in MAP phosphorylation were found to potentially have functional consequences as they correlate with changes in neuronal plasticity and the establishment of neuronal synapses. Our data agrees with previous published observations and further underscore the importance of MAP2 phosphorylation state on its function and the impact that this protein has in neuronal structure and function.


Conflict of interest statement

Competing interests: PRC is cofounder and director of Kinomica Ltd. All other authors declare no competing interests.

Figures

Fig. 1
Fig. 1. Representative images of NSCs cell lines after 5 days of differentiation into distinct neural lineages, specifically neurons and glia.
Immunocytochemistry experiments were conducted to identify neuronal and glial specific markers such as ß-III Tubulin and GFAP respectively. VGLUT2 staining was performed to detect glutamatergic neurons. Scale bar: 10 µm.
Fig. 2
Fig. 2. Transcriptomics and proteomics analysis of Saline and Poly I:C NSCs after differentiation process.
A, B Volcano plots showing transcriptomics (A) and proteomics (B) data from Saline and Poly I:C after differentiation of NSCs. X-axis shows relative change expressed as Log2 Fold Change (FC) of differentiated cells versus NSCs in each cell type. Y-axis show statistical significance expressed as -Log10 qvalues (FDR). Red and blue dots correspond to genes or proteins that changed significantly respect to NSCs cells (qvalues < 0.25 & pval < 0.05 and Log2 FC < −0.8 or Log2 FC > 0.8, respectively); black dots represent genes or proteins that did not match with the filtering criteria (FDR > 0.25 & pval > 0.05, Log2 FC > −0.8 or Log2 FC < 0.8). C, D Gene Ontology (GO) analysis for Biological Processes performed on the significant genes (C) and proteins (D) from the volcano plots in A and B. Plots show the top 5 most significant terms in each comparison and cell line. Decreased and increased indicates GO terms which genes or protein were found with significant decreased or increased levels (blue and red dots in volcano plots). The size of the dots represents the number of genes or proteins identified for each term, while the gradient colour scale represents the level of significance, indicated as -Log10 qvalue. E, F Dot plots showing the relative levels of genes (RNA levels, E) and proteins (F) of neural stem cell markers (NSCs) and differentiation markers in Saline and Poly I:C differentiated cells compared to NSCs. The size of the dots indicated the level of significance for each comparison, indicated as -Log10 qvalues (FDR). The colour of the dots indicates the relative change expressed as Log2 FC of differentiated cells versus NSCs.
Fig. 3
Fig. 3. Transcriptomics and proteomics analysis comparing Poly I:C and Saline cell lines before and after differentiation of NSCs.
A, B Volcano plots showing transcriptomics (A) and proteomics (B) data from NSCs and differentiated cells. X-axis shows relative change expressed as Log2 Fold Change (FC) of Poly I:C versus Saline NSCs or differentiated cells. Y-axis show statistical significance expressed as -Log10 qvalues (FDR). Red and blue dots correspond to genes or proteins that changed significantly respect to Saline group (qvalues < 0.25 & pval < 0.05 and Log2 FC < −0.8 or Log2 FC > 0.8, respectively); black dots represent genes or proteins that did not match with the filtering criteria (FDR > 0.25 & pval > 0.05, Log2 FC > −0.8 or Log2 FC < 0.8). C Heatmap showing the significant proteins from the bottom volcano in B. The scale colour indicated the relative change expressed as Log2 FC in each comparison indicated. The asterisks indicate the level of significance for each protein in the comparison indicated (FDR < 0.25 & pval < 0.05). D Box plots showing the relative abundance (in Log2 scale) of some proteins represented in the heatmap from B.
Fig. 4
Fig. 4. Phosphoproteomics analysis of differentiated Poly I:C and Saline NSCs.
A Volcano plot showing identified phosphopeptides when comparing differentiated Poly I:C versus Saline cells. X-axis shows relative change expressed as Log2 Fold Change (FC) of Poly (I:C) versus Saline differentiated cells. Y-axis show statistical significance expressed as -Log10 qvalues (FDR). Red and blue dots correspond to phosphopeptides that changed significantly respect to Saline group (qvalues < 0.25 & pval < 0.05 and Log2 FC < −0.8 or Log2 FC > 0.8, respectively), while black dots represent phosphopeptides that did not match with the filtering criteria (FDR > 0.25 & pval > 0.05, Log2 FC > − 0.8 or Log2 FC < 0.8). B, C Gene Ontology (GO) analysis for Biological Processes (B) and Cellular Component (C) performed on the significant phosphopeptides identified in A. Plots show the top 5 most significant terms. Decreased and increased indicates GO terms which phosphopeptides were found with significant decreased or increased phosphorylation levels (blue and red dots in volcano plots). The size of the dots represents the number of proteins identified for each term, while the gradient colour scale represents the level of significance, indicated as -Log10 qvalue. D Inverted volcano plots that show the phosphopeptides associated to the previous GO terms. X-axis indicates the statistical significance expressed as -Log10 of qvalues (FDR), and Y-axis represent the relative change expressed as Log2 FC of differentiated Poly I:C versus Saline cells. Red and blue dots indicate phosphopeptides with increased and decreased phosphorylation, respectively. E Box plots showing some of the phospheptides identified in panel D. Y-axis show the relative intensity of the phosphopeptides in Log2 scale.
Fig. 5
Fig. 5. Phosphoproteomics analysis of MAPs family members.
A Inverted volcano plots that show the phosphopeptides identified for members of MAPs family (Map1a, Map1b, Map2, Map4, Tau, Dcx and Dclk1). X-axis indicates the statistical significance expressed as -Log10 of qvalues (FDR), and Y-axis represent the relative change expressed as Log2 FC of differentiated Poly I:C versus Saline. Red and blue dots indicate phosphopeptides with increased and decreased phosphorylation, respectively. B Box plots showing some of the phosphopeptides identified in panel A. Y-axis show the relative intensity of the phosphopeptides in Log2 scale. C Box plots showing the significant phosphopeptides identified for the kinases Mark3 and Mark2. Y-axis show the relative intensity of the phosphopeptides in Log2 scale.
Fig. 6
Fig. 6. Analysis of MAP2 protein levels, dendritic arborization, neuritogenesis and synaptogenesis in neurons from Saline and Poly I:C groups.
A Box plots showing Map2 protein levels identified by LC-MS/MS in each of the groups analysed. Y-axis show the abundance of protein levels in Log2 scale. The dot plot at the right of the box plot indicates the relative change expressed as Log2 FC in each of the comparisons. The colour scale indicates the degree of change, increased or decreased; and the size of the dots represent the statistical significance of each comparison expressed as -Log10 qvalues (FDR). B Immunocytochemistry representative images of differentiated Poly I:C and Saline NSCs for MAP2 (red) and nuclear staining with Hoechst 33342 (blue). Scale bar = 10 μm. C Representative western blots for MAP2 in Saline and Poly I:C NSCs and differentiated cells. Actin was used as loading control. D Box plot showing Sholl analysis for Saline and Poly I:C neurons. Each dot represents the maximum number of intersections per neuron in each condition. N  =  24–30 neurons from 3 independent experiments. Error bars are SEM. E Neuritogenesis were evaluated by counting the number of dendritic filopodia/neurites in 20 µm segments of neurons from Saline and Poly I:C groups. Representative images from 20 µm segments from Saline and Poly I:C groups. Scale bar: 5 µm. Box plot shows filopodia/neurite densities calculated as filopodia-neurites/µm. N  =  20–26 neurons from three independent experiments; error bars are SEM. F Box plots showing the mean of synaptogenesis analysis in neurons from Saline and Poly I:C groups. Y-axis represent the percentage of red cells (mCherry positive) compared to the percentage of simultaneous red and green cells (mCherry and EGFP positive cells). N = 3 independent experiment. Each dot represents the average of 9000–13,000 cells analysed per experiment. In DF, statistical differences were evaluated using unpaired T-Test. *p ≤ 0.05, ns not significant.

Update of

References

    1. Estes ML, McAllister AK. Maternal immune activation: implications for neuropsychiatric disorders. Science. 2016;353:772–7. - PMC - PubMed
    1. Meyer U. Prenatal poly(i:C) exposure and other developmental immune activation models in rodent systems. Biol Psychiatry. 2014;75:307–15. - PubMed
    1. Meyer U, Feldon J. To poly(I:C) or not to poly(I:C): advancing preclinical schizophrenia research through the use of prenatal immune activation models. Neuropharmacology. 2012;62:1308–21. - PubMed
    1. Haddad FL, Patel SV, Schmid S. Maternal immune activation by Poly I:C as a preclinical model for neurodevelopmental disorders: a focus on autism and schizophrenia. Neurosci Biobehav Rev. 2020;113:546–67. - PubMed
    1. Reisinger S, Khan D, Kong E, Berger A, Pollak A, Pollak DD. The poly(I:C)-induced maternal immune activation model in preclinical neuropsychiatric drug discovery. Pharmacol Ther. 2015;149:213–26. - PubMed

LinkOut - more resources