

Warming alters plankton body-size distributions in a large field experiment
- PMID: 39900706
- PMCID: PMC11790927
- DOI: 10.1038/s42003-024-07380-2
Warming alters plankton body-size distributions in a large field experiment
Abstract
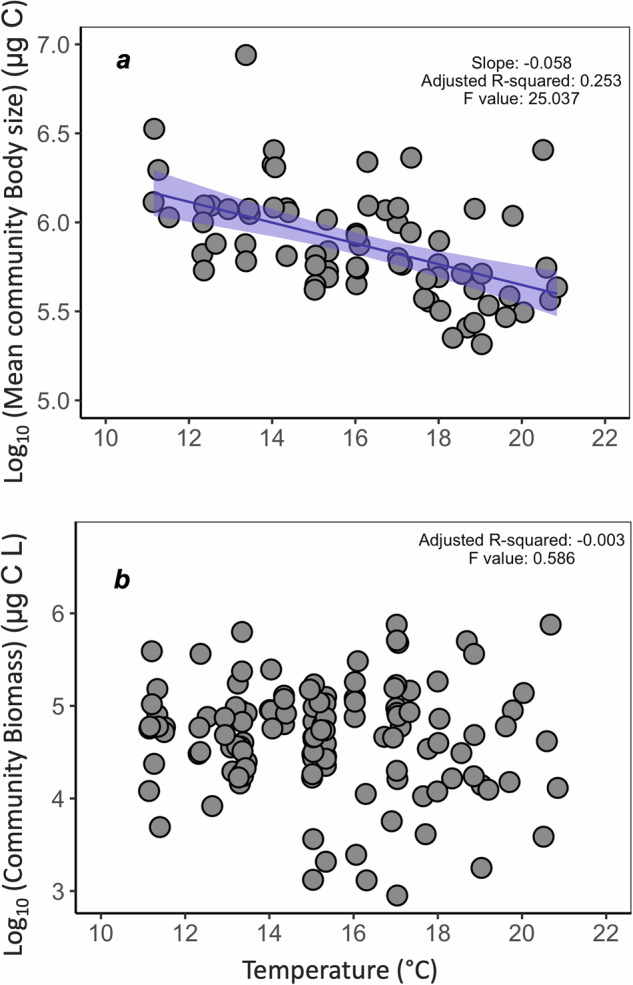
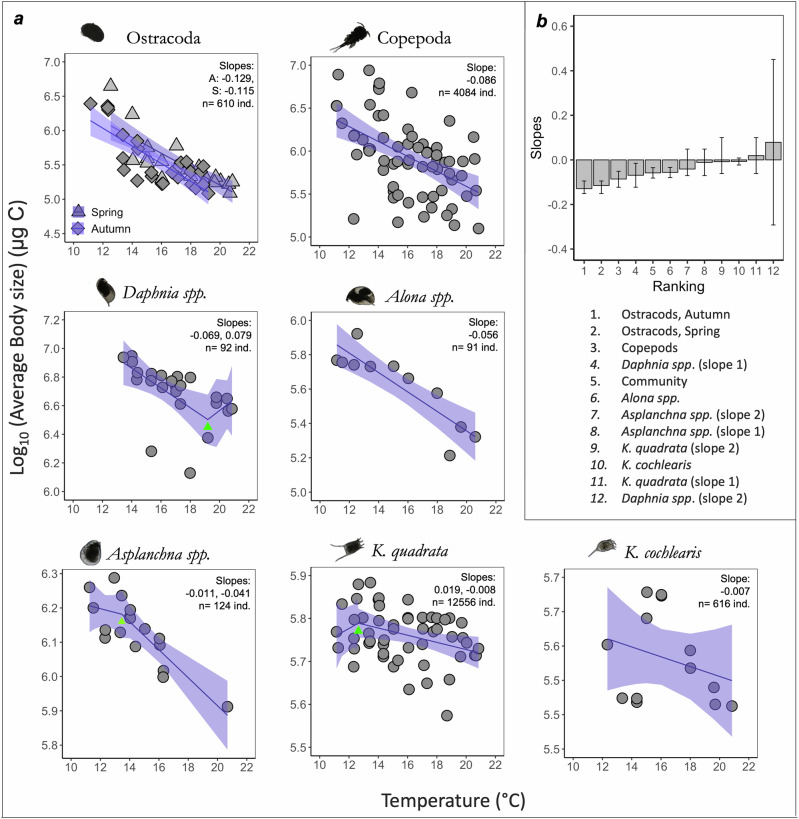
The threat of climate change has renewed interest in the responses of communities and ecosystems to warming, with changes in size spectra expected to signify fundamental shifts in the structure and dynamics of these multispecies systems. While substantial empirical evidence has accumulated in recent years on such changes, we still lack general insights due to a limited coverage of warming scenarios that span spatial and temporal scales of relevance to natural systems. We addressed this gap by conducting an extensive freshwater mesocosm experiment across 36 large field mesocosms exposed to intergenerational warming treatments of up to +8 °C above ambient levels. We found a nonlinear decrease in the overall mean body size of zooplankton with warming, with a 57% reduction at +8 °C. This pattern was broadly consistent over two tested seasons and major taxonomic groups. We also detected some breakpoints in the community-level size-temperature relationship, indicating that the system's response shifts noticeably above a certain level of warming. These results underscore the need to capture intergenerational responses to large gradients in warming at appropriate scales in time and space in order to better understand the effects of warming on natural communities and ecosystems.
© 2025. The Author(s).
Conflict of interest statement
Competing interests: Eoin J. O’Gorman is an Editorial Board Member for Communications Biology, but was not involved in the editorial review of, nor the decision to publish this article.
Figures
Similar articles
-
Fish-mediated plankton responses to increased temperature in subtropical aquatic mesocosm ecosystems: Implications for lake management.Water Res. 2018 Nov 1;144:304-311. doi: 10.1016/j.watres.2018.07.055. Epub 2018 Jul 23. Water Res. 2018. PMID: 30071399
-
Warming and trophic structure tightly control phytoplankton bloom amplitude, composition and succession.PLoS One. 2024 Oct 4;19(10):e0308505. doi: 10.1371/journal.pone.0308505. eCollection 2024. PLoS One. 2024. PMID: 39365779 Free PMC article.
-
Climate change affects low trophic level marine consumers: warming decreases copepod size and abundance.Oecologia. 2015 Mar;177(3):849-860. doi: 10.1007/s00442-014-3130-4. Epub 2014 Nov 21. Oecologia. 2015. PMID: 25413864
-
Smaller species but larger stages: Warming effects on inter- and intraspecific community size structure.Ecology. 2022 Jul;103(7):e3699. doi: 10.1002/ecy.3699. Epub 2022 May 23. Ecology. 2022. PMID: 35352827 Free PMC article. Review.
-
Long-term oceanographic and ecological research in the Western English Channel.Adv Mar Biol. 2005;47:1-105. doi: 10.1016/S0065-2881(04)47001-1. Adv Mar Biol. 2005. PMID: 15596166 Review.
References
-
- Briscoe, N. J. et al. Mechanistic forecasts of species responses to climate change: the promise of biophysical ecology. Glob. Change Biol.29, 1451–1470 (2023). - PubMed
-
- Perry, A. L., Low, P. J., Ellis, J. R. & Reynolds, J. D. Climate change and distribution shifts in marine fishes. science308, 1912–1915 (2005). - PubMed
-
- Stenseth, N. C. et al. Ecological effects of climate fluctuations. Science29, 1292–1296 (2002). - PubMed
MeSH terms
Grants and funding
LinkOut - more resources
Full Text Sources
Medical
Miscellaneous
