. 2025 Mar;417(8):1649-1661.
doi: 10.1007/s00216-025-05755-w. Epub 2025 Feb 3.

Three-dimensional mass spectrometry imaging (3D MSI): incorporating top-hat IR-MALDESI and automatic z-axis correction

Affiliations

Three-dimensional mass spectrometry imaging (3D MSI): incorporating top-hat IR-MALDESI and automatic z-axis correction

Alexandria L Sohn et al. Anal Bioanal Chem. 2025 Mar.

Abstract

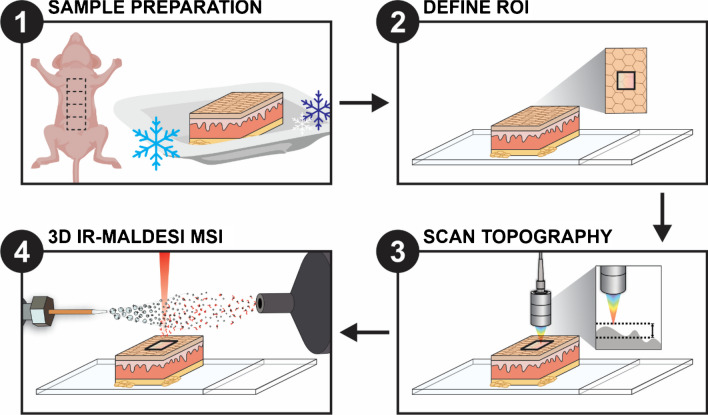
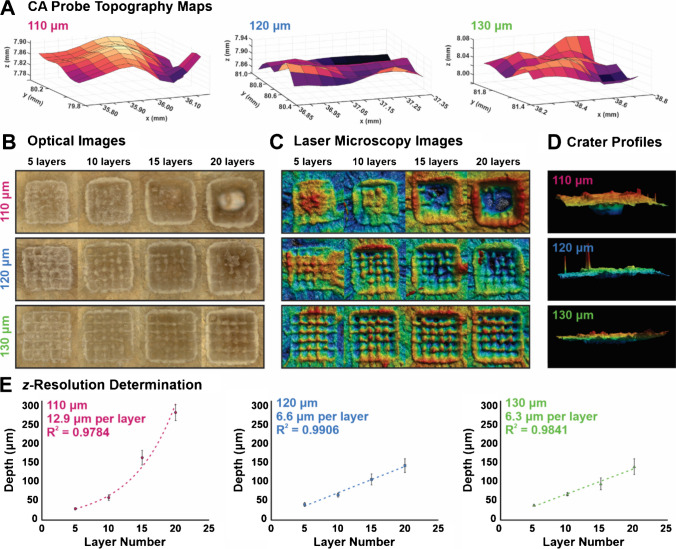
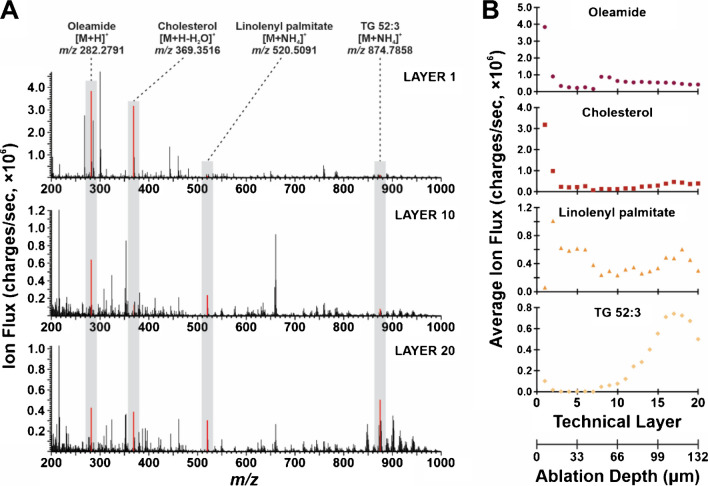
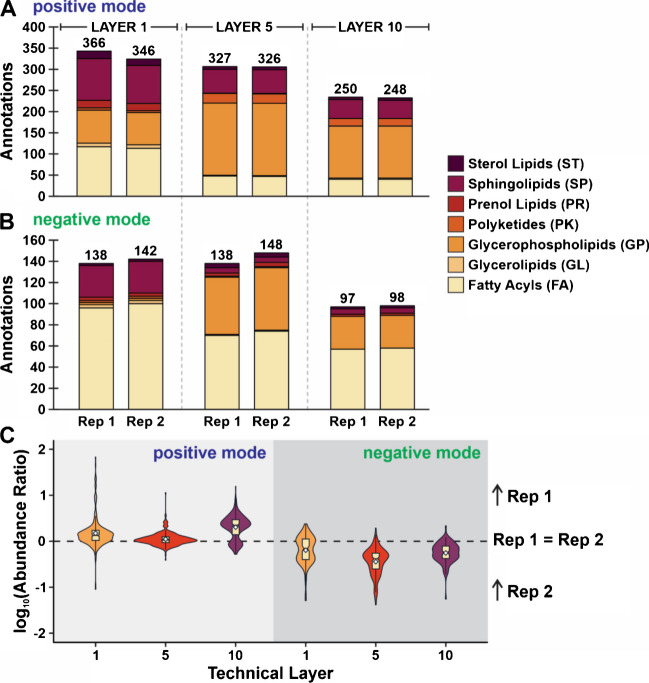
Leveraging a depth profiling approach expands the chemical elucidation of mass spectrometry imaging techniques to another dimension. Three-dimensional MSI (3D MSI) reveals the distribution of analytes with greater anatomical detail to add another level of information in a biological study. Infrared matrix-assisted laser desorption electrospray ionization (IR-MALDESI) has demonstrated utility for an ablation-based approach, enabling simplified sample preparation workflows and streamlined data processing pipelines compared to a serial-sectioning strategy. To improve 3D MSI on the IR-MALDESI platform, two technologies have been characterized in tandem for the intention of minimizing sampling bias: (1) a top-hat optical train and (2) a chromatic confocal probe (CA probe). While the modified optical train creates a square spot size to avoid a Gaussian ablation crater after the analysis of subsequent layers, the CA probe enables automatic z-axis correction (AzC) to maintain the laser's focus on the surface of the sample. The work herein demonstrates the integration and optimization of these technologies on mouse skin, motivated by the clear biological skin layers that result in differential lipid expression and subsequent detection. Results support that a laser energy of 1.3 mJ/burst with the top-hat optical train and a 120 µm step size in the X and Y dimensions presented a comparable depth resolution to previous studies at under 7 µm. Further, the optimized parameters were utilized on two biological replicates to evaluate method reproducibility where lipid annotations and their abundance were considered.

Keywords: 3D; Automatic z-axis correction; Lipids; Mass spectrometry imaging; Top-hat.


Conflict of interest statement

Declarations. Ethical approval: For sample preparation, all aspects of animal care and experimentation in this work were in compliance with NIH guidelines and approved by the NC State University Institutional Animal Care and Use Committee (IACUC, #19–811-B & #23–219). Competing interests: Data analysis for this manuscript was completed in part with MSiReader Pro v2.60 and D.C.M. is a part owner of MSI Software Solutions, LLC.

Figures

Fig. 1
Fig. 1
A summary of the experimental workflow for 3D MSI by top-hat IR-MALDESI with the incorporation of the CA probe for automatic z-axis adjustment. For MSI analysis, the defined ROI is scanned under the CA probe for topography measurements to inform AzC during imaging. Steps 3 and 4 are repeated for the desired number of technical layers
Fig. 2
Fig. 2
Using a laser energy of 1.3 mJ/burst, three step sizes were evaluated (110, 120, and 130 µm) with the aims of minimizing the amount of sample ablated for each layer to optimize the z-resolution in imaging experiments. A CA probe data show sample topography, where the z-axis was corrected at each voxel to maintain the laser’s focus. B Optical images and C laser microscopy images show an aerial view of the ROIs used for z-resolution determination, along with D the crater profiles from the side of the ROI at 20 technical layers. E The number of technical layers was plotted against the ablation depth and fit to a curve for z-resolution determination
Fig. 3
Fig. 3
The step sizes of interest were further interrogated to evaluate spectral differences in the first technical layer of analysis. A The mass spectra were similar between conditions, where various lipid categories (e.g., fatty acyls, glycerophospholipids) were detected and four tentatively identified lipids were compared at each step size. B The signal of these ions was compared and tested for significance
Fig. 4
Fig. 4
As the depth of the tissue is sampled, lipid heterogeneity is observed. A At optimized sampling conditions (1.3 mJ/burst, 120 µm step size), technical layers 1, 10, and 20 show different features in their mass spectra (average of 25 scans in ROI). Four tentatively identified lipids are highlighted (i.e., oleamide, cholesterol, linolenyl palmitate, TG 52:3) as their abundances change in the depth of the tissue. B The average abundance of the four species was plotted against the respective technical layer. The ablation per layer was estimated as 6.6 µm, enabling the correlation of ablation depth to the number of technical layers imaged
Fig. 5
Fig. 5
A Labeled histology of hairless SKH1 mouse skin, including two major skin layers (i.e., epidermis, dermis) and some anatomical features. The larger image was taken at 20 × magnification, and the callout box is at 40 × magnification. B Ion images can be visualized from an aerial perspective, where technical layers are shown in order starting from the top left and guided by the red numbers. C Alternatively, individual ROIs can be viewed as a line and stitched together to better visualize changes as the depth of the tissue is imaged. The red numbers on the right side of each ion image correlate to the technical layer, while the ablation depth is indicated on the left side of each image. The SMART information for this experiment is included beneath the images
Fig. 6
Fig. 6
3D ion images and colocalization plots show lipid heterogeneity throughout the skin. Each technical layer shows differences in detection for oleamide, linolenyl palmitate, and TG 52:3 throughout the depth of the tissue, where technical layers and their ablation depths are shown. When these ions are colocalized together as different colors (bottom right) their overlap and dominance in signal can be visualized and correlated with tissue anatomy
Fig. 7
Fig. 7
A The ablation depths during reproducibility studies varied from the original optimization work. These studies included two biological replicates in positive and negative mode, where 10 technical layers were imaged with ROI dimensions of 10 × 10 voxels with the optimized parameters. The average z-resolutions are reported based on 10 measurements and were based on the average total crater depth after analyzing 10 technical layers. B CA probe plots from the first technical layer of each analysis are provided. Optical images of the tissue from an aerial perspective are provided with profiles of the ablation craters. The sharp peaks in the crater profiles (bottom row) are an artifact of residual hair from the mouse skin that is out of the range of the measurement for laser microscopy
Fig. 8
Fig. 8
Lipid annotations are reported for both A positive and B negative mode, where the respective lipid categories are color coded. C For all common annotations, the detected ion abundance was averaged for each replicate. The ratio of the average abundances (Replicate 1:Replicate 2) was calculated and converted to a log10-scale to evaluate method reproducibility. If the abundance of a lipid was the same for both replicates at a certain layer, the log10(abundance ratio) is equal to zero. If this value was positive or negative, this indicates higher average abundance in Replicate 1 or 2, respectively. Violin plots were utilized to show the distribution of the data. Notch box plots are also included to show the 95% confidence interval of the median, and white diamonds indicate the mean of the values

References

    1. Vos DRN, Ellis SR, Balluff B, Heeren RMA. Experimental and data analysis considerations for three-dimensional mass spectrometry imaging in biomedical research. Mol Imaging Biol. 2021;23(2):149–59. 10.1007/s11307-020-01541-5. - PMC - PubMed
    1. Wang X, Han J, Li Z, Li B, Wan Y, Liu L. Editorial: insight into plant spatial omics: mass spectrometry imaging. 2023;14. 10.3389/fpls.2023.1273010. - PMC - PubMed
    1. Wang Y, Hummon AB. MS imaging of multicellular tumor spheroids and organoids as an emerging tool for personalized medicine and drug discovery. J Biol Chem. 2021;297(4):101139. 10.1016/j.jbc.2021.101139. - PMC - PubMed
    1. Dunham SJB, Ellis JF, Li B, Sweedler JV. Mass spectrometry imaging of complex microbial communities. Acc Chem Res. 2017;50(1):96–104. 10.1021/acs.accounts.6b00503. - PMC - PubMed
    1. Buchberger AR, DeLaney K, Johnson J, Li L. Mass spectrometry imaging: a review of emerging advancements and future insights. Anal Chem. 2018;90(1):240–65. 10.1021/ACS.ANALCHEM.7B04733. - PMC - PubMed

LinkOut - more resources