. 2025 Feb 3;16(1):1292.
doi: 10.1038/s41467-025-56384-x.

Cardiac repair using regenerating neonatal heart tissue-derived extracellular vesicles

Affiliations

Cardiac repair using regenerating neonatal heart tissue-derived extracellular vesicles

Hanjing Li et al. Nat Commun. .

Abstract

Neonatal mammalian hearts are capable of regenerating by inducing cardiomyocyte proliferation after injury. However, this regenerative capability in adult mammalian hearts almost disappears. Extracellular vesicles (EVs) have been shown to play vital cardioprotective roles in heart repair. Here, we report that EVs from regenerating neonatal heart tissues, after apical resection surgery (AR-Neo-EVs), exhibit stronger pro-proliferative, anti-apoptotic, and pro-angiogenesis activities than EVs from neonatal mouse cardiac tissues (Neo-EVs), effects which are absent in adult mouse heart-derived EVs (Adu-EVs). Proteomic analysis reveals the expression of Wdr75 protein, a regulator of p53, is higher in AR-Neo-EVs than in Neo-EVs. It is shown the regenerative potential of AR-Neo-EVs is abrogated when Wdr75 is knocked down. We further show that delivery of AR-Neo-EVs by sodium alginate hydrogel microspheres is an effective treatment in myocardial infraction. This work shows the potential of using EVs from regenerating tissue to trigger protective and regenerative mechanisms.


Conflict of interest statement

Competing interests: The authors declare no competing interests.

Figures
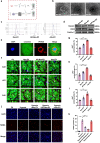
Fig. 1
Fig. 1. The extraction of extracellular vesicles from neonatal mouse cardiac tissues (Neo-EVs), extracellular vesicles from regenerating neonatal heart tissues by apical resection (AR) surgery (AR-Neo-EVs), and adult mouse heart-derived extracellular vesicles (Adu-EVs) and their effects on cardiomyocyte proliferation and apoptosis in vitro.
a Flow chart for the extracellular vesicles (EVs) purification procedure based on differential ultracentrifugation. Created in BioRender. gN, fW. (2025) https://BioRender.com/c15j088b Transmission electron microscope (TEM) of Neo-EVs, AR-Neo-EVs, and Adu-EVs. Scale bar = 100 nm. c Size distribution of Neo-EVs, AR-Neo-EVs, and Adu-EVs, as determined by nanoparticle tracking analysis (NTA). d The expression of typical EVs markers TSG101, CD63, and Flotillin 1 detected by Western blot. e PKH26-labeled EVs were co-cultured with cardiomyocytes for 6 h. Endocytosed EVs (PKH26, red) can be seen within the cytoplasm of cardiomyocytes (α-Actinin, green). Scale bar = 5 μm. f The effects of Neo-EVs, AR-Neo-EVs, and Adu-EVs on cardiomyocyte proliferation analyzed by the detection of Ki67, pH3, and EdU. Ki67, pH3, and EdU marked proliferating cells (red), α-Actinin labeled cardiomyocytes (green), and DAPI labeled nuclei (blue). Scale bar = 20 μm. White arrows point the positive cardiomyocytes. gi Quantitative analysis of the Ki67, pH3, and EdU proliferation assay (n = 5 independent experiments). *p < 0.05, **p < 0.01, ***p < 0.001 vs. Ctl, ***p < 0.001 vs. Neo-EVs. j The effects of Neo-EVs, AR-Neo-EVs, and Adu-EVs on cardiomyocyte apoptosis analyzed by TUNEL staining. TUNEL marked apoptosis cells (red) and DAPI labeled nuclei (blue). Scale bar = 20 μm. k Quantitative analysis of the TUNEL assay (n = 5 independent experiments). ***p < 0.001 vs. Ctl, ***p < 0.001 vs. Hypoxia, *p < 0.05 vs. Hypoxia+Neo-EVs. One-way ANOVA followed by Tukey’s Multiple Comparisons test. Error bars represent the mean ± SEM of each group. Source data are provided as a Source Data file. Exact p values are provided in the Source Data file.
Fig. 2
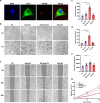
Fig. 2. Effects of Neo-EVs, AR-Neo-EVs, and Adu-EVs on angiogenesis of Human umbilical vein endothelial cells (HUVECs) in vitro.
a PKH26-labeled EVs were co-cultured with HUVECs for 6 h. Endocytosed EVs (PKH26, red) can be seen within the cytoplasm of HUVECs (CD31, green). Scale bar = 5 μm. b Tube formation experiments of HUVECs treated with different EVs. Scale bar = 150 μm. ce Quantitative analysis of tube formation experiments (n = 5 independent experiments). ***p < 0.001 vs. Ctl, ***p < 0.001 vs. Neo-EVs. f Scratch migration experiments of HUVECs treated with different EVs. Scale bar = 150 μm. g Quantitative analysis of scratch migration experiments (n = 5 independent experiments). ***p < 0.001 vs. Ctl, ***p < 0.001 vs. Neo-EVs. One-way ANOVA followed by Tukey’s Multiple Comparisons test (ce). Two-way ANOVA followed by Tukey’s Multiple Comparisons test (g). Error bars represent the mean ± SEM of each group. Source data are provided as a Source Data file. Exact p values are provided in the Source Data file.
Fig. 3
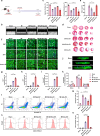
Fig. 3. AR-Neo-EVs promote cardiac repair in adult mice post-MI.
a Schematic diagram. Created in BioRender. gN, fW. (2025) https://BioRender.com/j56n116 (b, c) Representative echocardiogram images and quantification of the ejection fraction (EF) and fractional shortening (FS) in the Sham, MI, MI+Neo-EVs, MI + AR-Neo-EVs, and MI+Adu-EVs groups on Day 28 after MI (n = 5 independent mice). ***p < 0.001 vs. Sham, **p < 0.01, ***p < 0.001 vs. MI, *p < 0.05 vs. MI+Neo-EVs. d, e Masson’s trichrome staining and infract area quantification of heart sections at Day 28 post-MI (n = 5, 3, 4, 4, 3 independent mice). Scale bar = 500 μm. **p < 0.01, ***p < 0.001 vs. MI, ***p < 0.001 vs. MI+Neo-EVs. fi Representative immunofluorescence images and quantification of the Ki67, pH3, and Aurora B in the border region of adult mice at Day 7 after MI (n = 5 independent mice). Ki67, pH3, and Aurora B marked proliferating cells (red), α-Actinin labeled cardiomyocytes (green), and DAPI labeled nuclei (blue). Scale bar = 20 μm. White arrows point the positive cardiomyocytes. ***p < 0.001 vs. MI, ***p < 0.001 vs. MI+Neo-EVs. j, k Representative images and quantification of the number of mono-, bi-, and multi-nucleated cardiomyocytes in total cardiomyocytes (n = 4 independent mice). Scale bar = 50 μm. *p < 0.05, ***p < 0.001 vs. MI, *p < 0.05 vs. MI+Neo-EVs. l, m Representative flow cytometry images and quantification of Annexin V-FITC/PI staining was conducted to assess the apoptosis cells in EVs-treated mice hearts on Day 7 post-MI (n = 3 independent mice). ***p < 0.001 vs. Sham, *p < 0.05, ***p < 0.001 vs. MI, **p < 0.01 vs. MI+Neo-EVs. n, o Representative flow cytometry images and quantification of CD31-FITC-H staining was conducted to CD31+ cells in EVs-treated mice hearts on Day 7 post-MI (n = 3 independent mice). ***p < 0.001 vs. MI, ***p < 0.001 vs. MI+Neo-EVs. One-way ANOVA followed by Tukey’s Multiple Comparisons test (c, e, g, h, i, m, o). Two-way ANOVA followed by Sidak’s Multiple Comparisons test (k). Error bars represent the mean ± SEM of each group. Source data are provided as a Source Data file. Exact p values are provided in the Source Data file.
Fig. 4
Fig. 4. Preparation and characterization of injectable sodium alginate hydrogel microspheres (MS).
a Schematic diagram of the sodium alginate hydrogel MS prepared by microfluidic technology. Created in BioRender. gN, fW. (2025) https://BioRender.com/w82q737b Optical photograph of sodium alginate hydrogel MS. Scale bar = 100 μm. c Particle size analysis of the MS. d Scanning electron microscope (SEM) image of sodium alginate hydrogel MS. Scale bar = 20 μm. e The fluorescence image of EVs encapsulated MS (PKH26, red). Scale bar = 50 μm. f The percentage of EVs cumulative release from MS (n = 3 independent experiments). Error bars represent the mean ± SEM of each group. Source data are provided as a Source Data file.
Fig. 5
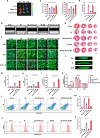
Fig. 5. Delivery of AR-Neo-EVs via MS can futher promote post-MI cardiac function recovery.
a Bioluminescent images of adult mice after injection of AR-Neo-EVs and AR-Neo-EVs-MS. b, c Representative echocardiogram images and quantification of the EF and FS in the Sham, MI, MI + AR-Neo-EVs, MI + MS, and MI + AR-Neo-EVs-MS groups on Day 28 after MI (n = 5 independent mice). ***p < 0.001 vs. Sham, ***p < 0.001 vs. MI, *p < 0.05, ***p < 0.001 vs. MI + AR-Neo-EVs. d, e Masson’s trichrome staining and infract area quantification of heart sections at Day 28 post-MI (n = 5, 4, 5, 3, 4 independent mice). Scale bar = 500 μm. ***p < 0.001 vs. MI, *p < 0.05 vs. MI + AR-Neo-EVs. fi Representative immunofluorescence images and quantification of the Ki67, pH3, and Aurora B in the border region of adult mice at Day 7 after MI (n = 5 independent mice). Ki67, pH3, and Aurora B marked proliferating cells (red), α-Actinin labeled cardiomyocytes (green), and DAPI labeled nuclei (blue). Scale bar = 20 μm. White arrows point the positive cardiomyocytes. ***p < 0.001 vs. MI, ***p < 0.001 vs. MI + AR-Neo-EVs. j, k Representative images and quantification of the number of mono-, bi-, and multi-nucleated cardiomyocytes in total cardiomyocytes (n = 4 independent mice). Scale bar = 50 μm. ***p <  0.001 vs. MI, **p < 0.01, ***p < 0.001 vs. MI + AR-Neo-EVs. l, m Representative flow cytometry images and quantification of Annexin V-FITC/PI staining was conducted to assess the apoptosis cells in EVs-treated mice hearts on Day 7 post-MI (n = 3 independent mice). ***p < 0.001 vs. Sham, ***p < 0.001 vs. MI, *p < 0.05 vs. MI + AR-Neo-EVs. n, o Representative flow cytometry images and quantification of CD31-FITC-H staining was conducted to CD31+ cells in EVs-treated mice hearts on Day 7 post-MI (n = 3 independent mice). ***p < 0.001 vs. MI. One-way ANOVA followed by Tukey’s Multiple Comparisons test (c, e, g, h, i, m, o). Two-way ANOVA followed by Sidak’s Multiple Comparisons test (k). Error bars represent the mean ± SEM of each group. Source data are provided as a Source Data file. Exact p values are provided in the Source Data file.
Fig. 6
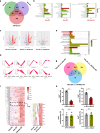
Fig. 6. Differential protein expression profiles in Neo-EVs, AR-Neo-EVs, and Adu-EVs.
a Venn diagram showing the overlap of proteins of differentially expressed Adu-EVs, Neo-EVs, and AR-Neo-EVs. b Gene ontology (GO) analyses of proteins in Adu-EVs, Neo-EVs, and AR-Neo-EVs. c Volcano plot for a comparison of protein expression profiles between different tissue EVs. The x-axis indicates the differential expression profiles, plotting the log2(Fold Change). The y-axis indicates the statistical significance of differences. d Fuzzy c-means clustering analyses of the protein expression profiles of different cardiac tissue EVs. e GO analyses of proteins in cluster 5. f Heatmap of differentially expressed proteins enriched in cluster 5. g Venn diagram showing the overlap of proteins of differentially expressed in cluster 5. h Quantitative analysis of the Ki67 and EdU proliferation assay in cardiomyocytes (n = 6 independent experiments). ***p < 0.001 vs. si-NC. Two-tailed Student’s t-test was used to compare the differences between the two experimental groups. Error bars represent mean ± SEM. Source data are provided as a Source Data file. Exact p values are provided in the Source Data file.
Fig. 7
Fig. 7. WD repeat domain 75 (Wdr75) protein plays a critical role in AR-Neo-EVs mediated cardiomyocyte proliferation and angiogenesis in vitro.
a The expression of Wdr75 protein in EVs from different cardiac tissue sources was detected by Western blot. b The effects of AR-Neo-EVs, AR-Neo+shWdr75-EVs, and AR-Neo+shNC-EVs on cardiomyocyte proliferation analyzed by the detection of Ki67, EdU, and pH3. Ki67, EdU, and pH3 marked proliferating cells (red), α-Actinin labeled cardiomyocytes (green), and DAPI labeled nuclei (blue). Scale bar = 20 μm. White arrows point the positive cardiomyocytes. ce Quantitative analysis of the Ki67, EdU, and pH3 proliferation assay (n = 5 independent experiments). ***p < 0.001 vs. Ctl, ***p < 0.001 vs. AR-Neo-EVs, ***p < 0.001 vs. AR-Neo+shWdr75-EVs. f, g The expression of p53 and p21 protein in cardiomyocytes treated with different EVs (n = 3, 5 independent experiments). *p < 0.05, **p < 0.01 vs. Ctl, **p < 0.01,***p < 0.001 vs. AR-Neo-EVs, *p < 0.05, **p < 0.01 vs. AR-Neo+shWdr75-EVs. h Tube formation experiments of HUVECs treated with different EVs. Scale bar = 150 μm. ik Quantitative analysis of tube formation experiments (n = 3 independent experiments). **p < 0.01, ***p < 0.001 vs. Ctl, *p < 0.05, ***p < 0.001 vs. AR-Neo-EVs, **p < 0.01 vs. AR-Neo+shWdr75-EVs. l Scratch migration experiments of HUVECs treated with different EVs. Scale bar = 150 μm. m Quantitative analysis of scratch migration experiments (n = 4 independent experiments). *p < 0.05, ***p < 0.001 vs. Ctl, ***p < 0.001 vs. AR-Neo-EVs, *p<0.05,***p < 0.001 vs. AR-Neo+shWdr75-EVs. n The expression and quantitative analysis of p53 protein in HUVECs treated with different EVs by Western blot (n = 5 independent experiments). **p < 0.01 vs. Ctl, **p < 0.01 vs. AR-Neo-EVs, *p < 0.05 vs. AR-Neo+shWdr75-EVs. o The mRNA expression of vascular endothelial growth factor (VEGF) in HUVECs treated with different EVs by qRT-PCR (n = 4 independent experiments). ***p < 0.001 vs. Ctl, ***p < 0.001 vs. AR-Neo-EVs, ***p < 0.001 vs. AR-Neo+shWdr75-EVs. One-way ANOVA followed by Tukey’s Multiple Comparisons test (c, d, e, f, g, i, j, k, n, o). Two-way ANOVA followed by Tukey’s Multiple Comparisons test (m). Error bars represent the mean ± SEM of each group. Source data are provided as a Source Data file. Exact p values are provided in the Source Data file.
Fig. 8
Fig. 8. The effects of Wdr75 on cardiomyocyte proliferation and angiogenesis.
a Cardiomyocytes were transfected with empty (NC), Wdr75 plasmid, and co-transfected with Wdr75 and p53 plasmids, and the proliferation of cardiomyocytes was evaluated by immunofluorescence staining with Ki67, EdU, and pH3. α-Actinin labeled cardiomyocytes (green) and DAPI labeled nuclei (blue). Scale bar = 20 μm. White arrows point the positive cardiomyocytes. bd Quantitative analysis of the Ki67, EdU, and pH3 proliferation assay (n = 4 independent experiments). ***p < 0.001 vs. NC, **p < 0.01 vs. Wdr75-OE. e, f Western blot analysis of p53 and p21 expression after transfected with NC, Wdr75 plasmid, and co-transfected with Wdr75 and p53 plasmids in cardiomyocytes (n = 4 independent experiments). **p < 0.01, ***p < 0.001 vs. NC, **p < 0.01, ***p < 0.001 vs. Wdr75-OE. g Tube formation experiments of HUVECs after transfected with NC, Wdr75 plasmid, and co-transfected with Wdr75 and p53 plasmids. Scale bar = 150 μm. hj Quantitative analysis of tube formation in HUVECs (n = 4 independent experiments). ***p < 0.001 vs. NC, ***p <0.001 vs. Wdr75-OE. k Scratch migration experiments of HUVECs after transfected with NC, Wdr75 plasmid, and co-transfected with Wdr75 and p53 plasmids. Scale bar = 150 μm. l Quantitative analysis of scratch migration experiments (n = 4 independent experiments). ***p < 0.001 vs. NC, ***p < 0.001 vs. Wdr75-OE. m Western blot analysis of p53 expression after transfected with NC, Wdr75 plasmid, and co-transfected with Wdr75 and p53 plasmids in HUVECs (n = 4 independent experiments). ***p < 0.001 vs. NC, ***p < 0.001 vs. Wdr75-OE. One-way ANOVA followed by Tukey’s Multiple Comparisons test (b, c, d, e, f, h, i, j, m). Two-way ANOVA followed by Tukey’s Multiple Comparisons test (l). Error bars represent mean ± SEM. Source data are provided as a Source Data file. Exact p values are provided in the Source Data file.
Fig. 9
Fig. 9. Schematic overview of the development of an AR-Neo-EVs loaded with MS for cardiac repair.
EVs was extracted from regenerating neonatal heart tissues by AR surgery, and then the extracted AR-Neo-EVs was mixed with sodium alginate solution to prepare sodium alginate hydrogel MS. The synthetic AR-Neo-EVs-MS was injected into the heart of adult mouse MI to mediate the sustained release of AR-Neo-EVs. Mechanically, after transferring highly expressed Wdr75 in AR-Neo-EVs to recipient cells, highly expressed Wdr75 can inhibit p53-p21 axis, promote cardiomyocyte cell cycle re-entry, reduce cardiomyocyte apoptosis, promote angiogenesis, and play a role in cardiac repair. This Figure was created by figdraw.com.

References

    1. Yellon, D. M. & Hausenloy, D. J. Myocardial Reperfusion Injury. N. Engl. J. Med.357, 1121–1135 (2007). - PubMed
    1. Wu, X., Reboll, M. R., Korf-Klingebiel, M. & Wollert, K. C. Angiogenesis after acute myocardial infarction. Cardiovasc. Res.117, 1257–1273 (2021). - PubMed
    1. Heusch, G. Cardioprotection: chances and challenges of its translation to the clinic. Lancet381, 166–175 (2013). - PubMed
    1. Shen, D., Cheng, K. & Marbán, E. Dose‐dependent functional benefit of human cardiosphere transplantation in mice with acute myocardial infarction. J. Cell. Mol. Med.16, 2112–2116 (2012). - PMC - PubMed
    1. Fan, Q. et al. Depletion of Endothelial Prolyl Hydroxylase Domain Protein 2 and 3 Promotes Cardiomyocyte Proliferation and Prevents Ventricular Failure Induced by Myocardial Infarction. Circulation140, 440–442 (2019). - PMC - PubMed