. 2025 Feb 3;16(1):1313.
doi: 10.1038/s41467-025-56564-9.

USP5 stabilizes YTHDF1 to control cancer immune surveillance through mTORC1-mediated phosphorylation

Affiliations

USP5 stabilizes YTHDF1 to control cancer immune surveillance through mTORC1-mediated phosphorylation

Na Shao et al. Nat Commun. .

Abstract

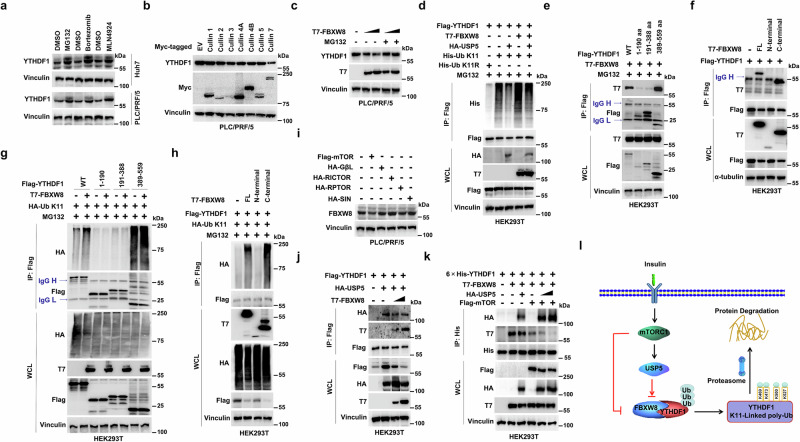
The N6-methyladenosine binding protein YTHDF1, often upregulated in cancer, promotes tumor growth and hinders immune checkpoint blockade treatment. A comprehensive understanding of the molecular mechanisms governing YTHDF1 protein stability is pivotal for enhancing clinical response rates and the effectiveness of immune checkpoint blockade in cancer patients. Here, we report that USP5 interacts with YTHDF1, stabilizing it by removing K11-linked polyubiquitination. Insulin activates mTORC1, phosphorylating USP5 and promoting its dimerization, which binds to and protects YTHDF1 from degradation. Conversely, the CUL7-FBXW8 E3 ligase promotes YTHDF1 degradation. Deficiency in YTHDF1 or USP5 increases PD-L1 expression and suppresses immune-related gene expression, facilitating immune evasion. Combining USP5 inhibition with anti-PD-L1 therapy enhances anti-tumor immunity, suggesting USP5 as a potential biomarker for patient stratification. This study reveals a ubiquitination-dependent regulation of YTHDF1, proposing USP5 inhibition alongside PD-(L)1 blockade as a promising cancer treatment strategy.


Conflict of interest statement

Competing interests: The authors declare no competing interests.

Figures

Fig. 1
Fig. 1. USP5 removes K11-linked polyubiquitination from YTHDF1 and inhibits its degradation.
a Immunoblot (IB) analysis of whole-cell lysates (WCL) and anti-Flag immunoprecipitates (IP) from HEK293T cells transfected with GFP-Ub and Flag-YTHDF1. b YTHDF1 polyubiquitination could largely be detected in cells transfected with indicated constructs. c IB analysis of WCL and His immunoprecipitate from HEK293T cells transfected with indicated constructs. d PLC/PRF/5 cells were immunoprecipitated with either anti-USP5 or anti-YTHDF1 antibody and then analyzed by IB. e IB and IP products analysis of USP5-YTHDF1 interaction in HEK293T cells expressing HA-USP5 WT or the indicated truncated YTHDF1 mutants. f, g IB analysis of YTHDF1 levels in HEK293T cells expressing HA-USP5 (DNA content of 250 ng or 500 ng) or indicated plasmids. h IB and QRT-PCR analysis of YTHDF1 from Hepa1-6 cells with Usp5 knockout. n = 3. i, j IB analysis of WCL from Hepa1-6 cells with the depletion of Usp5 or HEK293T cells transfected with indicated constructs for 36 h. Cells were treated with 100 μg/ml CHX at indicated time points. The YTHDF1 levels was quantified by the ImageJ software. k IB analysis of WCL and IP products from HEK293T cells transfected with indicated constructs. Cells were treated with 20 μM MG132 for 8 h. l Effects of Usp5 knockout in Hepa1-6 cells on Ythdf1 K11-linked polyubiquitination were evaluated by IB. m Effects of WP1130 on USP5-mediated YTHDF1 K11-linked polyubiquitination. Cells expressing indicated plasmids were treated with different doses of WP1130. n IB analysis of proteins labeled with puromycin using anti-puromycin antibody upon Usp5 depletion with or without expressing Ythdf1. o, p Assessment of subcutaneous tumor formation from PLC/PRF/5 cells after depletion of USP5, or YTHDF1, or stably expressing YTHDF1 with endogenous USP5 knockdown. Tumor weight was measured at the endpoint of the study. Tumor growth was measured at the indicated time points. n = 5. *p < 0.05, t-test. q Kaplan-Meier analysis revealed a relationship between YTHDF1 and USP5 expression and overall survival in HCC patients. All data are presented as mean ± SEM. All IB data are representative of three independent experiments. Source data are provided as a Source Data file.
Fig. 2
Fig. 2. USP5 deubiquitinates YTHDF1 on multiple lysine residues to confer its oncogenicity.
a IB analysis of WCL and anti-Flag IPs from HEK293T cells transfected with indicated constructs and treated with the 20 μM MG132 for 8 h. b In vivo ubiquitination assay of YTHDF1 in HEK293T cells expressing Flag-YTHDF1 WT and indicated truncated YTHDF1 mutants in the presence or absence of ectopic USP5 expression. Cells were treated with 20 μM MG132 for 8 h. c IB analysis of the protein levels of the indicated truncated YTHDF1 mutants in HEK293T cells expressing increasing amounts of HA-USP5. d IB analysis of WCL and IP derived from HEK293T cells transfected with indicated constructs. Cells were treated with 20 μM MG132 for 8 h. e IB analysis of WCL derived from HEK293T cells transfected with indicated constructs. 36 h post-transfection, cells were treated with 100 μg/ml CHX at indicated time points. The YTHDF1 protein abundance was quantified by the ImageJ software. f In vivo ubiquitination assays of WCL and anti-Flag IPs derived from HEK293T cells transfected with plasmids expressing the indicated proteins. Cells were treated with 20 μM MG132 for 8 h. g In vivo ubiquitination assay of USP5 knockout in PLC/PRF/5 cells transfected with WT Flag-YTHDF1 or indicated mutant constructs. YTHDF1 polyubiquitination was evaluated by IB analysis. Cells were treated with 20 μM MG132 for 8 h. h Colony formation assays of PLC/PRF/5 cells stably expressing YTHDF1-WT or -4KR mutant with endogenous YTHDF1 knockout. n = 3 per group. **p < 0.01. t-test. i, j Assessment of subcutaneous tumor formation from PLC/PRF/5 cells stably expressing YTHDF1-WT or -4KR mutant with endogenous YTHDF1 knockout. Tumor weight was measured at the endpoint of the study. In vivo tumor growth was measured at the indicated time points and tumors were dissected at the endpoint. n = 6 per group. **p < 0.01, t-test. All data are presented as mean ± SEM. All IB data are representative of two independent experiments. Source data are provided as a Source Data file.
Fig. 3
Fig. 3. Insulin regulates USP5 function through mTORC1-mediated phosphorylation to enhance YTHDF1 stability.
a IB analysis using the indicated antibodies in PLC/PRF/5 and Hepa1-6 cells treated with increasing concentrations of insulin for 30 min. b Reduced YTHDF1 polyubiquitination upon growth factor stimulation. HEK293T cells transfected with ubiquitin constructs were lysed for anti-YTHDF1 IP and IB. c The WT and Usp5-KO cells were treated with insulin (100 ng/ml) or Torin1 (1.0 μM). After 30 min or 24 h, cells were collected and analyzed by IB. d IB analysis of YTHDF1 protein levels in PLC/PRF/5 cells expressing the indicated constructs. e Knockdown of USP5 inhibits mTOR or RPTOR-induced accumulation of YTHDF1. The WT and USP5-KD PLC/PRF/5 cells were transfected with Flag-mTOR or HA-RPTOR constructs for 36 h. f IB analysis of YTHDF1 immunoprecipitate or WCL from PLC/PRF/5 cells transfected with Flag-YTHDF1. Cells were then serum starved for 16 h and stimulated with insulin (100 ng/ml) for 30 min. g IB analysis of WCL and IP derived from HEK293T cells transfected with various HA-USP5 constructs as well as Flag-USP5. Cells were pretreated with 1.0 μM Torin1 for 24 h. h IB analysis of WCL and IP derived from HEK293T cells transfected with Flag-mTOR together with the HA-USP5 constructs for 36 h. i In vivo ubiquitination analysis of YTHDF1 in PLC/PRF/5 cells expressing the indicated HA-USP5 constructs. Cells were treated with 20 μM MG132 for 8 h. j In vivo phosphorylation assay of HA-USP5 WT and S149A mutant in HEK293T cells with or without ectopic Flag-mTOR expression. k The S149 mutant disrupted USP5 dimerization process in cells. IB analysis of WCL and IP derived from HEK293T cells transfected with constructs indicated. l Co-IP analysis of USP5/YTHDF1 interaction in HEK293T cells with expressing the indicated constructs. m A simplified model depicting the regulatory mechanism of USP5 by insulin signaling pathways. The active mTORC1 phosphorylates USP5 at S149, which promotes its dimerization and stabilizes YTHDF1, and then feedback positively regulates mTORC1 activity by increasing RPTOR mRNA translation. All data are representative of two independent experiments. Source data are provided as a Source data file.
Fig. 4
Fig. 4. CUL7-FBXW8 ubiquitinates YTHDF1 to promote its degradation.
a IB analysis of YTHDF1 protein levels in Huh7 and PLC/PRF/5 cells after treatment of 20 μM MG132, 10 μM Bortezomib, or 5 μM MLN4924 for 8 h. b IB analysis of YTHDF1 protein levels in PLC/PRF/5 cells transfected with an empty vector (EV) or vectors encoding various Myc-tagged Cullin proteins. c IB analysis of YTHDF1 protein levels in PLC/PRF/5 cells expressing increasing amount of T7-FBXW8. Cells were treated with 20 μM MG132 for 8 h. d FBXW8 and USP5 control K11-linked ubiquitination of YTHDF1. IB analysis of IP and WCL derived from HEK293T cells transfected with indicated constructs. e IB and IP products analysis of FBXW8-YTHDF1 interaction in HEK293T cells expressing T7-FBXW8 WT or the indicated truncated YTHDF1 mutants. Cells were treated with 20 μM MG132 for 8 h before harvesting. f IB and IP products analysis of FBXW8-YTHDF1 interaction in HEK293T cells expressing Flag-YTHDF1 or the indicated truncated FBXW8 mutants. Cells were treated with 20 μM MG132 for 8 h before harvesting. g In vivo ubiquitination assay of YTHDF1 in HEK293T cells expressing Flag-YTHDF1 or the indicated truncated YTHDF1 mutants in the presence or absence of ectopic FBXW8 expression. Cells were treated with 20 μM MG132 for 8 h before harvesting. h In vivo ubiquitination assay of YTHDF1 in HEK293T cells expressing Flag-YTHDF1 in the presence ectopic FBXW8 expression or the indicated truncated FBXW8 mutants. Cells were treated with 20 μM MG132 for 8 h before harvesting. i IB analysis of YTHDF1 protein levels in PLC/PRF/5 cells expressing the indicated mTOR components. j FBXW8 antagonism USP5-YTHDF1 interaction. IB and IP products analysis of USP5/YTHDF1 or FBXW8/YTHDF1 interaction in HEK293T cells expressing Flag-YTHDF1 or HA-USP5, plus with or without expressing increasing amounts of T7-FBXW8. k IB and IP products analysis of USP5/YTHDF1 or FBXW8/YTHDF1 interaction in HEK293T cells with or without ectopic mTOR expression. l A model illustrating the roles of mTORC1 pathway in governing USP5/FBXW8-controlled YTHDF1 K11-linked poly-ubiquitination. All data are representative of two independent experiments. Source data are provided as a Source data file.
Fig. 5
Fig. 5. USP5 deficiency enhances PD-L1 expression, inhibits tumor cell-intrinsic immune response and remodels anti-tumor immunity.
a Kaplan-Meier analysis of USP5 and CD4 or CD8 expression and overall survival of 90 HCC patients. b A total of 5.0 × 106 WT or Usp5-KO Hepa1-6 cells were subcutaneously implanted in C57BL/6 mice pretreated with anti-IgG, anti-NK1.1, anti-CD4, and anti-CD8 antibodies (n = 6). Tumor growth was monitored at the indicated time points. ***p < 0.001 by two-way ANOVA. c IB analysis of lysates derived from dissected xenografts formed by Usp5-depleted H22 or Hepa1-6 cells. d, e IB analysis of Pd-l1 in the WT and Usp5-KO Hepa1-6 cells transfected with Flag-Ythdf1 constructs for 36 h or treated with 2.5 μM WP1130 for 24 h. f Activated T cells and tumor cells were co-cultured in 24-well plates for 4 days and surviving tumor cells were visualized by crystal violet staining. Relative fold ratios of surviving cell intensities are shown. n = 3. **p < 0.01. t-test. g Correlation between the fold changes of differentially expressed genes in Ythdf1 and Usp5 knockout Hepa1-6 cells. h The top 5 terms in GO analysis of the immune-related genes suppressed by both Usp5 and Ythdf1 knockout Hepa1-6 cells. n = 3. i GSEA and heatmap showing the differential expression of genes in Fig. 5g. n = 3. j mRNA levels of indicated genes from sgUsp5 or sgCtrl Hepa1-6 cells were analyzed using QRT-PCR. n = 3. *p < 0.05, **p < 0.01, ***p < 0.001, ****p < 0.0001. t-test. k The mRNA and protein levels in Usp5 and Ythdf1 knockout Hepa1-6 cells are measured by RNA-Seq and proteomics. l, m Usp5 or Ythdf1 depletion affects tumor growth in mouse xenograft in NOD/SCID and C57BL/6 mice (n = 8). Tumor growth was monitored at the indicated time points, and tumor volume were measured at the endpoint (l). Tumor image and tumor weight are presented (m). ***p < 0.001 by two-way ANOVA. All data are presented as mean ± SEM. All IB data are representative of two independent experiments. Source data are provided as a Source Data file.
Fig. 6
Fig. 6. Targeting USP5 potentiates anti-PD-L1 immunotherapy in murine HCC models.
a Tumor growth of sgCtrl and sgUsp5 Hepa1-6 cells in C57BL/6 mice with anti-IgG mAb or anti-PD-L1 mAb treatments. n = 10. b Kaplan-Meier survival curves for four treatment groups demonstrate the improved efficacy of PD-L1 mAb after knockout Usp5. **P < 0.01. c A schematic model illustrating the treatment plan for mice bearing subcutaneous Hepa1-6 or H22 tumors. Male C57BL/6 mice were implanted with Hepa1-6 or H22 cells subcutaneously and treated with four arms: control antibody (anti-IgG mAb) treatment, anti-PD-L1 mAb treatment, USP5 inhibitor WP1130 treatment, and anti-PD-L1 mAb plus USP5 inhibitor combination treatment. d Hepa1-6 and H22 implanted tumor-bearing mice were enrolled in different treatment groups as indicated. Tumor volumes of mice treated with control antibody, anti-PD-L1 mAb, the USP5 inhibitor WP1130, or combined therapy were measured every 3 days and plotted individually. n = 10 mice per group. e Kaplan-Meier survival curves for each treatment group demonstrate the improved efficacy of combining PD-L1 mAb with the USP5 inhibitor WP1130. *** P < 0.001. f Immunohistochemical (IHC) analysis of Cd8, Granzyme B (GzmB), Tim-3, Ythdf1 and Pd-l1 expression in Hepa1-6 tumors after indicated treatments. g Representative multiplex immunohistochemistry (mIHC) images of Cd8 (Gray), GzmB (Green), Tim-3 (Red), and DAPI nuclear staining (blue) in Hepa1-6 tumors after indicated treatments. All data are presented as mean ± SEM. Source data are provided as a Source Data file.
Fig. 7
Fig. 7. USP5 expression defines the clinical outcome in anti-PD-1 /PD-L1 immunotherapy.
Representative USP5 protein staining of tumor sections (top: 100×, bottom: 400×) (left) and CT scans (right) from liver cancer patients (a) or lung cancer patients (b) undergoing anti-PD-1 treatment. CT scans of patient tumors are shown. c, d Waterfall plot depicting the responses to anti-PD-1 treatment based on the best change in the sum of target lesions compared to baseline in cancer patients with low USP5 or high USP5 expression. Each bar represents one patient, and the colors correspond to the response to anti-PD-1 treatment (PR: partial response, SD: stable disease, PD: progressive disease). Dotted black lines indicate the response as described by RECIST1.1. e, f Pie charts illustrating the response fractions for each group of patients with USP5-low and USP5-high expression in tumor cells. g IB analysis of indicated proteins derived from two fresh HCC samples (HCC180328 and HCC191017) before the establishment of the humanized mouse model. h IB analysis of indicated proteins in a subcutaneous humanized mouse model after 21 days of treatment with anti-IgG or anti-PD-1. i A working model for targeting USP5 to sensitize tumors to PD-1/PD-L1 blockade. USP5 downregulates PD-L1 and enhances the immunosuppressive response, leading to resistance to PD-1/PD-L1 blockade (Left Panel). Inhibition of USP5 by WP1130 upregulates PD-L1 and reduces the immunosuppressive response to sensitize the tumor to anti-PD-1/PD-L1 immunotherapy (Right Panel). All IB data are representative of two independent experiments. Source data are provided as a Source Data file.

References

    1. Chen, D. S. & Mellman, I. Elements of cancer immunity and the cancer-immune set point. Nature541, 321–330 (2017). - PubMed
    1. Ribas, A. & Wolchok, J. D. Cancer immunotherapy using checkpoint blockade. Science359, 1350–1355 (2018). - PMC - PubMed
    1. Sharma, P., Hu-Lieskovan, S., Wargo, J. A. & Ribas, A. Primary, adaptive, and acquired resistance to cancer immunotherapy. Cell168, 707–723 (2017). - PMC - PubMed
    1. Restifo, N. P., Smyth, M. J. & Snyder, A. Acquired resistance to immunotherapy and future challenges. Nat. Rev. Cancer16, 121–126 (2016). - PMC - PubMed
    1. Palmer, A. C. & Sorger, P. K. Combination cancer therapy can confer benefit via patient-to-patient variability without drug additivity or synergy. Cell171, 1678–1691 (2017). - PMC - PubMed

MeSH terms