. 2025 Feb 4;16(1):1330.
doi: 10.1038/s41467-025-56613-3.

Non-canonical lysosomal lipolysis drives mobilization of adipose tissue energy stores with fasting

Affiliations

Non-canonical lysosomal lipolysis drives mobilization of adipose tissue energy stores with fasting

G V Naveen Kumar et al. Nat Commun. .

Abstract

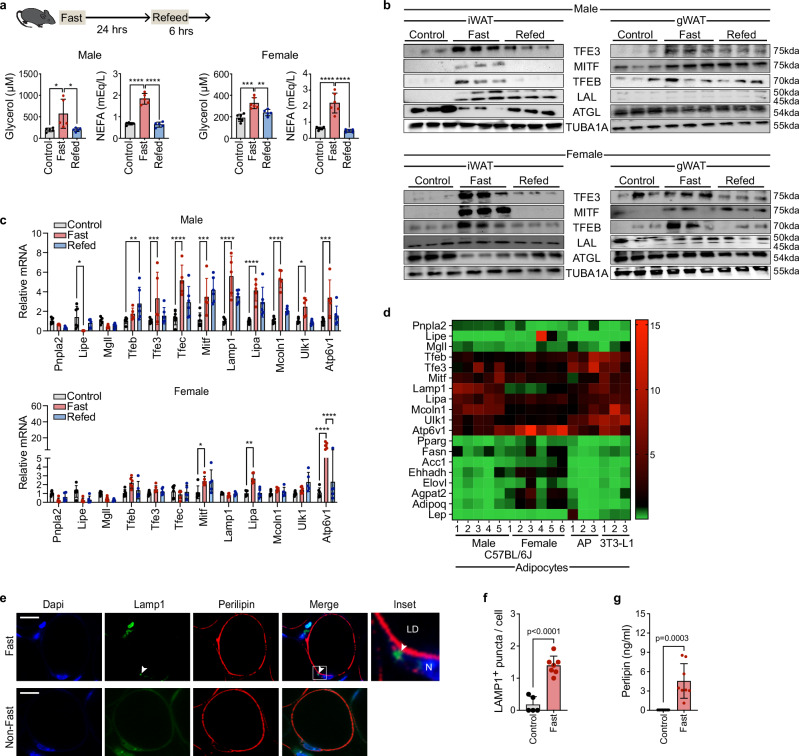
Physiological adaptations to fasting enable humans to survive for prolonged periods without food and involve molecular pathways that may drive life-prolonging effects of dietary restriction in model organisms. Mobilization of fatty acids and glycerol from adipocyte lipid stores by canonical neutral lipases, including the rate limiting adipose triglyceride lipase (Pnpla2/ATGL), is critical to the adaptive fasting response. Here we discovered an alternative mechanism of lipolysis in adipocytes involving a lysosomal program. We functionally tested lysosomal lipolysis with pharmacological and genetic approaches in mice and in murine and human adipocyte and adipose tissue explant culture, establishing dependency on lysosomal acid lipase (LIPA/LAL) and the microphthalmia/transcription factor E (MiT/TFE) family. Our study establishes a model whereby the canonical pathway is critical for rapid lipolytic responses to adrenergic stimuli operative in the acute stage of fasting, while the alternative lysosomal pathway dominates with prolonged fasting.


Conflict of interest statement

Competing interests: PKF is a consultant for Regeneron. She has also served on advisory boards Camurus, Crintetics, and Amryt/Chiesi and has research funding from Crinetics, Corcept, and Quest. These disclosures are not related to the content of the study. The other authors declare no competing interests.

Figures

Fig. 1
Fig. 1. Fasting drives a lysosomal program in murine adipose tissue.
a Murine model of fasting-induced lipolysis. Mice were fasted for 24 h and refed for 6 h (C57Bl6 male n = 5; female mice n = 6 cont, 6 fast, 5 refed, 8-weeks-old). Statistical significance was assessed by one-way ANOVA/Tukey’s test. Left: male serum glycerol: *p = 0.03; male serum non-esterified fatty acids (NEFA): ****p < 0.0001. Right: female glycerol: ***p = 0.0001, **p = 0.007; NEFA: ****p < 0.0001. When present error bars indicate s.d.m. (a). b Inguinal (iWAT) and gonadal (gWAT) adipose tissue immunoblots for canonical lipase (ATGL), lysosomal transcriptional regulators (TFEB, TFE3, MITF), and the lysosomal lipase (LAL). The control, fasting, refeeding protocol was the same as in ‘a’. Note: tubulin controls run on different gels. c qPCR of adipocytes isolated from inguinal adipose tissue, including canonical lipolytic genes and lysosomal genes. Male n = 6 con, 5 fast, 6 refed; Female n = 6 con, 6 fast, 5 refed: *p < 0.05; **p < 0.01; ***p < 0.001; ****p < 0.0001, two-way ANOVA/Dunnett’s test. The control, fasting, refeeding protocol was the same as in ‘a’. d Heat-map comparing isolated adipocytes (from C) to nutrient-restricted adipocyte cultures derived from primary adipocyte progenitor (AP) cells (n = 3 biological replicates) or 3T3L1 cells (n = 3 biological replicates). e. Whole mount immunofluorescence staining for marker of lysosomes (LAMP1) in adipose tissue. Arrow=putative LAMP1+ puncta indicating lysosomes. LD=lipid droplet. N = nucleus. Scale = 10 micron. N = 5 control, 7 fasted stained in this manner and used for blinded counting shown in ‘f’. f Blinded observer counted perinuclear LAMP1+ puncta in perilipin+ adipocytes: n = 5 control, 7 fasted; two-sided T-test; error bars S.D.M. g Perilipin levels were measured by ELISA in lysosome preparations from isolated adipocytes. Perilipin was undetectable in the lysosome preparations from fed mice; therefore the lower-limit of the assay (0.055 ng/mL) was used for the purpose of the graph. Each dot represents one mouse, n = 8, significance assessed by two-tailed t-test; error bars S.D.M.
Fig. 2
Fig. 2. Non-canonical lysosomal lipolytic mechanisms are functional with prolonged fasting.
a Schematic of adipocyte specific ATGL/Pnpla2 loss of function (KO) relative to control (FLOX), using mice that were 8–9 weeks old at study start. Paired blood draws were used to assess the lipolytic response to adrenergic stimulus (isoproterenol) and fasting. For panels dh, data shown as mean, S.D.M. b Change in plasma NEFA with isoproterenol (ISO) or fast. Significance for genotype effect assessed by two-way ANOVA. FLOX male n = 5; KO male n = 7; FLOX female n = 5 with iso and n = 6 with fasting; KO female n = 7. c Change in plasma glycerol with isoproterenol (ISO) or fast. Significance for genotype effect assessed by two-way ANOVA. FLOX male n = 5; FLOX female n = 5; KO male n = 7; KO female n = 6. d Change in body weight assessed by two-tailed t-test: FLOX male n = 6; FLOX female n = 5; KO male n = 7; KO female n = 7. Significance assessed by two-tailed t-test. e Terminal plasma ketone levels. FLOX male n = 6; FLOX female n = 5; KO male n = 7; KO female n = 6. Significance assessed by two-tailed t-test. f Terminal plasma FGF21 levels. FLOX male n = 5; FLOX female n = 5; KO male n = 7; KO female n = 7. Significance assessed by two-tailed t-test. g Terminal plasma glucose levels. FLOX male n = 5; FLOX female n = 5; KO male n = 7; KO female n = 6. Significance assessed by two-tailed t-test. h qPCR of isolated inguinal (iWAT) and gonadal (gWAT) adipocytes for lipolysis and lysosome genes. FLOX n = 10 (male n = 5, female n = 5; KO n = 13 (male n = 7; female n = 6). Two-way ANOVA, **p = 0.008; ***p = 0.0002; ****p < 0.0001. i Immunoblots for iWAT and gWAT adipose tissue collected at the 24-hour fasting timepoint. Note: tubulin controls run on different gels.
Fig. 3
Fig. 3. Targeting transcriptional regulators of lysosomal function in adipocytes attenuates lipolysis with prolonged fasting.
a Schematic of tamoxifen-inducible adipocyte-specific Tfeb loss of function (KO) relative to controls (FLOX), using mice that were 8 weeks old at study start. Paired blood draws were used to assess the lipolytic response to adrenergic stimulus (isoproterenol) and fasting. For panels d and fj, data show mean, S.D.M. b. Change in plasma non-esterified fatty acids (NEFA) with isoproterenol (ISO) or fast: FLOX n = 9 (6 male, 3 female); KO n = 13 (7 male, 6 female). Two-way ANOVA to assess genotype effect. c Change in plasma glycerol with isoproterenol (ISO) or fast. FLOX n = 9 (6 male, 3 female); KO n = 13 (7 male, 6 female). ****p < 0.0001, two-way ANOVA to assess genotype effect. d qPCR analyses of isolated adipocytes in control mice (FLOX) or adipocyte specific Tfeb loss of function (KO) (n = 9 FLOX; n = 13 KO). Two-way ANOVA to assess genotype effect. e Immunoblots of gonadal adipose tissues (gWAT) for LAL, TFEB, and ATGL collected at the 24-hour fasting timepoint. Note: tubulin control was run on a different gel. f qPCR analyses of glucose metabolism genes in isolated adipocytes from control mice (FLOX) or adipocyte specific Tfeb loss of function (KO) mice (n = 9 FLOX; n = 13 KO). Two-way ANOVA to assess genotype effect, *p < 0.05; **p < 0.01; ***p < 0.001; ****p < 0.0001. g Terminal plasma glucose in control mice (FLOX) or adipocyte specific Tfeb loss of function (KO). FLOX n = 9 (6 male, 3 female); KO n = 13 (7 male, 6 female). Significance assessed by two-tailed t-test. h Terminal plasma ketones in control mice (FLOX) or adipocyte specific Tfeb loss of function (KO). FLOX n = 9 (6 male, 3 female); KO n = 13 (7 male, 6 female). Significance assessed by two-tailed t-test. i Change in body weight. FLOX n = 9 (6 male, 3 female); KO n = 13 (7 male, 6 female). Significance assessed by two-tailed t-test. j Terminal plasma fibroblast growth factor 21 (FGF21) levels measured by ELISA: FLOX n = 9 (6 male, 3 female). Significance assessed by two-tailed t-test.
Fig. 4
Fig. 4. Temporal transition from ATGL-dependent to LAL-dependent adipocyte lipolysis with fasting.
a ATGL loss of function (KO) by targeting Pnpla2 (b, d, e, h,i, l,m, p); LAL loss of function (KO) by targeting Lipa (c, f,g, j,k, n,o, q); each shown relative to controls (FLOX). For panels bo, data shown as mean, S.D.M. b Isoproterenol (ISO)-stimulated non-esterified fatty acids (NEFA) (left) and glycerol (right). FLOX n = 12 (8 male, 4 female); KO n = 15 (8 male, 7 female). For bg: two-way ANOVA, genotype effect. c ISO-stimulated NEFA (left) and glycerol (right). FLOX n = 19 (9 male, 10 female); KO n = 18 (10 male, 8 female). d Body weight change with fasting. FLOX n = 12 (8 male, 4 female); KO n = 13 (8 male, 5 female). e Plasma glucose change with fasting. FLOX n = 12 (8 male, 4 female); KO n = 13 (8 male, 5 female). f Body weight change with fasting. FLOX n = 19 (9 male, 10 female); KO n = 18 (10 male, 8 female). g Plasma glucose change with fasting. FLOX n = 19 (9 male, 10 female); KO n = 18 (10 male, 8 female). h Terminal plasma ketones. FLOX n = 12 (8 male, 4 female); KO n = 13 (8 male, 5 female). For hk, significance assessed by two-tailed t-test. i Terminal liver triglycerides. FLOX n = 12 (8 male, 4 female); KO n = 13 (8 male, 5 female). j Terminal plasma ketones. FLOX n = 19 (9 male, 10 female); KO n = 18 (10 male, 8 female). k Terminal liver triglycerides. FLOX n = 19 (9 male, 10 female); KO n = 18 (10 male, 8 female). l qPCR of inguinal (iWAT) adipocytes from ATGL KO (n = 12) or control (n = 13). For lo Two-way ANOVA: *p < 0.05; **p < 0.01; ***p < 0.001; ****p < 0.0001. m qPCR of gonadal (gWAT) adipocytes: ATGL KO (n = 12) or FLOX (n = 13). n qPCR of inguinal adipocytes: LIPA KO (n = 12) or FLOX (n = 12). o qPCR of gonadal adipocytes: LIPA KO (n = 12) or FLOX (n = 12). p Immunoblot of inguinal and gonadal adipose tissues from control or adipocyte-specific ATGL loss of function (KO) mice; 24-hour fasting timepoint. q Immunoblot of inguinal and gonadal adipose tissues from control or LIPA loss of function (KO) mice; 24-hour fasting timepoint. Note for p,q: tubulin controls run on different gels.
Fig. 5
Fig. 5. Lysosome-dependent lipolysis is operative in human adipose tissue with fasting.
a MiT/TFE factor fold change relative to day 0 from human transcriptomics analyses of subcutaneous adipose tissue during inpatient 10 day fast (n = 7). Differential expression using a linear model the likelihood ratio test against a reduced model that did not include the time factor (∼1) and with Benjamin-Hochberg multiple-test correction. b Two-sided Spearman correlation between TFEC fold change and LIPA fold change data-set in A (n = 7). c Two-sided Spearman correlation between MITF fold change and LIPA fold change data-set in A (n = 7). d Doxycycline-inducible targeting of lipolysis genes in adipocytes derived from human SGBS preadipocytes and subjected to nutrient restriction relative to scramble controls (shSCR). The dark gray bars with associated dashed lines denote non-nutrient restricted controls. One-way ANOVA/Dunnett’s. Each dot indicates the mean of technical replicates from n = 3 independent biological replicate experiments, and expressed as mean, S.D.M. NEFA=non-esterified fatty acids. e LIPA assessed by qPCR for knockdown experiments in F. Significance assessed with Friedman’s/Dunnett’s tests. Each dot indicates the mean of technical replicates from n = 3 independent biological replicate experiments, and expressed as mean, S.D.M. f Human adipose tissue explant culture and lipolytic response to nutrient restriction. Left=glycerol; right=NEFA. Pharmacologic inhibitors were used to assess lysosomal-dependent lipolysis (Bafilomycin, Lalistat2). Each dot indicates the mean of technical replicates from n = 4 independent biological replicate experiments, and expressed as mean, S.D.M. One-way ANOVA/Dunnett’s (glycerol) and Friedman’s/Dunnett’s tests (NEFA). Con=control. g Human adipose tissue explant culture and lipolytic response to in vitro adrenergic stimulus (catecholamines): left=glycerol; right=NEFA. Pharmacologic inhibitors were used to assess lysosomal-dependent lipolysis (Bafilomycin, Lalistat2). Each dot indicates the mean of technical replicates from n = 4 independent biological replicate experiments, and expressed as mean, S.D.M. Friedman’s/Dunnett’s tests. Con=control.
Fig. 6
Fig. 6. Network medicine identifies human fasting module associated with aging genes and diseases of aging.
a Differentially expressed (DE) transcripts from a longitudinal human fasting study were mapped to the consolidated human interactome, which includes >230,000 physical protein-protein interactions (PPIs). DE fasting transcripts formed a statistically distinct subnetwork (module) in the interactome. b Interconnectivity of the fasting genes and aging genes from the Aging Atlas that mapped to the interactome. c Betweenness centrality (BC), a measure of importance in information transfer across a network based on shortest paths was used to identify candidate regulators of the interaction between the fasting and aging phenotypes. This unbiased in silico analysis identified MITF as a critical node. d Network proximity between the fasting module and aging disease modules or cardiometabolic disease modules. The node size is proportional to the number genes/proteins in the module. The width of the edge is proportional to proximity significance.

References

    1. Cahill, G. F. Starvation in man. N. Engl. J. Med282, 668–675 (1970). - PubMed
    1. Stewart, W. K. & Fleming, L. W. Features of a successful therapeutic fast of 382 days’ duration. Postgrad. Med J.49, 203–209 (1973). - PMC - PubMed
    1. Longo, V. D. & Anderson, R. M. Nutrition, longevity and disease: From molecular mechanisms to interventions. Cell185, 1455–1470 (2022). - PMC - PubMed
    1. Perry, R. J. et al. Hepatic acetyl CoA links adipose tissue inflammation to hepatic insulin resistance and type 2 diabetes. Cell160, 745–758 (2015). - PMC - PubMed
    1. Sakers, A., De Siqueira, M. K., Seale, P. & Villanueva, C. J. Adipose-tissue plasticity in health and disease. Cell185, 419–446 (2022). - PMC - PubMed

LinkOut - more resources