. 2025 Feb 3;15(1):4074.
doi: 10.1038/s41598-025-88357-x.

Inhibition of GPR68 induces ferroptosis and radiosensitivity in diverse cancer cell types

Affiliations

Inhibition of GPR68 induces ferroptosis and radiosensitivity in diverse cancer cell types

Leif R Neitzel et al. Sci Rep. .

Abstract

Radioresistance is thought to be a major consequence of tumor milieu acidification resulting from the Warburg effect. Previously, using ogremorphin (OGM), a small molecule inhibitor of GPR68, an extracellular proton sensing receptor, we demonstrated that GPR68 is a key pro-survival pathway in glioblastoma cells. Here, we demonstrate that GPR68 inhibition also induces ferroptosis in lung cell carcinoma (A549) and pancreatic ductal adenocarcinoma (Panc02) cells. Moreover, OGM synergized with ionizing radiation to induce lipid peroxidation, a hallmark of ferroptosis, as well as reduce colony size in 2D and 3D cell culture. GPR68 inhibition is not acutely detrimental but increases intracellular free ferrous iron, which is known to trigger reactive oxygen species (ROS) generation. In summary, GPR68 inhibition induces lipid peroxidation in cancer cells and sensitizes them to ionizing radiation in part through the mobilization of intracellular free ferrous iron. Our results suggest that GPR68 is a key mediator of cancer cell radioresistance activated by acidic tumor microenvironment.


Conflict of interest statement

Declarations. Competing interests: LRN, JC, SR, CHW and CCH are inventors on a patent application related to this manuscript. DTF and CdAF declare no conflicts of interest.

Figures

Fig. 1
Fig. 1
Knock down of GPR68 reduces survival of A549 and Panc02 cells 72-hour cell survival assays. (A) Cotransfection of dCas9 with GPR68 targeting sgRNAs results in decreased A549 survival, transfection of dCas9 alone or sgRNA alone had no impact on A549 survival (B). (C) Cotransfection of dCas9 with GPR68 targeting sgRNAs results in decreased GPR68 expression in A549, transfection of dCas9 or sgRNA alone had no impact on GPR68 expression (D). (E) Cotransfection of dCas9 with GPR68 targeting sgRNAs results in decreased A549 survival, transfection of dCas9 alone or sgRNA alone had no impact on A549 survival (F). (G) Cotransfection of dCas9 with GPR68 targeting sgRNAs results in decreased GPR68 expression in A549, transfection of dCas9 or sgRNA alone had no impact on GPR68 expression (H). (I) siRNA targeting GPR68 results in decreased survival of A549, while non-targeting siRNA had no effect. (J) siRNA knockdown of GPR68 in A549 was verified in qRT-PCR. (K) siRNA targeting GPR68 results in decreased survival of Panc02, while non-targeting siRNA had no effect. (L) siRNA knockdown of GPR68 in Panc02 was verified in qRT-PCR. (C), (D), (J), (L) were normalized to GAPDH. (A)–(L) n = 3 biological repeats with n = 3 technical repeats; mean +/- SD with significance determined by multiple two-tailed, equal variance with Bonferroni Correction. (A)–(H) α-level of 0.001 is ***p < 0.00033. (I)–(L) α-level of 0.01 is **p < 0.0025, 0.001 is ***p < 0.00025.
Fig. 2
Fig. 2
GPR68 inhibition reduces cellular survival. (A) and (B) OGM inhibits clonogenic growth at a dose of 1 μm and higher in a 6-day clonogenic assay for both A549 and Panc02 cells. (C) and (D) Quantification of colony size in the clonogenic assay using low doses of OGM show decreased colony sizes for both A549 and Panc02 cells. (A)–(D) mean +/- SD; n ≥ 3 biological repeats with Bonferroni Correction and an α-level of 0.001 is ***p < 0.0002.
Fig. 3
Fig. 3
Inhibition of GPR68 increases adenocarcinoma radiosensitivity. Clonogenicity assays of cells irradiated with 2 or 4 Gy and treated with OGM 100 min later. (A) A549 cells showed a significant decrease in colony size when treated with 0.7 μm OGM after irradiation with 2 Gy. (B) At 4 Gy treatment with both 0.7 μm and 0.8 μm OGM significantly decreased colony size in A549 cells. (C) and (D) At both 2 and 4 Gy, the 0.7 μm OGM treatment significantly decreased colony size in Panc02 cells. OGM treatment groups were compared to their corresponding unirradiated controls. (A)–(D) mean +/- SD; n ≥ 3 biological repeats and an α-level of 0.001 is ***p < 0.001.
Fig. 4
Fig. 4
GPR68 inhibition synergizes with radiation (A) and (B) flow-cytometry of A549 shows cells exposed to OGM and radiation have elevated lipid peroxidation compared to OGM or radiation alone. (C) statistical analysis of curves in (A) and (B). (D)–(F) flow-cytometry of Panc02 shows cells exposed to OGM and radiation have elevated lipid peroxidation compared to OGM or radiation alone, with statistics. (C) and (D) CDI < < 1 indicates the combinatorial effect is synergistic, not additive. (G) Cell cycle analysis of OGM treatment and Irradiated Panc02 cells. (H) Quantification of % change in G2 phase fraction from (G) shows synergy between OGM and 3 Gy radiation. (A)–(H) n = 3 biological repeats with n = 10,000 events. (C) and (F) α-level of 0.001 is ***p < 0.00017.
Fig. 5
Fig. 5
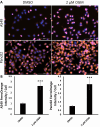
Inhibition of GPR68 promotes intracellular Fe2+ levels. (A) FerroOrange staining of A549 and Panc02 cells treated with DMSO or 2 µM OGM for 24 h. (B) Quantification of FerroOrange staining in A549 and Panc02 cells demonstrating an increase in intracellular Fe2+ levels. (B) n = 3 biological repeats with n = 6 technical repeats. (B) mean +/- SD with significance determined by multiple two-tailed, equal variance with an α-level of 0.001 is ***p < 0.001.
Fig. 6
Fig. 6
4 Gy of radiation synergizes with 0.7 µM OGM in 3D spheroids. (A) Treatment of A549 and Panc02 spheroids with OGM or radiation decreased the size (left) and cell survival (right). Co-treatment significantly decreased the size and cell survival in the spheroids in comparison to both OGM and radiation treatments alone. (B) Representative images of OGM, radiation, and OGM + radiation treated spheroids. n = 3 biological repeats with n = 4 technical repeats. (A) mean +/- SD with significance determined by multiple two-tailed, equal variance with an α-level of 0.05 is *p < 0.0125, 0.01 is **p < 0.0025 and 0.001 is ***p < 0.00025.

References

    1. Lewanski, C. R. & Gullick, W. J. Radiotherapy and cellular signalling. Lancet Oncol.2, 366–370. 10.1016/S1470-2045(00)00391-0 (2001). - PubMed
    1. Hunter, A., Hendrikse, A., Renan, M. & Abratt, R. Does the tumor microenvironment influence radiation-induced apoptosis? Apoptosis. 11, 1727–1735. 10.1007/s10495-006-9789-1 (2006). - PubMed
    1. Röttinger, E. M. & Mendonca, M. Radioresistance secondary to low pH in human glial cells and Chinese hamster ovary cells. Int. J. Radiat. Oncol. Biol. Phys.8, 1309–1314. 10.1016/0360-3016(82)90580-6 (1982). - PubMed
    1. Bailey, K. M., Wojtkowiak, J. W., Hashim, A. I. & Gillies, R. J. Targeting the metabolic microenvironment of tumors. Adv. Pharmacol.65, 63–107. 10.1016/B978-0-12-397927-8.00004-X (2012). - PMC - PubMed
    1. Ibrahim-Hashim, A. & Estrella, V. Acidosis and cancer: from mechanism to neutralization. Cancer Metastasis Rev.38, 149–155. 10.1007/s10555-019-09787-4 (2019). - PMC - PubMed

MeSH terms

LinkOut - more resources