. 2025 Mar;57(3):647-658.
doi: 10.1038/s41588-025-02080-x. Epub 2025 Feb 3.

Spatial transcriptomics identifies molecular niche dysregulation associated with distal lung remodeling in pulmonary fibrosis

Affiliations

Spatial transcriptomics identifies molecular niche dysregulation associated with distal lung remodeling in pulmonary fibrosis

Annika Vannan et al. Nat Genet. 2025 Mar.

Abstract

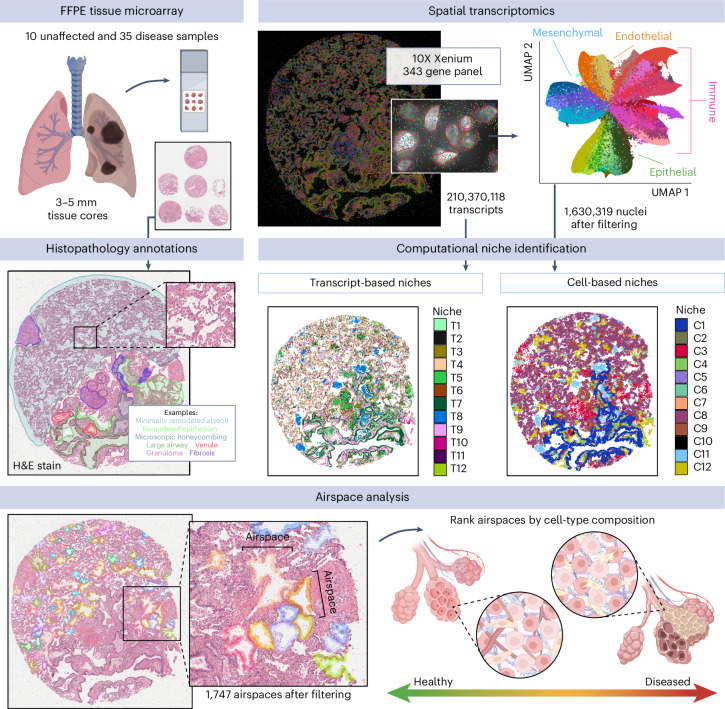
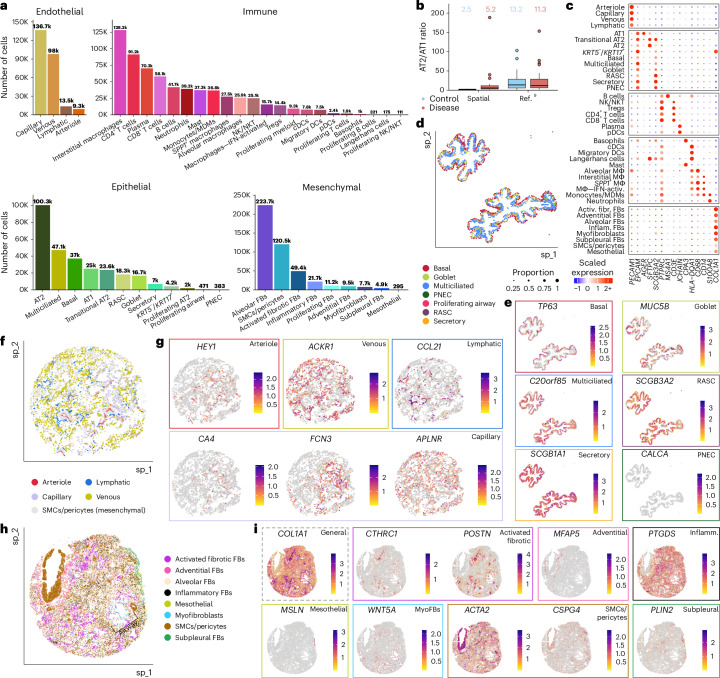
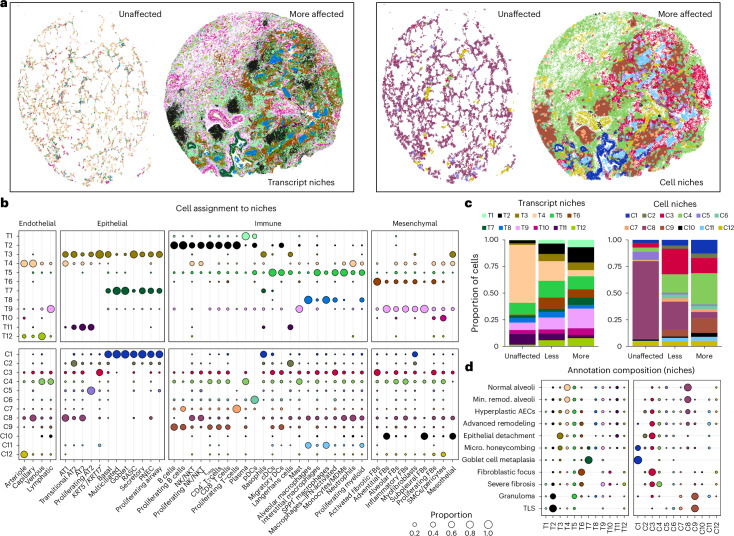
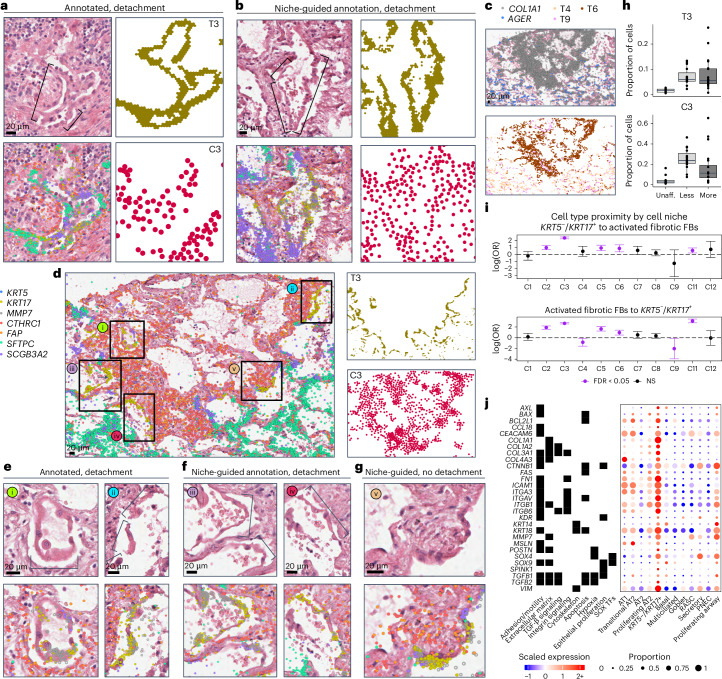
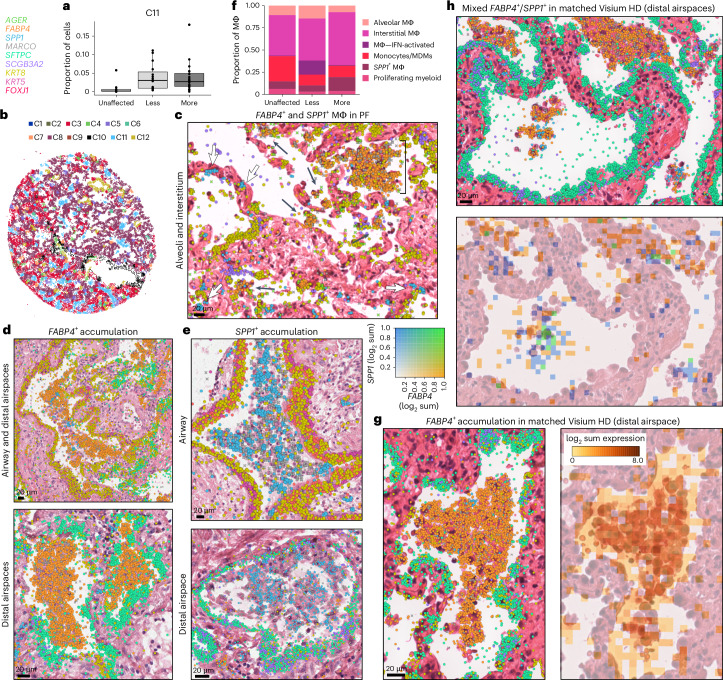
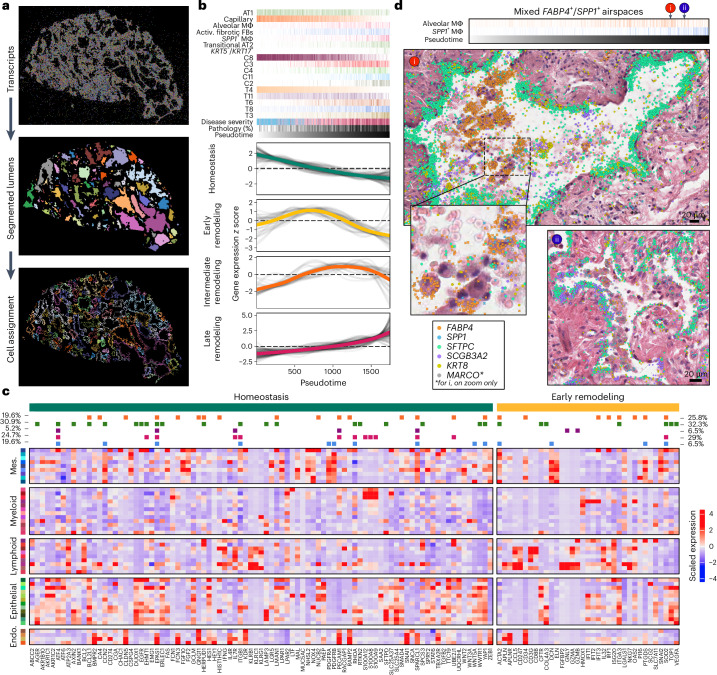
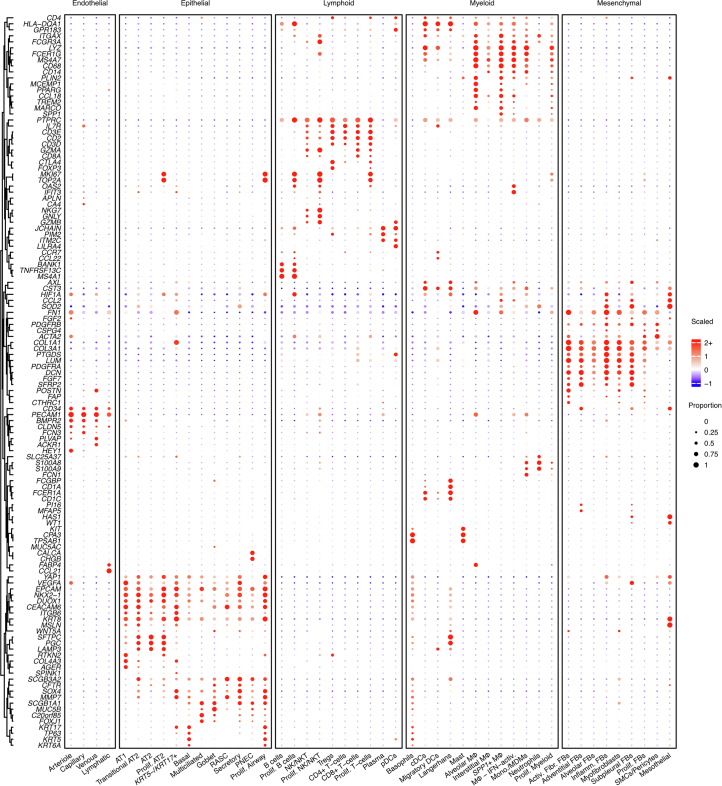
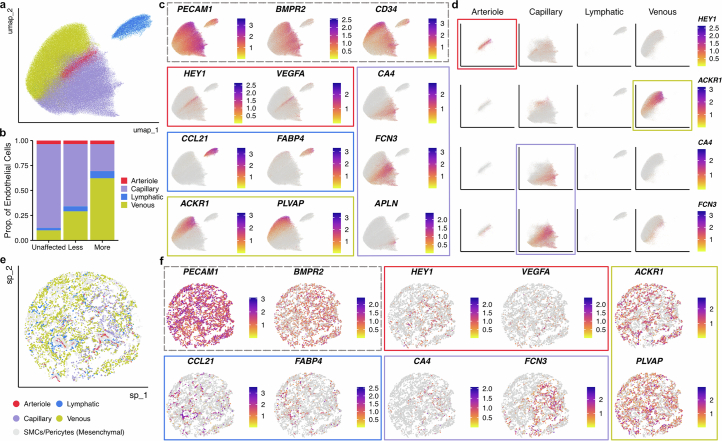
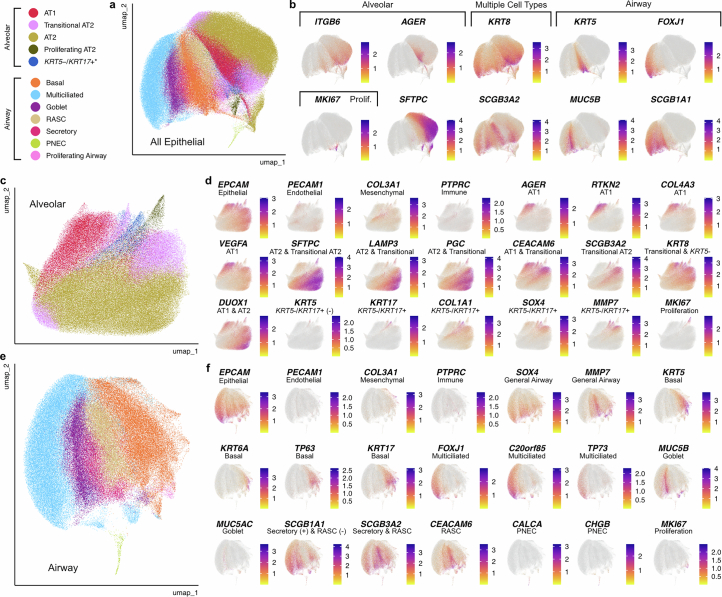
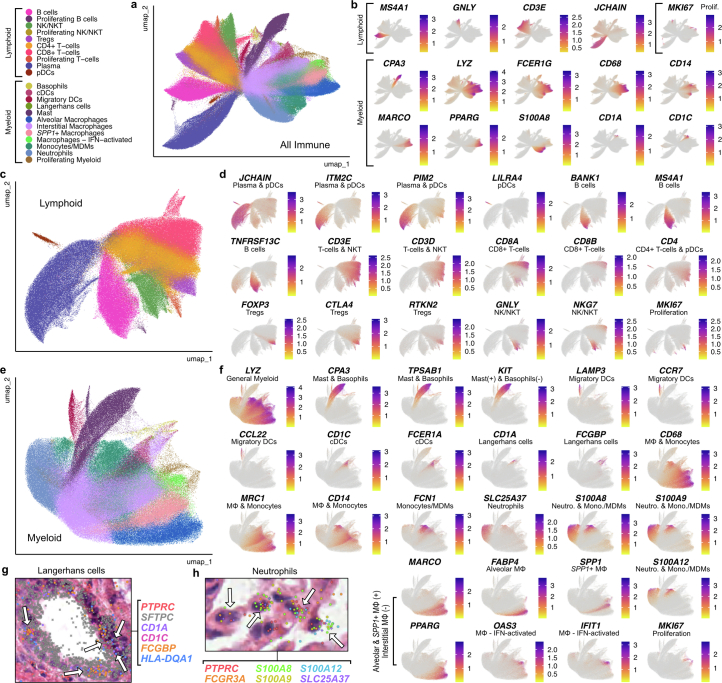
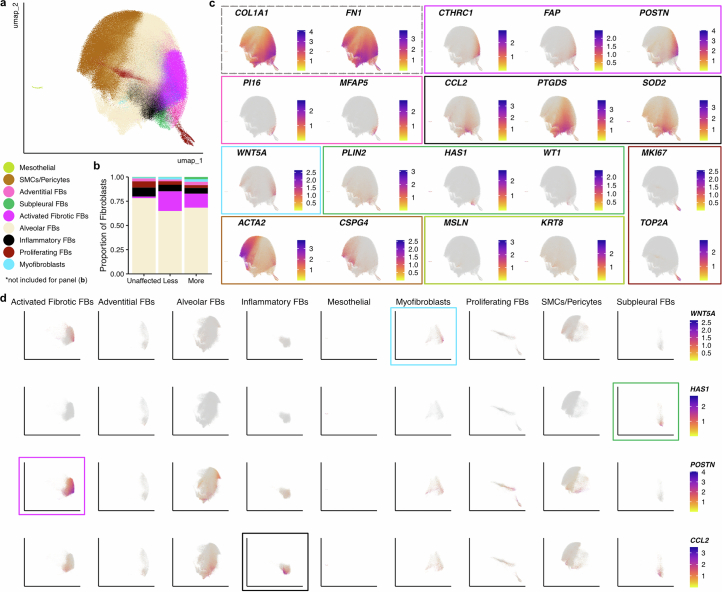
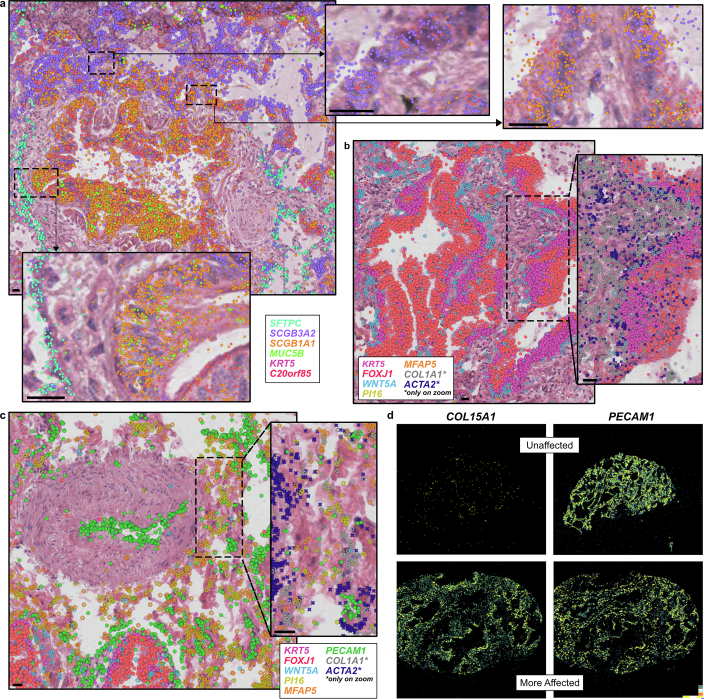
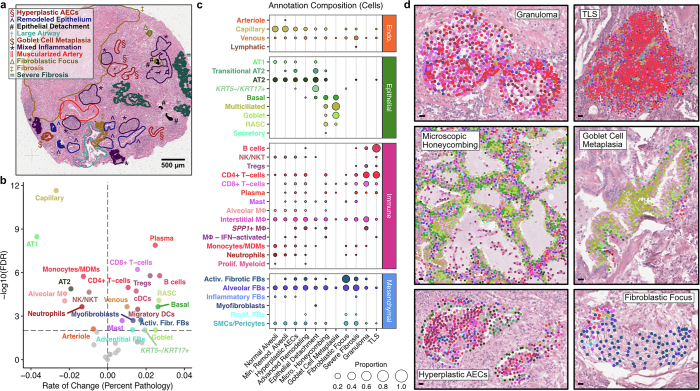
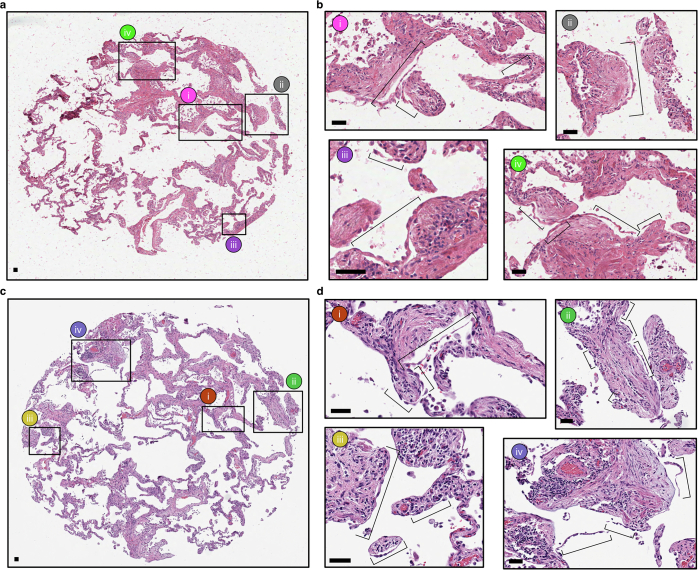
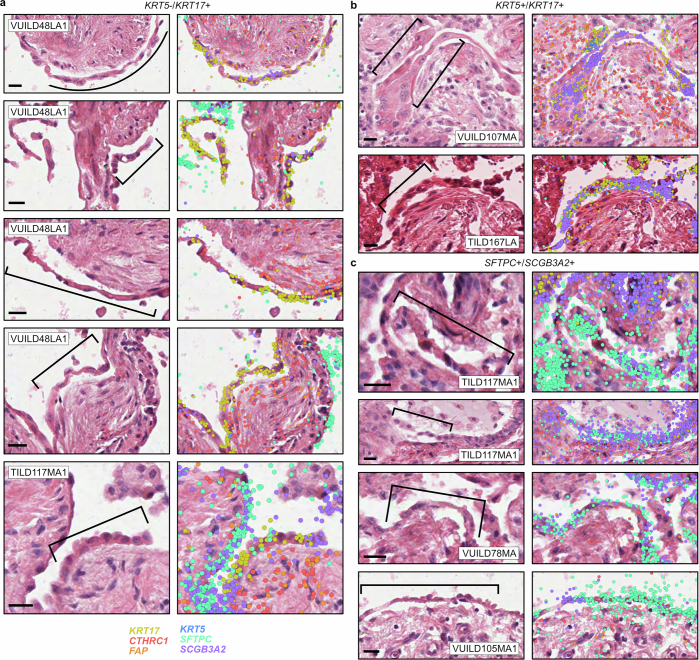
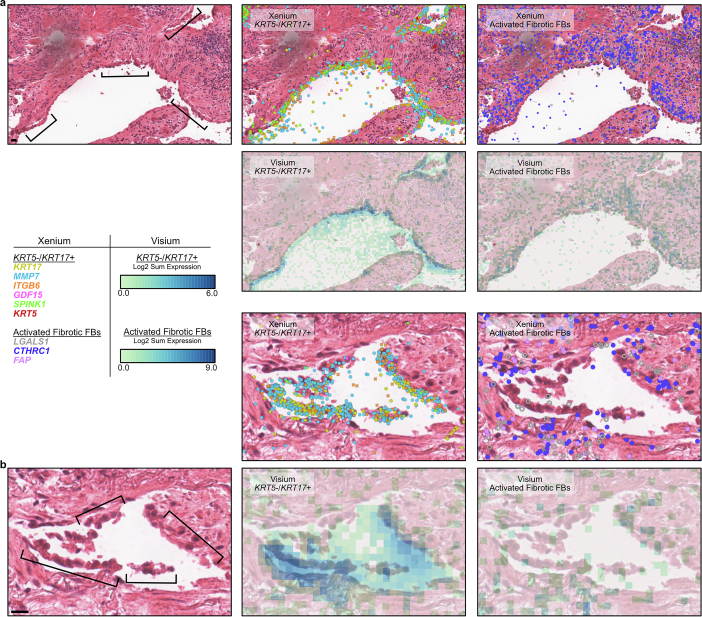
Large-scale changes in the structure and cellular makeup of the distal lung are a hallmark of pulmonary fibrosis (PF), but the spatial contexts that contribute to disease pathogenesis have remained uncertain. Using image-based spatial transcriptomics, we analyzed the gene expression of 1.6 million cells from 35 unique lungs. Through complementary cell-based and innovative cell-agnostic analyses, we characterized the localization of PF-emergent cell types, established the cellular and molecular basis of classical PF histopathologic features and identified a diversity of distinct molecularly defined spatial niches in control and PF lungs. Using machine learning and trajectory analysis to segment and rank airspaces on a gradient of remodeling severity, we identified compositional and molecular changes associated with progressive distal lung pathology, beginning with alveolar epithelial dysregulation and culminating with changes in macrophage polarization. Together, these results provide a unique, spatially resolved view of PF and establish methods that could be applied to other spatial transcriptomic studies.


Conflict of interest statement

Competing interests: J.A.K. reports grants/contracts from Boehringer Ingelheim and Bristol Myers Squibb, stock options from APIE Therapeutics and consulting fees from ARDA Therapeutics. R.W. reports consultant fees from Genentech and Boehringer Ingelheim. T.S.B. reports grants/contracts from Boehringer Ingelheim, Bristol Myers Squibb and Morphic. The other authors declare no competing interests.

Figures

Fig. 1
Fig. 1. Outline of spatial transcriptomics processing and analysis pipeline.
In total, 45 lung tissue cores (3–5 mm) from unaffected and PF donors were processed on the Xenium Analyzer instrument on a combination of four TMAs of three to nine samples each and one additional replicate TMA with 17 additional samples and the inclusion of cell-bound stains. We quantified the expression of 343 genes at subcellular resolution using a custom panel. After filtering, we retained 299,018,086 high-quality transcripts for identifying transcript niches with GraphSAGE across all five TMAs. Of these, 210,370,118 transcripts on the original TMAs 1–4 were used to build the initial GraphSAGE model. After additional filtering, we annotated cell types for 1,630,319 segmented nuclei across the endothelial, epithelial, immune and mesenchymal lineages. An example sample shown is VUILD96LA (sarcoidosis diagnosis). The figure was created with BioRender.com.
Fig. 2
Fig. 2. Cell-type composition of unaffected and PF lung tissue determined using marker gene expression and spatial information.
a, Frequency of each cell type found across all samples. b, Ratio of AT2 versus AT1 cell counts across samples compared between the present spatial dataset and a recent scRNA-seq dataset. Outlier samples are shown as individual points. Samples without counts for both AT1 and AT2 cells were not included in the analysis. Mean ratios across all samples are listed above. Boxplots show the median, with box hinges extending to the first and third quartiles and the whiskers extending to the largest (upper whisker) or smallest (lower whisker) value with a maximum of 1.5× IQR above and below. Sample sizes—spatial control, n = 10; disease, n = 34; ref. control, n = 16 and disease, n = 22. c, Dotplot heatmap showing select genes used to annotate cell types in the dataset. See Extended Data Fig. 1 for the expanded version with additional genes. d,e, Example airways (TILD299MA; IPF) showing epithelial cells (d) and select marker genes (e). Basal cells reside on the outer edge of the airways, while other airway cell types, particularly multiciliated cells, are oriented toward the inner lumen. f,g, Alveolar cell types (f) and marker gene expression (g) in a selection of alveoli (VUHD113; unaffected). h,i, Mesenchymal cells (f) and marker gene expression (g); VUILD106MA; IPF) proliferating fibroblasts omitted for clarity. An airway surrounded by myofibroblasts is marked by brackets. e,g,i, Boxes around plots are colored by the cell type they mark as indicated in d,f,h. The gray-dashed box for COL1A1 (i) indicates this gene is a general fibroblast marker. Activ., activated; cDCs, classical dendritic cells; DCs, dendritic cells; FBs, fibroblasts; Fibr., fibrotic; IFN, interferon; Inflam., inflammatory; MΦ, macrophages; MDMs, monocyte-derived macrophages; NK, natural killer; NKT, natural killer T cells; pDCs, plasmacytoid dendritic cells; PNEC, pulmonary neuroendocrine cell; SMCs, smooth muscle cells; Tregs, regulatory T cells; IQR, interquartile range.
Fig. 3
Fig. 3. Complementary spatial niche analyses provide comprehensive annotation of tissue remodeling in PF.
a, Representative examples from both unaffected and PF samples showing transcript- (left) and cell-based niches (right). VUHD113 and VUILD107MA (IPF diagnosis) are shown. For transcript niches, hexbin plots are shown (Methods). For cell niches, each point is a cell centroid. b, Cell assignment to transcript- (top) and cell-based niches (bottom), as a proportion of the number of cells of each type (each column sums to 1; columns indicated by gray lines). c, Bar plots depicting the total proportion of cells across the unaffected, less affected and more affected sample types assigned to each transcript and cell niche. d, The niche composition of select annotations, as a proportion of the number of cells across an annotation (each row sums to 1; rows indicated by gray lines). For b and d, proportions under 0.01 are not shown, and the proportion legend applies to both panels. See Supplementary Fig. 17b for expanded version (d) with all annotations listed. Different colors in c indicate niche colors for all panels. Micro., microscopic; Min., minimally.
Fig. 4
Fig. 4. KRT5/KRT17+ cells detach at sites of active fibrosis identified by spatial niches.
a,b, H&Es of epithelial detachment (brackets) directly annotated by a clinician (a) and not annotated (b), overlaying transcript expression of listed genes (colors shown left of d) and compared with the T3 (green) and C3 (red) niches. c, In one sample, we observed a dense fibrotic region marked by fibrotic niches (T6/T9; brown/pink) and COL1A1 expression (gray) lined with epithelial detachment marked by T3/C3 adjacent to normal alveolar niches (T4/C8; light beige/latter not shown) expressing AT1 marker AGER (light blue). d, The same area is depicted, with expression is shown for the same genes as a,b,eg, except for MMP7, which is omitted for clarity. eg, This region contained two sites of epithelial detachment originally annotated by the clinician (e), additional examples of detaching KRT5/KRT17+ and transitional epithelial cells (f) and an instance of nondetaching KRT5/KRT17+ cells flanked by activated fibrotic fibroblasts (g). Scale bars = 20 µm. Samples—(a) VUILD107MA, (b) VUILD91MA and (cg) VUILD91LA, all IPF-diagnosed. h, Proportion of cells assigned to the T3 and C3 niches for each sample, split by disease state—unaffected, less affected and more affected (n = 10, n = 15 and n = 20, respectively). Boxplots show the median, hinges extend to first/third quartiles and whiskers extend to the largest/smallest (upper/lower) value to a maximum of 1.5× IQR. Outliers are shown as individual points. i, Proximity of KRT5/KRT17+ cells and activated fibrotic fibroblasts for each cell niche (n = 6–29,535 per cell type per niche). log OR and error bars (5–95% confidence interval) indicate the likelihood that a KRT5/KRT17+ cell’s single nearest neighbor was an activated fibroblast (top) or vice versa (bottom). Significant (false discovery rate (FDR) < 0.05, purple) results above or below 0 (dashes) indicate increased or decreased likelihood for the cell types to be in close proximity within a niche. j, Heatmap of selected differentially expressed genes for KRT5/KRT17+ cells versus all other epithelial cell types. Genes belonging to a specific GO term or PANTHER category are marked (full groupings are provided in Supplementary Table 12). OR, odds ratio.
Fig. 5
Fig. 5. FABP4+ and SPP1+ macrophages accumulate in PF airspaces and are characterized by a spatial niche.
a, Boxplot showing the proportion of cells assigned to the C11 niche across disease severity, including unaffected (n = 10), less affected (n = 15) and more affected (n = 20) samples. b, Representative example of cell niches, including the C11 macrophage accumulation niche (light blue) in sample VUILD102LA (IPF). c, FABP4+ and SPP1+ macrophages in minimally remodeled alveoli, including FABP4+ macrophages accumulated within an alveolus (denoted by a square bracket). Instances of individual FABP4+ macrophages that have migrated into alveolar lumens and small FABP4+ accumulations (black arrows) and SPP1+ macrophages in the interstitium (white arrows) are marked noncomprehensively. d,e, H&E images of FABP4+ (d) and SPP1+ (e) macrophage accumulations within airways and substantially remodeled distal airspaces overlain with transcript expression for listed genes. f, Distribution of macrophage subtypes as a proportion of the total population of macrophages across disease severity. g,h, Matched Xenium and Visium HD images of FABP4+ (g) and mixed FABP4+/SPP1+ (h) macrophage accumulations within distal airspaces. For g, the Visium HD image (right) shows the sum of the log2 expression of a list of genes marking alveolar macrophages as a density map overlain on the H&E. In h, the sum log2 expression of a list of genes marking alveolar macrophages is compared to a list marking SPP1+ macrophages. Genes that were strong markers for both alveolar and SPP1+ macrophages were not included in h. See Methods for the gene selection process and Supplementary Table 10 for a list of marker genes. For ce,g,h Xenium images, all listed genes are potentially visible in each example image if expressed, except SCGB3A2, which for clarity is not shown on the two figures that include airways, and AGER, which is only shown in d. Scale bars on the bottom left of each H&E = 20 µm. c, Sample TILD130LA (IPF); d, examples from VUILD91MA (top; IPF) and VUILD96LA (bottom; sarcoidosis); e, samples VUILD78MA (top; IPAF) and VUILD96MA (bottom; sarcoidosis) and g,h, sample VUILD49LA (cHP).
Fig. 6
Fig. 6. Alveolar remodeling at airspace resolution.
a, Representation of lumen segmentation pipeline. b, Heatmap of predicted expression of each gene that was significantly associated with pseudotime. The top annotation shows select cell types, cell niches and transcript niches that were associated with pseudotime, with the darkest shade of each color representing the maximum proportion of that cell type or niche found across all airspaces. Disease severity is split into unaffected (blue), less affected (pink) and more affected (red). c, Scaled expression across cell types for the 124 genes with altered expression in the homeostatic (89 genes) or early remodeling stages (35 genes) from b, using only cells that were contained within one of the 1,747 airspaces. Cell-type colors are by lineage as in Fig. 2. On the top, boxes are filled in for each gene if it showed a significant change in expression in at least one cell type across the pseudotime of each of the following lineages: endothelial (orange), epithelial (green), lymphoid (purple), myeloid (pink) and mesenchymal (blue). Percentages were calculated as the number of significant tests (FDR < 0.05) in either the homeostasis (green, left) or early remodeling (yellow, right) stages that occurred across the pseudotime in all cell types of each lineage divided by the total number of significant tests for that stage of alveolar remodeling. On the y axes, z score of 0 has been marked on each plot with a dashed line. d, H&E images of mixed alveolar (FABP4+) and SPP1+ macrophage accumulations in two alveoli ranked near the end of the pseudotime trajectory, overlaid with transcript expression for all listed genes. Above the H&Es, each alveolus is marked by its position in pseudotime, and the proportion of alveolar and SPP1+ macrophages is shown for each airspace across pseudotime as in b. The example alveoli shown are VUILD115MA_90 (cHP diagnosis; top) and VUILD78MA_27 (IPAF, bottom). Scale bars on the bottom right of each H&E = 20 µm.
Extended Data Fig. 1
Extended Data Fig. 1. Marker genes for all cell types.
Of the 343 genes, 122 select genes are shown here to demonstrate cell-type annotation of the 47 identified cell types.
Extended Data Fig. 2
Extended Data Fig. 2. Cell-type annotation for the endothelial lineage using UMAP plots and spatial data.
a, Lineage-level UMAP for endothelial cells generated after final cell-type annotation. Cell types are colored based on the legend in b. b, Proportion of the total number of endothelial cells by disease state (unaffected, less affected or more affected). Capillary cells are the majority endothelial cell type in unaffected samples, but capillary cells are lost in PF. c,d, Select cell-type gene markers visualized in UMAP space across all endothelial cells (c) and split by cell type (d). e, An example spatial plot of sample VUILD107MF (IPF diagnosis). Each point represents a cell, colored by cell type. Smooth muscle cells (SMCs)/pericytes of the mesenchymal lineage are included to provide additional spatial context for the location of endothelial cells. f, Plots of the same sample showing expression of select endothelial cell marker genes. Only endothelial cells are included in these plots. For d and f, boxes indicate the cell type of the gene marks. Gray-dashed lines indicate general endothelial lineage markers.
Extended Data Fig. 3
Extended Data Fig. 3. Cell-type annotation for the epithelial lineage using UMAP plots.
a, Lineage-level UMAP for epithelial cells generated after final cell-type annotation. b, Select cell-type gene markers visualized in UMAP space across epithelial cells. c,e, UMAPs were additionally visualized for alveolar (c) and airway cell types (e) separately. Please note that KRT5/KRT17+ cells were arbitrarily grouped with alveolar cell types, although they are found in PF in both remodeled airways and alveoli. d,f, Specific gene markers for alveolar (d) and airway cell types (f) visualized in UMAP space. For b, d and f, the specific cell types or groups of cells marked by each gene are listed near the gene name. ‘Transitional’ refers to general transitional epithelial marker genes, except where noted as a specific marker for only the transitional AT2 cell type.
Extended Data Fig. 4
Extended Data Fig. 4. Cell-type annotation for the immune lineage using UMAP plots and spatial data.
a, Lineage-level UMAP for immune cells generated after final cell-type annotation. b, Select cell-type gene markers visualized in UMAP space across immune cells. c,e, UMAPs were additionally visualized for lymphoid (c) and myeloid cell types (e) separately. d,f, Specific gene markers for lymphoid (d) and myeloid cell types (f) visualized in UMAP space. For b, d and f, the specific cell types or groups of cells marked by each gene are listed near the gene name. g,h, Individual examples of Langerhans cells (g) and neutrophils (h) indicated by white arrows with individual transcripts overlain onto H&E tissue stains. g, Langerhans cells in sample TILD117MA1 (IPF diagnosis) expressing immune marker PTPRC, dendritic cell markers CD1C and HLA-DQA1, and specific Langerhans cell markers CD1A and FCGBP in a remodeled airspace marked by SFTPC. h, Neutrophils in unaffected sample VUHD116B expressing general myeloid/monocytic markers FCGR3A, S100A8, S100A9 and S100A12 in addition to specific neutrophil marker SLC25A37. See Extended Data Fig. 1 for a dotplot heatmap showing expression of marker genes in each cell type.
Extended Data Fig. 5
Extended Data Fig. 5. Cell-type annotation for the mesenchymal lineage using UMAP plots.
a, Lineage-level UMAP for mesenchymal cells generated after final cell-type annotation. b, Proportion of the total number of mesenchymal cells by disease state (unaffected, less affected or more affected). Alveolar fibroblast cells are the majority mesenchymal cell type across all groups, although the proportion of disease-associated, activated fibrotic fibroblasts increases in PF. c,d, Select cell-type gene markers visualized in UMAP space across all mesenchymal cells (c) and split by cell type (d). For c and d, boxes indicate the cell type the gene marks. Gray-dashed lines indicate general mesenchymal lineage markers.
Extended Data Fig. 6
Extended Data Fig. 6. Localization of key cell types.
ac, Representative examples of (a) pathologic SCGB3A2+/SCGB1A1 airways near airways with mixed populations of SCGB3A2/SCGB1A1+ and SCGB3A2+/SCGB1A1+ (RASC) dual-positive cells and SCGB3A+/SFTPC+ (transitional AT2) cells in remodeled alveoli; (b,c) WNT5A+ myofibroblasts surrounding conducting airways; (c) PI1+/MFAP5+ adventitial fibroblasts near vasculature. Transcript expression is overlain on H&E images. d, Density plots showing expression of disease-enriched endothelial marker COL15A1 and pan-endothelial marker PECAM1 in representative unaffected and PF samples. Samples depicted are as follows: (a) VUILD78MA (IPAF diagnosis), (bd) TILD175MA (IPF) and (d) VUHD095 (unaffected). Scale bars represent 20 µm.
Extended Data Fig. 7
Extended Data Fig. 7. The molecular and cellular basis of clinically relevant PF histopathologies.
a, Each sample was assigned a pathology score based on a semiquantitative scale assessing the number/severity of pathologic features. Here we show a representative sample (VUILD107MA; IPF diagnosis) with annotated features. Features are represented by colors and symbols as shown: §, hyperplastic airway epithelial cells (AECs); ^, remodeled epithelium; #, epithelial detachment; †, large airway; $, goblet cell metaplasia; *, mixed inflammation; ‖, muscularized artery; Δ, fibroblastic focus; ‡, fibrosis; =, severe fibrosis. b, Cell types significantly associated with pathology score are labeled in the volcano plot. The horizontal and vertical dashed lines show the significance threshold (FDR < 0.01) and split the plot into cell types negatively and positively associated with pathology score, respectively. Cell types on the right are present in higher proportions in samples with high pathology scores. c, The cell-type composition of select annotations of interest, as a proportion of the number of cells across an annotation (each column sums to 1; columns indicated by gray lines). See Supplementary Fig. 17a for an expanded version of this plot with all cell types and annotations. d, Examples of select annotations on semi-transparent H&E images overlain with cell types in the annotated region. Each point represents a cell centroid. Cell-type colors are matched to b. Scale bars represent 20 µm. Example annotations were taken from the following samples: granuloma—VUILD96MA (sarcoidosis); tertiary lymphoid structure (TLS)—VUILD110LA (CTD-ILD); microscopic honeycombing (partial)—VUILD78MA (IPAF); goblet cell metaplasia—VUILD104MA2 (IPF); hyperplastic AECs—VUILD107MA (IPF); fibroblastic focus—VUILD104MA1 (IPF).
Extended Data Fig. 8
Extended Data Fig. 8. Epithelial detachment on a serial section that did not undergo Xenium processing.
To verify that the epithelial detachment feature was not an artifact of Xenium processing, we took serial sections approximately 45 µm from the processed tissue section. H&E stains, shown here for sample VUILD48LA (NSIP diagnosis), show areas of epithelial detachment are present on both the original section (a,b) and the section that did not undergo Xenium processing (c,d). b and d show the areas marked with boxes in a and c, respectively. Brackets denote epithelial detachment. Scale bars represent 50 µm.
Extended Data Fig. 9
Extended Data Fig. 9. Additional examples of epithelial detachment.
The majority of epithelial detachment annotations contained KRT5/KRT17+ cells (a), basal (KRT5+/KRT17+) cells (b) and AT2-like (SFTPC+/SCGB3A2+) cells (c). A select set of examples are shown for these groups. For each example, an H&E stain is shown with brackets denoting areas of epithelial detachment, side-by-side with transcript expression for the listed genes overlain on H&E images. Scale bars in the bottom left of each H&E image represent 20 µm. Sample names for the depicted annotations are noted on each H&E.
Extended Data Fig. 10
Extended Data Fig. 10. KRT5/KRT17+ cell detachment in matched Xenium and Visium HD data.
a,b, Examples of KRT5/KRT17+ cells detaching from the basement membrane are shown for two samples (a, VUILD49LA—cHP diagnosis; b, TILD113LA—IPF) that were processed with both Xenium and Visium HD. For each panel, an H&E stain is shown with brackets denoting areas of epithelial detachment. Scale bars represent 20 µm. For Xenium images (top), select transcripts are shown to mark KRT5/KRT17+ cells (left) and activated fibrotic fibroblasts (right). Each transcript is a point or other shape, colored by gene as listed in the legend. For Visium HD images (bottom), the sum of the log2 expression of a list of genes (Supplementary Table 11) is shown as a density map overlain on the H&E.

Update of

Similar articles

Cited by

References

    1. Adegunsoye, A. et al. Genetics and genomics of pulmonary fibrosis: charting the molecular landscape and shaping precision medicine. Am. J. Respir. Crit. Care Med.210, 401–423 (2024). - PMC - PubMed
    1. Richeldi, L. et al. Efficacy and safety of nintedanib in idiopathic pulmonary fibrosis. N. Engl. J. Med.370, 2071–2082 (2014). - PubMed
    1. King, T. E. Jr. et al. A phase 3 trial of pirfenidone in patients with idiopathic pulmonary fibrosis. N. Engl. J. Med.370, 2083–2092 (2014). - PubMed
    1. Simon, M., Potchen, E. J. & LeMay, M. (eds). Frontiers of Pulmonary Radiology pp. 102–141 (Grune & Stratton, 1969).
    1. Travis, W. D. et al. An official American Thoracic Society/European Respiratory Society statement: update of the international multidisciplinary classification of the idiopathic interstitial pneumonias. Am. J. Respir. Crit. Care Med.188, 733–748 (2013). - PMC - PubMed

LinkOut - more resources