. 2025 Feb;57(2):441-450.
doi: 10.1038/s41588-024-02069-y. Epub 2025 Feb 3.

A barley pan-transcriptome reveals layers of genotype-dependent transcriptional complexity

Affiliations

A barley pan-transcriptome reveals layers of genotype-dependent transcriptional complexity

Wenbin Guo et al. Nat Genet. 2025 Feb.

Abstract

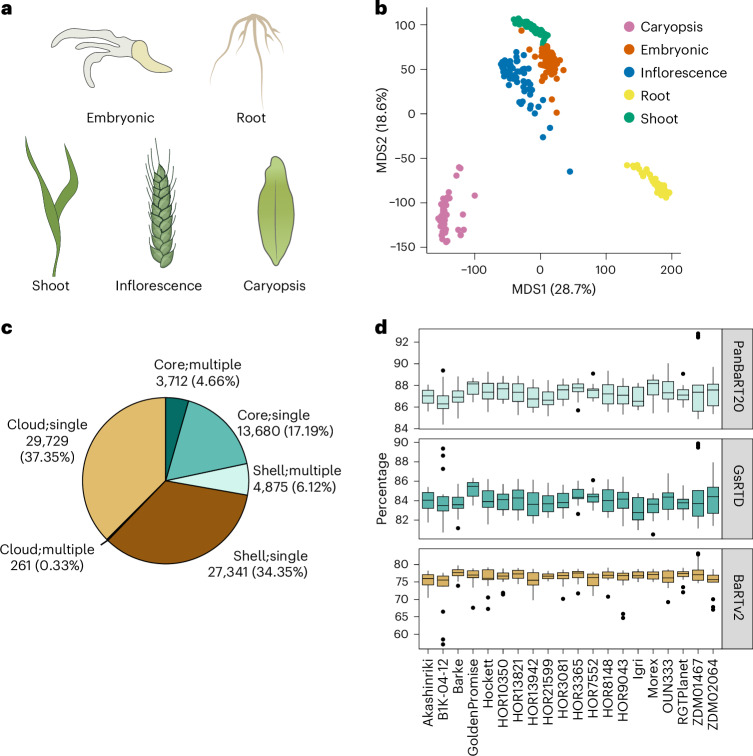
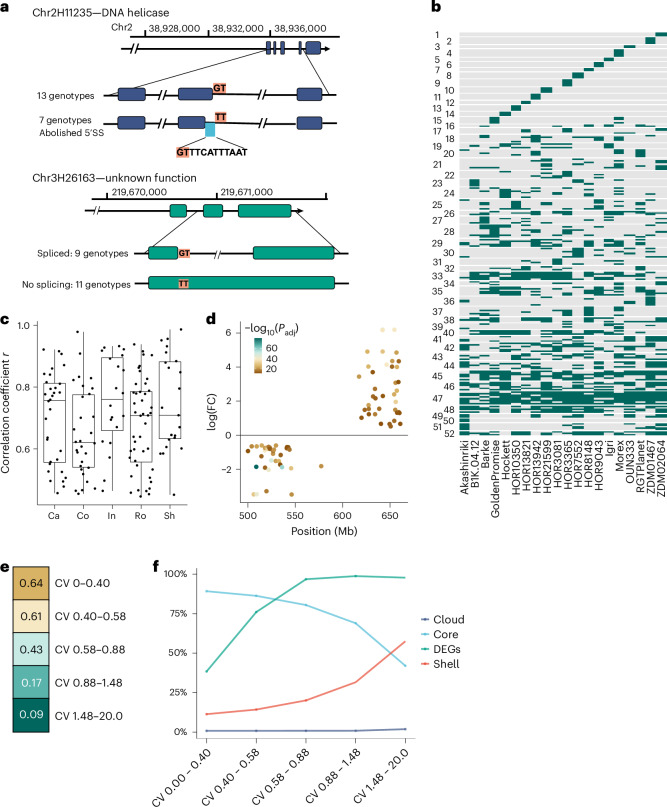
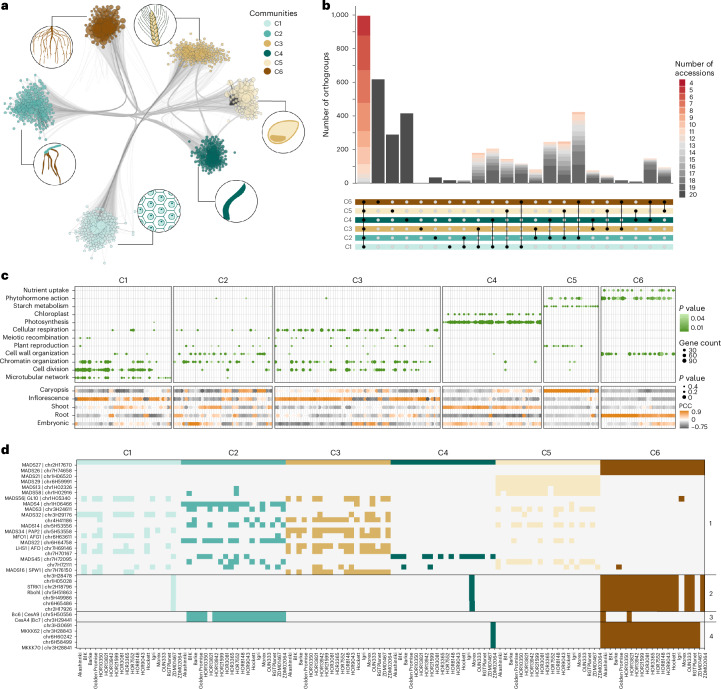
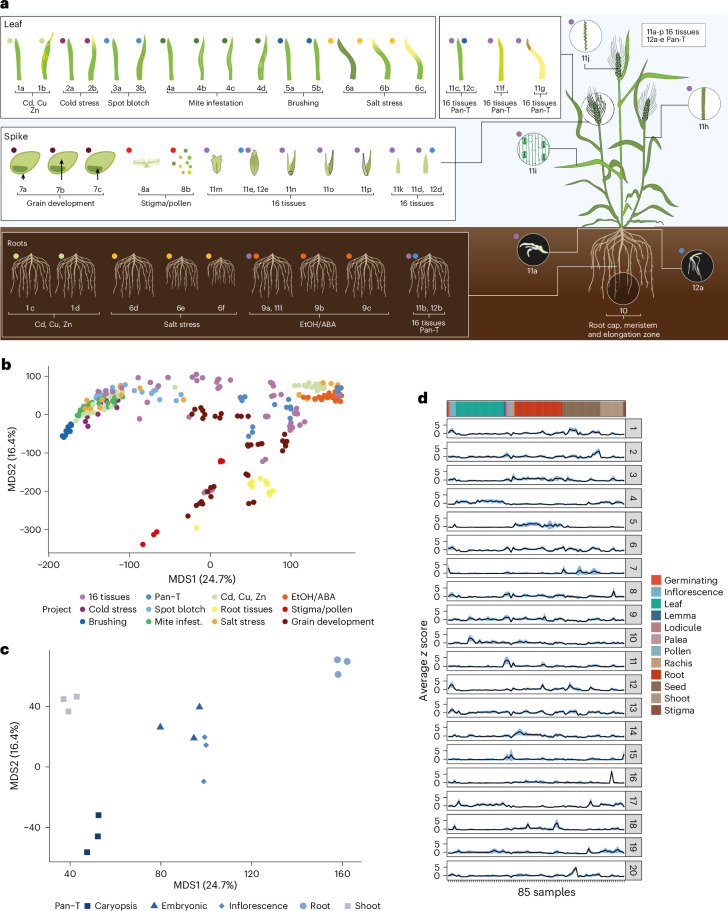
A pan-transcriptome describes the transcriptional and post-transcriptional consequences of genome diversity from multiple individuals within a species. We developed a barley pan-transcriptome using 20 inbred genotypes representing domesticated barley diversity by generating and analyzing short- and long-read RNA-sequencing datasets from multiple tissues. To overcome single reference bias in transcript quantification, we constructed genotype-specific reference transcript datasets (RTDs) and integrated these into a linear pan-genome framework to create a pan-RTD, allowing transcript categorization as core, shell or cloud. Focusing on the core (expressed in all genotypes), we observed significant transcript abundance variation among tissues and between genotypes driven partly by RNA processing, gene copy number, structural rearrangements and conservation of promotor motifs. Network analyses revealed conserved co-expression module::tissue correlations and frequent functional diversification. To complement the pan-transcriptome, we constructed a comprehensive cultivar (cv.) Morex gene-expression atlas and illustrate how these combined datasets can be used to guide biological inquiry.


Conflict of interest statement

Competing interests: K.B.B., C.D., G.B.F., M.E.J., Q.L., M.T.S.N., P.R.P., M.W.R., B.S., N.W.T. and C.V. are employees of the Carlsberg Research Laboratory. The other authors declare no competing interests.

Figures

Fig. 1
Fig. 1. Transcript diversity and classification.
a, Five tissues sampled (clockwise from top left) are as follows: embryo, mesocotyl and seminal roots (from here referred to as ‘embryonic’ tissue), seedling root, caryopsis, developing inflorescence and seedling shoot. b, An MDS plot of the overall transcript abundance data. Different colors represent different tissues as indicated. c, The percentage of different gene classifications (core, shell and cloud genes with single or multiple copies) in PanBaRT20. d, Average mapping rates of 14 (HOR8148) and 15 (remaining genotypes) samples for the RNA-seq data from different cultivars to the three transcriptomes (PanBaRT20, respective GsRTDs and BaRTv2). The lines within the boxes display the median, with the box bounds representing the 25th and 75th percentiles. The whiskers extend to the minimum and maximum values within the 1.5× interquartile range. Data points outside this range are outliers.
Fig. 2
Fig. 2. Drivers of transcript abundance variation.
a, Examples of alternative 5′ splice site and intron retention variation among pan-transcriptome genotypes. Top: a 1 nt change (G to T) in seven genotypes caused the selection of an upstream splicing site in chr2H11235. Bottom: splicing was abolished in 11 genotypes in chr3H26163 due to a G to T change. b, Heatmap (PAV) of genes with zero transcript abundance in at least one genotype clustered according to similarity. Grey represents zero detected expression. c, Correlations between gene copy number and transcript abundance for 98 multiple-copy genes across five tissues. The boxplot whiskers show minimum and maximum values, the upper bound of the box represents the 75th percentile, the lower bound of the box represents the 25th percentile and the centerline represents the median. d, Location, magnitude and direction of DEGs across the 141 Mb inversion on chromosome 7H. Statistics were performed using the limma-voom R package with multiple comparison adjustments using the BH procedure. e, Heatmap with Pearson correlations between percent identities in TFBSs in upstream 2 kb regions and percent coherence (within ±30%) in expression values computed for sets of ~3,000 genes showing increasing TPM CV. f, For each set of ~3,000 genes, the percent content of core, shell, cloud and DEGs is reported. DEGs, differentially expressed genes; SS, splice site.
Fig. 3
Fig. 3. Comparative gene expression and gene network analyses.
a, Illustration of the six main communities identified in the WGCNA analysis. Module–tissue correlation and functional enrichment of the modules included in each of the communities reveal distinct associations with tissues/organs. C1–C3, plant reproductive processes; C4, photosynthesis—shoot; C5, starch metabolism—caryopsis and C6, nutrient uptake—root. b, Distribution of 1:1 orthologous groups (exactly 20 genes, 1 from each genotype) across the six communities. Number of accessions refers to the largest cluster within a single community for the respective orthogroup. c, Major functional enrichments where the color of the dot represents the FDR-adjusted P value of one-sided Fisher’s exact test (top), and the module-tissue PCC where the size of the dot represents the P value of two-sided Fisher’s exact test (bottom) for the six main communities. d, Accession-specific co-expression distribution of selected barley orthogroups (y axis) associated with distinct functions based on orthology to rice (panel 1, MADS-box protein family; panels 2–4, families discussed in the text) over the six communities and corresponding genotypes (x axis). PCC, Pearson correlation coefficients.
Fig. 4
Fig. 4. Morex Atlas RNA-seq datasets and variability between samples.
a, Image and description of the samples used to generate the Mx-RTD and used for quantification of differential gene expression. b, MDS plot of gene expression data from the replicated RNA-seq datasets and quantified using Mx-RTD. Each of the 12 datasets is represented by the same colored dot in a and b. The key provides the project identifier associated with each colored dot, and samples are described in full in Supplementary Data 11. c, MDS plot of the gene expression data for the five replicated Morex tissues (PRJEB64639) used to develop both GsRTDMorex and PanBaRT20. d, Twenty co-expression clusters from 12,292 core:single Morex genes. The black lines indicate average z scores, while the color ribbons show s.e. of the z scores in the clusters, which are ±s.e. of the average. EtOH, ethanol; ABA, abscisic acid.
Fig. 5
Fig. 5. Agronomic and climate data for GA2ox mutants.
ac, Yield (a), TGW (b) and starch content (c) from field-grown ga2ox7 mutant (n = 4 biological replicates) and RGT Planet control plants (n = 4 biological replicates; DK-2019). d,e, Micromalting data from field-grown ga2ox7 mutant and RGT Planet control plants (n = 5 technical replicates; DK-2022). d, α-Amylase activity and e, free LD activity. f, Yield from ga2ox3 mutant (2020, n = 3; 2021, n = 2; 2022, n = 2 biological replicates) and RGT Planet control plants (2020, n = 2; 2021, n = 2; 2022, n = 3 biological replicates; DK-2020-2022). gi, Micromalting data from field-grown ga2ox3 mutant and RGT Planet control plants (DK-2022; n = 5 technical replicates). g, α-Amylase activity; h, β-amylase activity and i, free LD activity. j, Cumulative rain in millimeters across the years 2019–2022 with the year 2020 in blue. k, Drought index (from DMI) across the years 2019–2022 with the year 2020 in blue. Error bars are s.d. All data are provided as mean ± s.d. Two-tailed t test was performed to obtain P values. LD, limit dextrinase; DMI, Danish Meteorological Institute; NS, not significant.
Extended Data Fig. 1
Extended Data Fig. 1. Construction of PanBaRT20.
The Morex and Barke GsRTDs were used as examples to illustrate the construction of PanBaRT20 from 20 GsRTDs. a, The transcripts in each GsRTD gene were collapsed into an exon union set (step 1). The union sets of all the GsRTD genes were mapped to the PSVCP pan-genome using Minimap2 (step 2). This ensured that all the transcripts from the same gene were mapped to the same genomic loci on the PSVCP pan-genome (step 3). b, The overlapped transcripts were assigned the same gene ID. The multiple-exon transcripts that shared identical intron combinations were merged, and the furthest start and end of these transcripts were taken as the transcript start site (TSS) and end site (TES) of the merged transcript (step 4). The overlapped mono-exon transcripts were merged into one transcript with the furthest starting and ending as the TSS and TES (step 5). If a set of overlapped transcripts were located entirely within the introns of other transcripts, they were assigned a separate gene ID (step 6). c, After assigning new gene and transcript IDs to the PanBaRT20 gene models, a look-up table was created to record the gene and transcript associations between PanBaRT20 and 20 GsRTDs.
Extended Data Fig. 2
Extended Data Fig. 2. Characteristics of GsRTDs and PanBaRT20.
a, The percentages of GsRTD genes in 20 genotypes that matched core-single copy, core-multiple copy, shell-single copy, shell-multiple copy, cloud-single copy and cloud-multiple copy genes in PanBaRT20. b, Significant gene ontology (GO) enriched terms of PanBaRT20 genes in core, shell and cloud gene categories. c, Significant GO enriched terms of 2,925 PanBaRT20 genes with zero TPM in any tissue in 1–19 genotypes.
Extended Data Fig. 3
Extended Data Fig. 3. Drivers of variation in transcript abundance.
a, Expression of HvCBF2 and HvCBF4 by tissue and copy number. Each genotype had 3 biological replicates per tissue, except for HOR10350 (caryopsis n = 2), HOR7552 (root n = 2) and HOR84148 (inflorescence n = 2). Significant correlation can be found for HvCBF2 in the coleoptile (r2 = 0.85), inflorescence (r2 = 0.62), root (r2 = 0.5) and shoot (r2 = 0.71) and for HvCBF4 in the inflorescence (r2 = 0.44) and shoot (r2 = 0.49). The boxplot whiskers show minimum and maximum values, the upper bound of the box represents 75th percentile, the lower bound 25 percentile and the centerline the median. b, Principal component cluster analysis of the genes expressed in the inversion. The region contained 2508 expressed PanBaRT genes in at least one of the four tissues. The PCA splits the 201 genotypes into two clusters in every tissue corresponding to those genotypes carrying the inversion versus those carrying the wild type. c, Alignment of chromosome 7H between cultivar RGT Planet and the linear pan-genome generated through PSVCP highlighting the genomic 140 Mb inversion. d, Hi-C interaction matrix of chromosome 7H from the cultivar Morex. The division into A and B compartments emerges as principal component 1 in a PCA of Hi-C interaction frequencies. The A/B compartment boundary on the long arm of 7H is quite distinct and part of the inversion in RGT Planet.
Extended Data Fig. 4
Extended Data Fig. 4. Transcription factor binding site analysis.
a, Percent identities for transcription factor binding sites (TFBS) in 500 bp segments of 2 kb upstream (regions from A to D) and 500 bp downstream (region E) of start codon computed for each genotype vs. Morex. The x axis indicates 30 TFBS consensus sequences with a code from 1 to 30 (see Methods for details). b, Percent TFBS identities against percent coherent expression in each pairwise comparison (individual genotypes vs. Morex, each pair represented by a dot) for all genes (15,001 genes Pearson correlation value = 0.395), genes with low coefficient of variation (CV; 0–0.4 CV, 2,999 genes, corr. = 0.695) and genes with high CV (1.48–20 CV, 2,994 genes, corr. = 0.087).
Extended Data Fig. 5
Extended Data Fig. 5. Community clustering.
a, Full distribution of 1:1 orthologous groups (exactly 20 genes, one from each genotype) across the six communities. Number of accessions refers to the largest cluster within a single community for the respective orthogroup. b, Heatmap displaying the Louvain community clustering of all 738 WGCNA modules (bottom). Six main communities were identified (x axis C1–C6), which show distinct functional patterns where the color of the dot represents the false discovery rate (FDR) adjusted p value of one-sided Fisher’s exact test (top) and module-tissue correlations where the size of the dot represents the p value of two-sided Fisher’s exact test (middle). c, The 861 transcription factors presence–absence clustering representation across the six communities.
Extended Data Fig. 6
Extended Data Fig. 6. Functional enrichment, tissue specificity and correlations among the three most connected modules.
a, Summary of functional enrichments where the color of the dot represents the false discovery rate (FDR) adjusted p value of one-sided Fisher’s exact test. b, Module-tissue correlations where the size of the dot represents the p value of two-sided Fisher’s exact test for (c) the 3 most connected groups (C4, C5 and C6) of modules with cosine similarity cutoff 0.43 (zoom-in of Extended Data Fig. 4) displaying their cosine similarity values and accession wise module names.
Extended Data Fig. 7
Extended Data Fig. 7. Functional enrichment within one community.
Enrichment for orthologous groups exclusively present in one community for the two highest hierarchical Mercator categories (level 1 and level 2) for 17 orthologous groups in C1, 34 in C2, 1 in C3, 414 in C4, 288 in C5 and 616 in C6. The color of the dot represents the false discovery rate (FDR) adjusted p value of one-sided Fisher’s exact test.
Extended Data Fig. 8
Extended Data Fig. 8. Multidimensional scaling plots of gene expression of the 12 RNA-seq datasets used to generate the Morex Gene Atlas.
ac, First three dimensions show the distribution of samples from all projects. do, First two dimensions of the gene expression data from the individual projects.
Extended Data Fig. 9
Extended Data Fig. 9. Differentially expressed genes (DEGs) in two experimental datasets.
a, Results from the pan-transcriptome sample dataset (PRJEB64639). b, Results from the heavy metal experimental dataset (PRJNA382490). Graphs show the numbers of DEGs in each named contrast group. Samples were pre-processed with cutoff of 10 CPM in a least two of the different samples. DEGs were selected with a greater than 2-fold change and a significance value of p ≤ 0.01. Statistics were performed using the limma-voom R package with multiple comparison adjustments using the Benjamini–Hochberg procedure. The blue box represents the total number of DEGs calculated using the Morex RTD (MxRTD), and the green and red boxes represent the total number of DEGs calculated using the PanBaRT20 RTD. Green represents PanBaRT20, which showed more DEGs compared to MxRTD, and the red represents PanBaRT20, which showed less DEGs compared to MxRTD. The Venn diagrams show the total number of unique genes across all the contrast groups tested using both MxRTD and PanBaRT20 RTD. The overlap represents the number of DEGs common to both RTDs.

References

    1. Verstegen, H., Köneke, O., Korzun, V. & von Broock, R. in Biotechnological Approaches to Barley Improvement (eds Kumlehn, J. & Stein, N.) 3–19 (Springer, 2014).
    1. Langridge, P. in The Barley Genome (eds Stein, N. & Muehlbauer, G. J.) 1–10 (Springer, 2018).
    1. Harwood, W. A. in Barley: Methods and Protocols 1–5 (Springer, 2019).
    1. Von Bothmer, R., van Hintum, T., Knüpffer, H. & Sato, K. Diversity in Barley (Hordeum vulgare) Vol. 7 (Elsevier, 2003).
    1. Komatsuda, T. et al. Six-rowed barley originated from a mutation in a homeodomain-leucine zipper I-class homeobox gene. Proc. Natl Acad. Sci. USA104, 1424–1429 (2007). - PMC - PubMed

LinkOut - more resources