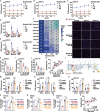
Figure 1. Mubritinib alters mitochondrial respiration through complex I inhibition and impairs BTSC growth.
(A–C) Patient-derived BTSCs, BTSC53 (A), BTSC73 (B) and BTSC147 (C) were subjected to real-time Resipher analysis to measure the basal oxygen consumption rate (OCR) following mubritinib treatment. Data are presented as the means ± SEM, n = 3 independent biological experiments. Two-way ANOVA followed by Dunnett’s test vs vehicle control. BTSC53 (A): ***p20 = 1.9e−10, ***p100 = 1.2e−14, ***p500 = 1.2e−14. BTSC73 (B): ***p20 = 1.2e−14, ***p100 = 1.2e−14, ***p500 = 1.2e−14. BTSC147 (C): ***p20 = 2.2e−11, ***p100 = 1.2e−14, ***p500 = 1.2e−14. (D, E) Basal mitochondrial respiration, maximal mitochondrial respiration and spare respiratory capacity (SRC) were measured in BTSC53 (D) and BTSC73 (E) following mubritinib treatment using the Resipher system. Data are presented as the means ± SEM, n = 3 independent biological experiments. One-way ANOVA followed by Dunnett’s test vs vehicle control. BTSC53 (D): *pbasal (20) = 0.0105; ***pbasal (100) = 0.0005; ***pbasal (500) = 0.0004; ***pmaximal (20) = 0.0005, ***pmaximal (100) = 5.1e−5, ***pmaximal (500) = 5.9e−5; **pSRC (20) = 0.0018, ***pSRC (100) = 0.0004, ***pSRC (500) = 0.0006. BTSC73 (E): **pbasal (20) = 0.0025; ***pbasal (100) = 0.0007; ***pbasal (500) = 0.0004; ***pmaximal (20) = 2.3e−6, ***pmaximal (100) = 3.2e−7, ***pmaximal (500) = 2.3e−7; *pSRC (20) = 0.021, **pSRC (100) = 0.0038, **pSRC (500) = 0.0031. (F) Multiple patient-derived BTSCs, BTSC12, BTSC25, BTSC50, BTSC53, BTSC73, BTSC75, BTSC100, BTSC119, BTSC147, BTSC198 and P3, were exposed to increasing concentrations of mubritinib (0 to 500 nM) for 7 days, followed by live cell counting. Data are presented as the means ± SEM, n = 3 independent biological experiments. One-way ANOVA followed by Dunnett’s test vs vehicle control. ***pBTSC12 (20) = 0.0003, ***pBTSC12 (100) = 1.4e−5, ***pBTSC12 (500) = 7e−6; *pBTSC25 (20) = 0.0316, **pBTSC25 (100) = 0.0052, ***pBTSC25 (500) = 0.0007; ***pBTSC50 (20) = 0.0003, ***pBTSC50 (100) = 2.6e−6, ***pBTSC50 (500) = 1e−6; ***pBTSC53 (20) = 1.1e−5, ***pBTSC53 (100) = 2e−6, ***pBTSC53 (500) = 1e−6; ***pBTSC73 (20) = 0.0007, ***pBTSC73 (100) = 3.1e−5, ***pBTSC73 (500) = 2.6e−5; ***pBTSC75 (20) = 0.0007, ***pBTSC75 (100) = 3.2e−5, ***pBTSC75 (500) = 6e−6; *pBTSC100 (100) = 0.0384, **pBTSC100 (500) = 0.001; ***pBTSC119 (20) = 0.0004, ***pBTSC119 (100) = 6.9e−5, ***pBTSC119 (500) = 1e−5; ***pBTSC147 (20) = 9.4e−8, ***pBTSC147 (100) = 1.2e−8, ***pBTSC147 (500) = 8e−9; ***pBTSC198 (20) = 0.0008, ***pBTSC198 (100) = 0.0003, ***pBTSC198 (500) = 0.0002; ***pP3 (100) = 0.0003, ***pP3 (500) = 0.0001. (G–J) EdU incorporation was analysed by immunofluorescence imaging of BTSCs (#53, #73 and #147) after 4 days of mubritinib treatment at concentrations of 20 nM, 100 nM and 500 nM. Representative images of EdU (red) staining are shown (G). Nuclei were stained with DAPI (blue). Scale bar = 50 µm. The number of EdU-positive cells was quantified with Fiji software in BTSC53 (H), BTSCS73 (I) and BTSC147 (J). Data are presented as the means ± SEM, n = 3 independent biological experiments. One-way ANOVA followed by Dunnett’s test vs vehicle control. BTSC53 (H): **p20 = 0.0045, ***p100 = 0.001, ***p500 = 0.0006. BTSC73 (I): **p20 = 0.0012, ***p100 = 2.3e−5, ***p500 = 5e−6. BTSC147 (J): **p20 = 0.0033, ***p100 = 0.0006, ***p500 = 0.0003. (K) Pearson correlation analysis between the basal oxygen consumption rate (OCR) and BTSC sensitivity score to mubritinib following 7 days of treatment was performed. (l) A schematic diagram of the mitochondrial electron transport chain with ectopic NDI1 expression is presented. (M–O) BTSC53 (M), BTSC73 (N) and BTSC147 (O) expressing the control (CTL) or NDI1 vector were treated with vehicle control or 500 nM mubritinib and subjected to Resipher analysis to measure the basal OCR, maximal respiration and SRC. Data are presented as the means ± SEM, n = 3 independent biological experiments. One-way ANOVA followed by Tukey’s test. BTSC53 (M): **pbasal (CTL vs mubritinib) = 0.0049, ***pbasal (mubritinib vs NDI1 + mubritinib) = 0.0004, pbasal (NDI1 vs NDI1 + mubritinib) = 0.7841; **pmaximal (CTL vs mubritinib) = 0.0011, ***pmaximal (mubritinib vs NDI1 + mubritinib) = 0.0003, pmaximal (NDI1 vs NDI1 + mubritinib) = 0.5223; pSRC (NDI1 vs NDI1 + mubritinib) = 0.8773. BTSC73 (N): **pbasal (CTL vs mubritinib) = 0.0041, **pbasal (mubritinib vs NDI1 + mubritinib) = 0.0035, pbasal (NDI1 vs NDI1 + mubritinib) = 0.9933; ***pmaximal (CTL vs mubritinib) = 6.1e−5, ***pmaximal (mubritinib vs NDI1 + mubritinib) = 0.0001, pmaximal (NDI1 vs NDI1 + mubritinib) = 0.8470; *pSRC (CTL vs mubritinib) = 0.016, *pSRC (mubritinib vs NDI1 + mubritinib) = 0.0467, pSRC (NDI1 vs NDI1 + mubritinib) = 0.9615. BTSC147 (O): *pbasal (mubritinib vs NDI1 + mubritinib) = 0.0192, pbasal (NDI1 vs NDI1 + mubritinib) = 0.9528; **pmaximal (CTL vs mubritinib) = 0.0018, ***pmaximal (mubritinib vs NDI1 + mubritinib) = 0.0009, pmaximal (NDI1 vs NDI1 + mubritinib) = 0.9472; *pSRC (CTL vs mubritinib) = 0.0335, *pSRC (mubritinib vs NDI1 + mubritinib) = 0.0396, pSRC (NDI1 vs NDI1 + mubritinib) = 0.9993. (P–R) The number of live BTSC53 (P), BTSC73 (Q) and BTSC147 (R) expressing control vector or NDI1 after 7 days of 500 nM mubritinib treatment was measured. Data are presented as the means ± SEM, n = 3 independent biological experiments. One-way ANOVA followed by Tukey’s test. BTSC53 (P): ***pCTL vs mubritinib = 0.0003, ***pmubritinib vs NDI1 + mubritinib = 0.0005, pNDI1 vs NDI1 + mubritinib = 0.4954. BTSC73 (Q): ***pCTL vs mubritinib = 0.0004, **pmubritinib vs NDI1 + mubritinib = 0.0017, pNDI1 vs NDI1 + mubritinib = 0.1875. BTSC147 (R): ***pCTL vs mubritinib = 0.0002, ***pmubritinib vs NDI1 + mubritinib = 0.0002, pNDI1 vs NDI1 + mubritinib = 0.0904. (S) Pearson correlation analysis was performed between the BTSC sensitivity score to mubritinib following 7 days of treatment and mitochondrial (MTC) transcriptional subtype signature score. Source data are available online for this figure.