. 2025 Feb 3;24(1):40.
doi: 10.1186/s12943-024-02198-2.

Cancer cells avoid ferroptosis induced by immune cells via fatty acid binding proteins

Affiliations

Cancer cells avoid ferroptosis induced by immune cells via fatty acid binding proteins

Maria Angelica Freitas-Cortez et al. Mol Cancer. .

Abstract

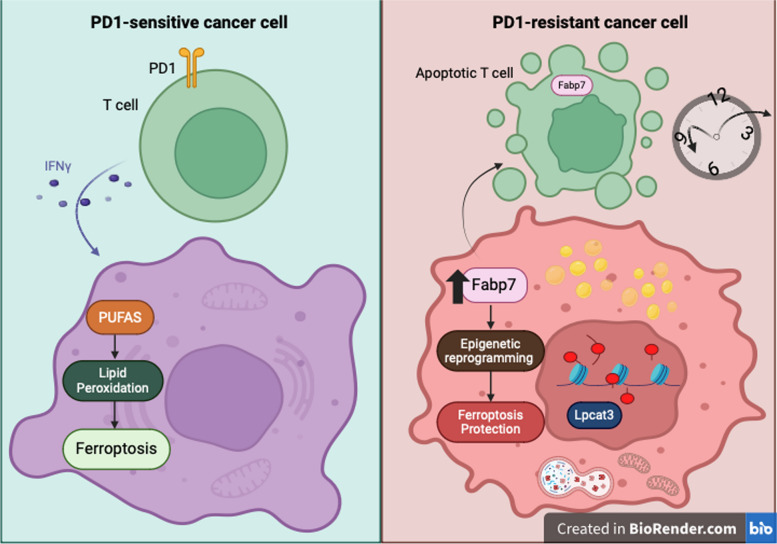
Background: Cancer creates an immunosuppressive environment that hampers immune responses, allowing tumors to grow and resist therapy. One way the immune system fights back is by inducing ferroptosis, a type of cell death, in tumor cells through CD8 + T cells. This involves lipid peroxidation and enzymes like lysophosphatidylcholine acyltransferase 3 (Lpcat3), which makes cells more prone to ferroptosis. However, the mechanisms by which cancer cells avoid immunotherapy-mediated ferroptosis are unclear. Our study reveals how cancer cells evade ferroptosis and anti-tumor immunity through the upregulation of fatty acid-binding protein 7 (Fabp7).

Methods: To explore how cancer cells resist immune cell-mediated ferroptosis, we used a comprehensive range of techniques. We worked with cell lines including PD1-sensitive, PD1-resistant, B16F10, and QPP7 glioblastoma cells, and conducted in vivo studies in syngeneic 129 Sv/Ev, C57BL/6, and conditional knockout mice with Rora deletion specifically in CD8+ T cells, Cd8 cre;Rorafl mice. Methods included mass spectrometry-based lipidomics, targeted lipidomics, Oil Red O staining, Seahorse analysis, quantitative PCR, immunohistochemistry, PPARγ transcription factor assays, ChIP-seq, untargeted lipidomic analysis, ROS assay, ex vivo co-culture of CD8+ T cells with cancer cells, ATAC-seq, RNA-seq, Western blotting, co-immunoprecipitation assay, flow cytometry and Imaging Mass Cytometry.

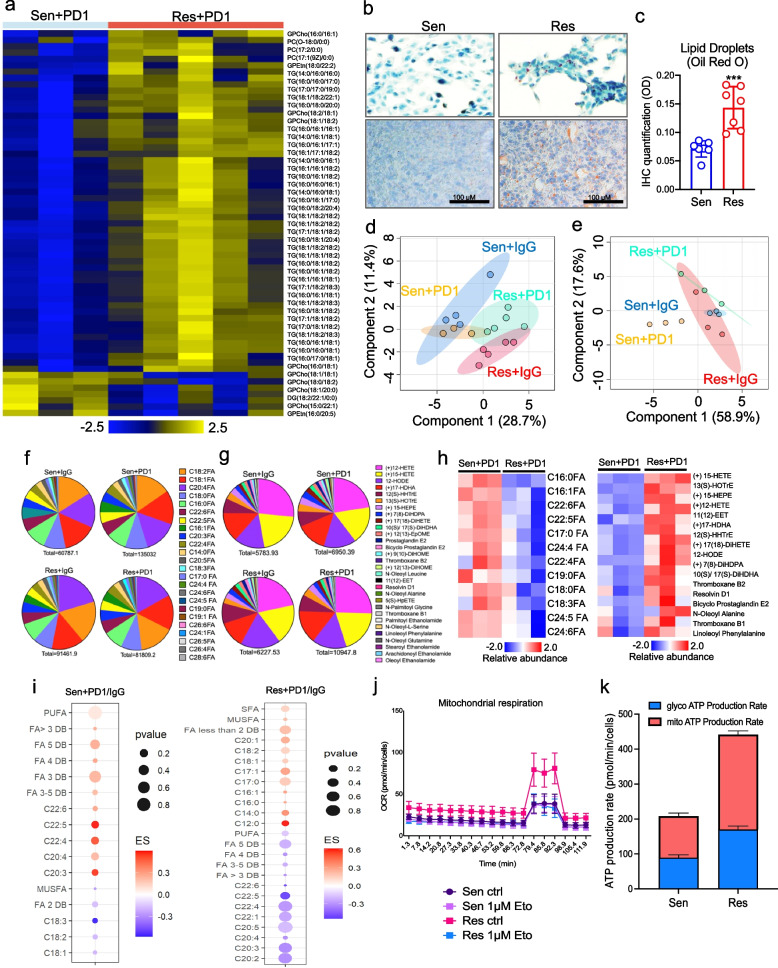
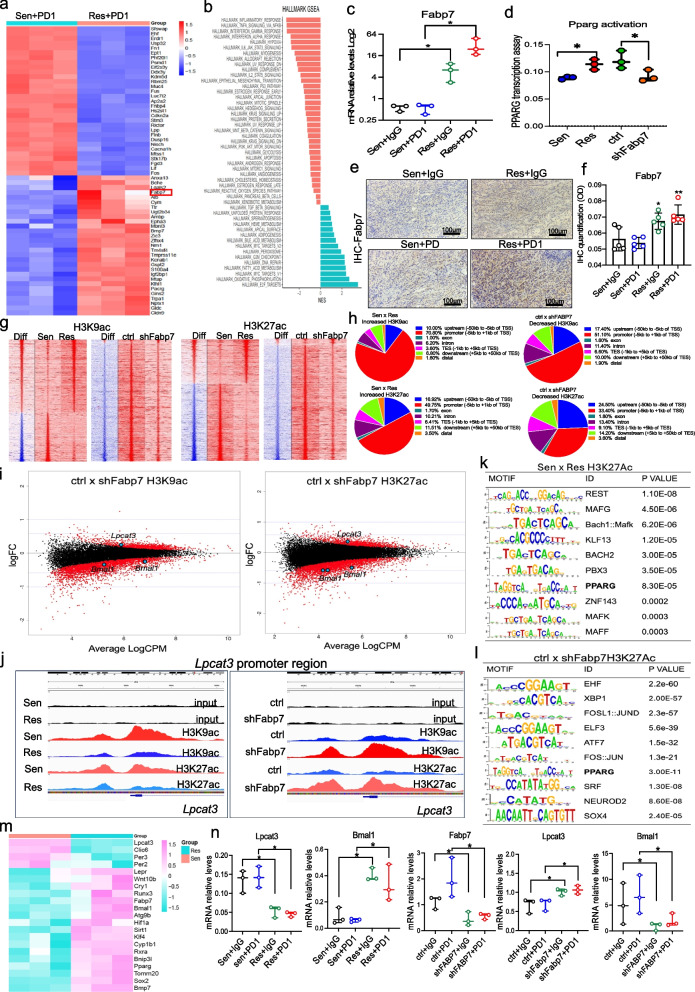
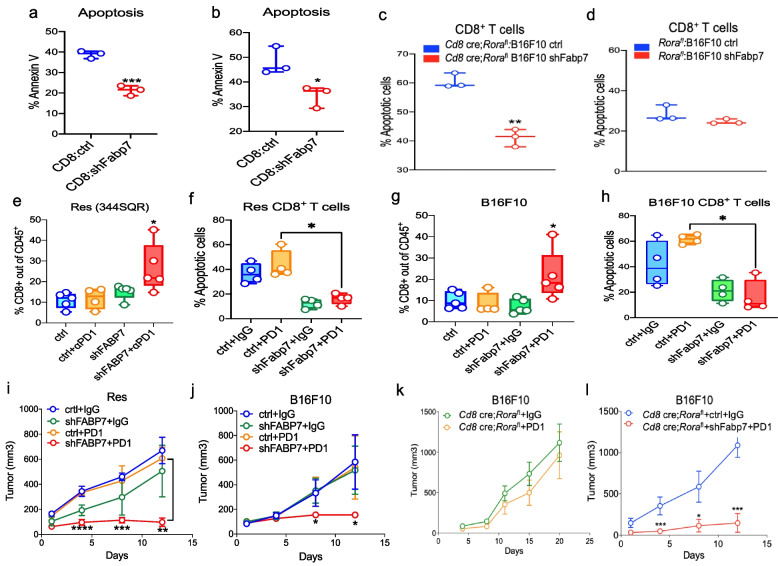
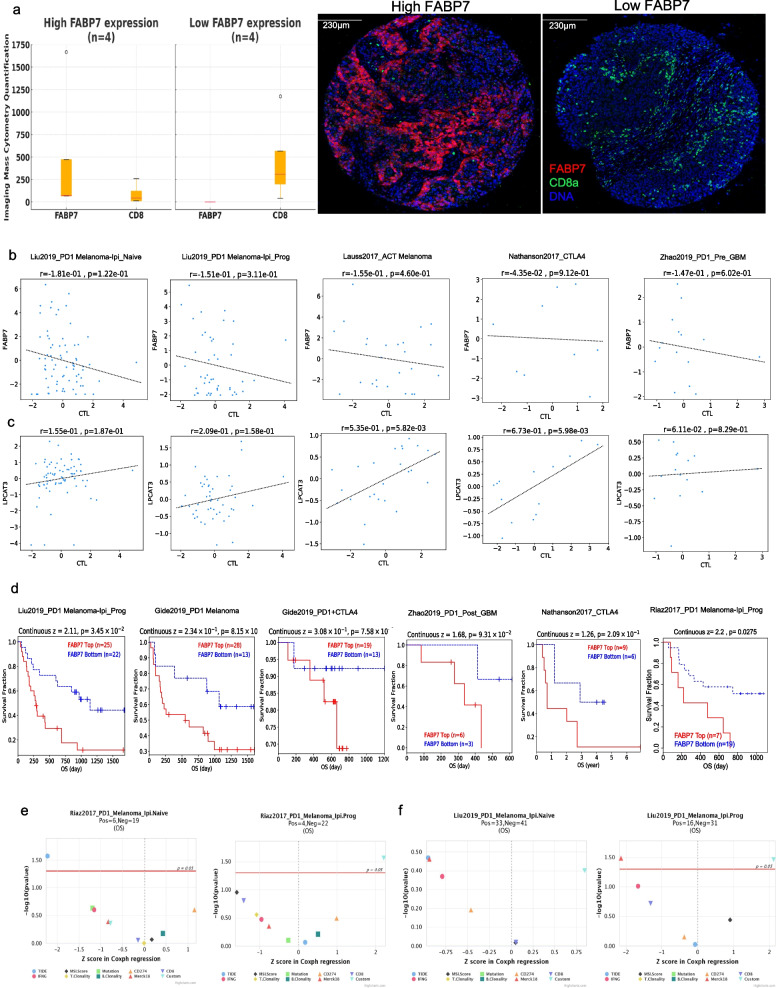
Results: PD1-resistant tumors upregulate Fabp7, driving protective metabolic changes that shield cells from ferroptosis and evade anti-tumor immunity. Fabp7 decreases the transcription of ferroptosis-inducing genes like Lpcat3 and increases the transcription of ferroptosis-protective genes such as Bmal1 through epigenetic reprogramming. Lipidomic profiling revealed that Fabp7 increases triglycerides and monounsaturated fatty acids (MUFAs), which impede lipid peroxidation and ROS generation. Fabp7 also improves mitochondrial function and fatty acid oxidation (FAO), enhancing cancer cell survival. Furthermore, cancer cells increase Fabp7 expression in CD8+ T cells, disrupting circadian clock gene expression and triggering apoptosis through p53 stabilization. Clinical trial data revealed that higher FABP7 expression correlates with poorer overall survival and progression-free survival in patients undergoing immunotherapy.

Conclusions: Our study uncovers a novel mechanism by which cancer cells evade immune-mediated ferroptosis through Fabp7 upregulation. This protein reprograms lipid metabolism and disrupts circadian regulation in immune cells, promoting tumor survival and resistance to immunotherapy. Targeting Fabp7 could enhance immunotherapy effectiveness by re-sensitizing resistant tumors to ferroptosis.

Keywords: Bmal1; Cancer; Circadian clock; FABP7; Ferroptosis; Immunotherapy; Lpcat3.


Conflict of interest statement

Declarations. Competing interests: M.A.F.C. and J.W.W. has pending patent on a small molecule targeting Fabp7. J.W.W. is supported by Alkermes (Research grant), Nanobiotix (Research grant, Travel expenses, SAB), GSK (Research grant), BMS (Research grant), Merck (Research grant), Varian (Research grant, Travel expenses, clinical sponsored research), Checkmate Pharmaceuticals (Research grant, SAB), Reflexion (Research grant, Travel expenses, Stock options, SAB), Artidis (research grants, clinical sponsored research), Takeda (Research grant), Hotspot Therapeutics (Research grant), Gilead (Research grant), Kiromic (Research grant), Bayer Health (Research grant), Agenus (SAB), Novocure (SAB), Alpine Immune Science (SAB, stock options), Oncoresponse (SAB, stock options), Astra Zeneca (consultant), Nanorobotix (stock options), GI innovation (consultant), Molecular Match (Stock options, consultant), Kezar Life Science (SAB). M.A.D. has been a consultant to Roche/Genentech, Array, Pfizer, Novartis, BMS, GSK, Sanofi-Aventis, Vaccinex, Apexigen, Eisai, Iovance, Merck, and ABM Therapeutics, and he has been the PI of research grants to MD Anderson by Roche/Genentech, GSK, Sanofi-Aventis, Merck, Myriad, Oncothyreon, Pfizer, ABM Therapeutics, and LEAD Pharma. All other authors have no conflict of interest to declare.

Figures

Fig. 1
Fig. 1
Tumors resistant to immunotherapy have altered lipid metabolic profiling to avoid ferroptosis. A Mass spectrometry-based lipidomics profiling of PD1-sensitive (Sen) and PD1-resistant (Res) tumors treated with PD1 inhibitors or IgG control. The heatmap displays significantly altered lipid profiles (FDR < 0.25) in Sen (n = 3) and Res (n = 5) tumors treated with PD1, with yellow indicating upregulated lipids and blue indicating downregulated lipids (z-score). Statistical analysis was performed using an unpaired t-test (p < 0.05), followed by the Benjamini–Hochberg procedure for false discovery rate correction (FDR < 0.25). B, C Oil Red O staining for lipid accumulation reveals increased lipid accumulation in Res cells compared to Sen cells both in vitro (B) and in vivo (B,C), with nuclei stained with hematoxylin and lipid droplets or neutral lipids stained with Oil Red O (red/orange). Data represent findings from two independent experiments. D, E Global profiles of lipids and fatty acids along with their metabolites in Sen (n = 3 or 4) and Res (n = 5) tumors treated with PD1 inhibitors or IgG. F, G Targeted lipidomics of eicosanoids illustrating total fatty acid levels and metabolites in PD1-sensitive (Sen) and PD1-resistant (Res) tumors treated with PD1 inhibitors or IgG control. Each group consisted of n = 3 mice per group. H Heatmap shows significantly altered total fatty acid and metabolite profiles (FDR < 0.25) in Sen and Res tumors treated with PD1. I Sen tumors exhibit higher levels of polyunsaturated fatty acids (PUFAs) than Res tumors treated with PD1. Conversely, Res tumors have lower PUFA levels and higher concentrations of monounsaturated fatty acids (MUFAs). J Mitochondrial fatty acid oxidation (FAO) in Sen and Res cells, demonstrated by Seahorse oxidative stress test results, illustrating the impact of FAO inhibition on mitochondrial function in these cells. K Comparative analysis of ATP production rates reveals that Res cells have higher ATP production rates than Sen cells, with key parameters of mitochondrial respiration, including basal respiration, proton leak, and maximal respiration, calculated using the Seahorse Wave software
Fig. 2
Fig. 2
Lipid chaperone FABP7 protects tumors from immunotherapy-mediated ferroptosis via epigenetic reprogramming. A Fabp7 is among the top upregulated genes in PD1-resistant (Res) tumors compared to PD1-sensitive (Sen) tumors treated with PD1 inhibitors. B Gene set enrichment analysis highlights upregulation of pathways related to fatty acid metabolism, oxidative phosphorylation, and heme metabolism in Res tumors. C, E, F Validation of Fabp7 overexpression at the RNA and protein levels in Res compared to Sen tumors treated with PD1 inhibitors, shown through quantitative PCR and immunohistochemistry (IHC). D Pparg activation assay in Sen, Res, Res-ctrl and Res-shFabp7 cells. G Analysis of acetylation patterns of H3K27ac and H3K9ac in Res versus Sen cells, and in Res-ctrl versus Res-shFabp7 cells, performed via chromatin immunoprecipitation (ChIP) assays coupled with sequencing (ChIP-seq). H H3K9ac and H3K27ac preferentially occur in promoter regions of Sen versus Res cells (70.80% vs 49.75%) and in Res-ctrl versus Res-shFabp7 cells (51.10% vs 33.40%). I Changes in acetylation levels of ferroptosis-related genes, particularly Lpcat3 and Bmal1, with Fabp7 knockdown leading to increased acetylation of Lpcat3 and decreased acetylation of Bmal1. J Integrative Genomics Viewer showing differences in signal enrichment in the promoter region of Lpcat3 for H3K27ac and H3K9ac in Sen versus Res and Res-ctrl versus Res-shFabp7 cells. K Motif enrichment analysis identifying transcription factors regulated by Fabp7, with Pparg binding motifs significantly enriched. L, M Validation of ChIP-seq results by global gene expression profiling in Sen versus Res tumor models, confirming downregulation of Lpcat3 and upregulation of Bmal1 (Arntl) in Res tumors. N Differential expression of Lpcat3 and Bmal1 validated in Sen versus Res tumors, and in Res-ctrl versus Res-shFabp7 tumors treated with either IgG control or PD1 inhibitor using qPCR
Fig. 3
Fig. 3
Fabp7 modifies lipid composition and mitochondrial function to protect immunotherapy-resistant tumors from ferroptosis. A-D Lipid compositions in PD1-resistant control (Res-ctrl) and Fabp7 knockdown (Res-shFabp7) tumors (n = 3), treated with either IgG control or PD1 inhibitor, analyzed by high-resolution mass spectrometry, reveal distinct patterns between Res-ctrl and Res-shFabp7 groups in each treatment condition. E A global reduction in triglycerides (TGs) in Res-shFabp7 tumors compared to Res-ctrl, indicating Fabp7 impact on lipid metabolism. F Quantification of monounsaturated fatty acids (MUFAs) (e.g., FA 24:1, FA 22:1) and the polyunsaturated fatty acid (PUFA) derivative adrenic acid (FA 22:4) in Res-ctrl and Res-shFabp7 tumors shows significant decreases in MUFAs in Res-shFabp7 tumors, suggesting increased susceptibility to ferroptosis. G, H Immunohistochemical analysis of lipid peroxidation with 4-hydroxynonenal (4-HNE) indicates increased lipid peroxidation in Res-shFabp7 tumors treated with PD1 inhibitor or IgG control compared to other groups, with statistical analysis performed using Student's t-test. I, J Elevated reactive oxygen species (ROS) levels in Res-shFabp7 tumors compared to Res-ctrl, highlighting Fabp7 role in cellular oxidative stress, with data representing two reproducible independent experiments. K, L Seahorse assay results showing the effects of Fabp7 knockdown on mitochondrial function and fatty acid oxidation (FAO) in Res-ctrl and Res-shFabp7 cells, with etomoxir used for FAO analysis, and quantification of ATP production indicating reduced ATP in Fabp7-knockdown cells
Fig. 4
Fig. 4
Cancer cells upregulate Fabp7 to disrupt circadian clock genes and promote apoptosis in CD8 + T cells. A Quantitative PCR showed increased Fabp7 expression in tumor-infiltrating lymphocytes (TILs) from Resistant (Res) tumors compared with Sensitive (Sen) tumors (n = 3), and reduced expression in Res-shFabp7 tumors compared with Res-ctrl treated with PD1 (n = 4). Statistical analysis was performed using Student's t-test. B Fabp7 expression was decreased in CD8 + T cells co-cultured with Fabp7-knockdown cells (Res and B16F10) relative to control cells. Each group consisted of n = 3 technical replicates. Data shown represent at least two reproducible independent experiments and were analyzed with Student's t-test. (D-H) ATAC-Seq revealed global upregulation of differential peaks in gene promoters in T cells co-cultured with Res-shFabp7 cells versus Res-ctrl, indicating a suppressive role for Fabp7. Each group consisted of n = 3 technical replicates per group. I Motif enrichment analysis of ATAC-seq data showed reduced activity of specific transcription factors (TFs) in T cells co-cultured with Res-shFabp7 versus Res-ctrl cells. J Gene ontology (GO) analysis of ATAC-seq data indicated enrichment of apoptotic processes in T cells co-cultured with Res-shFabp7 cells. K Giggle score analysis showed TP53 to be highly enriched and negatively modulated in T cells co-cultured with Res-shFabp7. L RNA-Seq analysis of T cells co-cultured with cancer cells showed differential gene expression, including downregulation of Rora and clock-regulated genes, in T cells co-cultured with Res-shFabp7. M Gene ontology (GO) analysis for RNA-seq analysis showed enrichment of apoptotic processes in T cells co-cultured with Res-shFabp7 cells. N-P Quantitative PCR validation of Rora in CD8+ T cells co-cultured with Res-ctrl and Res-shFabp7 (N) or or B16F10-ctrl and B16F10-shFabp7 cells (O), and in T cells infiltrating Res-shFabp7 tumors treated with either IgG or PD1, compared to Res-ctrl tumors treated with either IgG or PD1 (P). Each group consisted of n = 3 technical replicates, with statistical analysis done using Student's t-test. Q Western blot analysis of p53 in CD8+ T cells from spleens of Rorafl and Cd8 cre;Rorafl mice after co-culture with Res-ctrl or Res-shFabp7 cells. Antibodies specific to p53 and vinculin (normalization control) were used. Each lane represents a distinct sample group. R Disruption of circadian clock genes in CD8 + T cells co-cultured with Res-ctrl compared to Res-shFabp7 cells, assessed by qPCR. Each group consisted of n = 3 technical replicates. Statistical analysis was performed usingdone using Student's t-test
Fig. 5
Fig. 5
Knockdown of FABP7 restores sensitivity to immunotherapy in resistant tumors. A, B Flow cytometry analysis of apoptosis with Annexin-specific antibody in CD8 + T cells co-cultured with Res-ctrl, Res-shFabp7, B16F10-ctrl, or B16F10-shFabp7 cells. Each group consisted of n = 3 technical replicates, with statistical analysis performed using Student's t-test. C, D Flow cytometry analysis of apoptosis in CD8+ T cells isolated from Cd8 cre;Rorafl or Rorafl mice, co-cultured with Res-ctrl or Res-shFabp7 cells. Each group consisted of n = 3 technical replicates, with statistical analysis performed using Student's t-test. Data represent findings from two independent experiments. EH Flow cytometry analyses showing increased CD8 + T cell infiltration and reduced apoptosis in tumors with Fabp7 knockdown (Res-shFabp7 [in 129 Ev mice] or B16F10-shFabp7 [in C57BL/6 mice]) treated with either IgG or PD1. Each group consisted of n = 4 or 5 mice, with data analyzed using Student's t-test. Data represent findings from two independent experiments. I Assessment of the response of PD1-resistant tumors, with or without Fabp7 knockdown, to PD1 inhibition in 129 Ev mice (n = 5 per group), demonstrating enhanced sensitivity in Fabp7-knockdown tumors. Data analyzed using two-way analysis of variance. Data represent findings from at least 3 independent experiments. J Enhanced response of B16F10 melanoma tumors with Fabp7 knockdown to PD1 inhibitor treatment in C57BL/6 mice (n = 5 per group), demonstrating that Fabp7 knockdown improves tumor sensitivity to immunotherapy. Data analyzed using two-way analysis of variance. Data represent findings from two independent experiments. K Comparison of tumor growth in Cd8 cre;Rorafl mice injected with B16F10 cells and treated with either IgG control or PD1 (10 mg/kg) inhibitor (n = 5 per group) twice a week showed no significant difference in tumor growth. L Additional experiments with Res-ctrl and Res-shFabp7 cells in Cd8 cre;Rorafl mice (n = 5 per group) revealed a significant response to PD1 inhibition only in Fabp7-knockdown tumors, underscoring the importance of Fabp7 in resistance to PD1 inhibitor. Data analyzed using two-way analysis of variance. Data represent findings from two independent experiments
Fig. 6
Fig. 6
FABP7 expression correlates with CD8 T cell infiltration and patient outcomes in immunotherapy-treated patients. A Imaging Mass Cytometry (IMC) analysis of melanoma patients categorized by high and low expression levels of FABP7 (n = 4 for each group). Tumors with high FABP7 expression show significantly fewer CD8 T cells, whereas those with low FABP7 expression exhibit higher CD8 T cell infiltration. Unpaired t- test was used to determine significance * P < 0.05. B, C Analysis of the relationship between FABP7 and LPCAT3 expression and CD8 T cell infiltration in a broader cohort of patients undergoing PD1 (pembrolizumab) or CTLA4 (ipilimumab) inhibitor therapy using the Tumor Immune Dysfunction and Exclusion (TIDE) module. An inverse correlation was observed between FABP7 expression and CD8 T cell infiltration, while LPCAT3 expression showed a positive correlation with CD8 T cell infiltration. D Association between FABP7 expression and patient survival in clinical trials involving immunotherapy using TIDE. Higher FABP7 expression correlates with reduced overall survival and progression-free survival. E Prediction of FABP7 as a biomarker of response to immunotherapy, showing significant predictive value comparable to established biomarkers such as IFNG, mutation status, PDL1 expression, CD8 presence, Merck18, and B.clonality. Analyses were done with tumor immune dysfunction and exclusion (TIDE) tools (http://tide.dfci.harvard.edu)
Fig. 7
Fig. 7
Mechanism of Fabp7-mediated ferroptosis resistance in PD1-Resistant tumors. In PD1-sensitive cancer cells, the interaction between PD1 on T cells and its ligand on cancer cells leads to the release of interferon gamma (IFNγ). This cytokine induces lipid peroxidation through polyunsaturated fatty acids (PUFAs), resulting in ferroptosis, a form of regulated cell death characterized by iron-dependent lipid peroxidation. In contrast, PD1-resistant cancer cells exhibit enhanced survival mechanisms. These cells undergo epigenetic reprogramming facilitated by the upregulation of fatty acid binding protein 7 (Fabp7). Fabp7 alters lipid metabolism by modulating the activity of lysophosphatidylcholine acyltransferase 3 (Lpcat3), decreasing its histone acetylation. This process confers protection against ferroptosis. Additionally, PD1-resistant cells show an accumulation of apoptotic T cells caused by disruption of circadian clock genes expression, contributing to the overall resistance to immune-mediated cell death. Fabp7 also upregulates protective genes such as BMAL1 through epigenetic reprogramming, further enhancing resistance mechanisms. This illustration highlights the distinct molecular pathways by which Fabp7 mediates ferroptosis resistance and supports cancer cell survival, demonstrating its role in modulating lipid metabolism, mitochondrial function, and immune cell apoptosis to promote tumor resilience against PD1-mediated immunotherapy. Created with BioRender.com

References

    1. Hanahan D. Hallmarks of cancer: new dimensions. Cancer Discov. 2022;12:31–46. - PubMed
    1. Liao P, Wang W, Wang W, Kryczek I, Li X, Bian Y, Sell A, Wei S, Grove S, Johnson JK, et al. CD8(+) T cells and fatty acids orchestrate tumor ferroptosis and immunity via ACSL4. Cancer Cell. 2022;40(365–378):e366. - PMC - PubMed
    1. Wang W, Green M, Choi JE, Gijon M, Kennedy PD, Johnson JK, Liao P, Lang X, Kryczek I, Sell A, et al. CD8(+) T cells regulate tumour ferroptosis during cancer immunotherapy. Nature. 2019;569:270–4. - PMC - PubMed
    1. Yang WS, Stockwell BR. Ferroptosis: death by lipid peroxidation. Trends Cell Biol. 2016;26:165–76. - PMC - PubMed
    1. Lei G, Zhuang L, Gan B. Targeting ferroptosis as a vulnerability in cancer. Nat Rev Cancer. 2022;22:381–96. - PMC - PubMed

Substances