

Effects of coenzyme q10 supplementation on metabolic and reproductive outcomes in obese rats
- PMID: 39901256
- PMCID: PMC11789320
- DOI: 10.1186/s13048-025-01604-7
Effects of coenzyme q10 supplementation on metabolic and reproductive outcomes in obese rats
Abstract
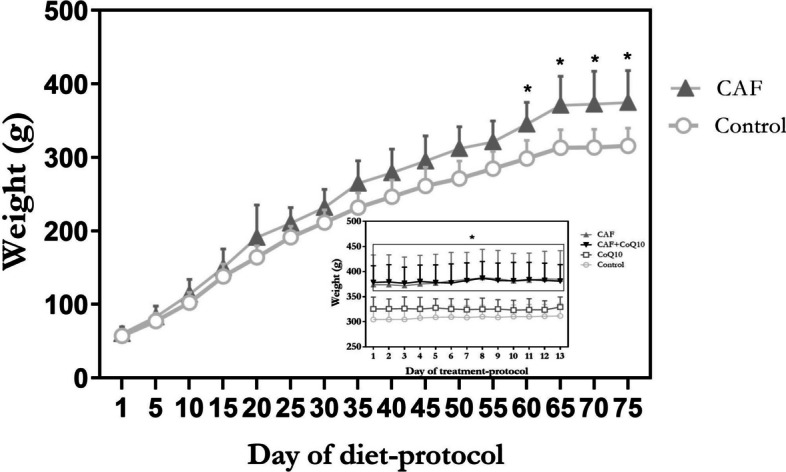
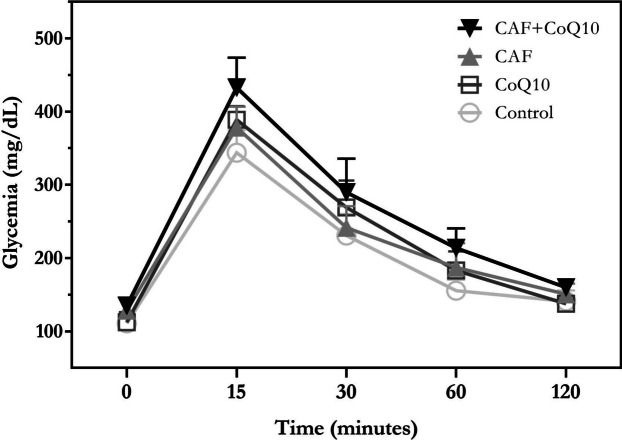
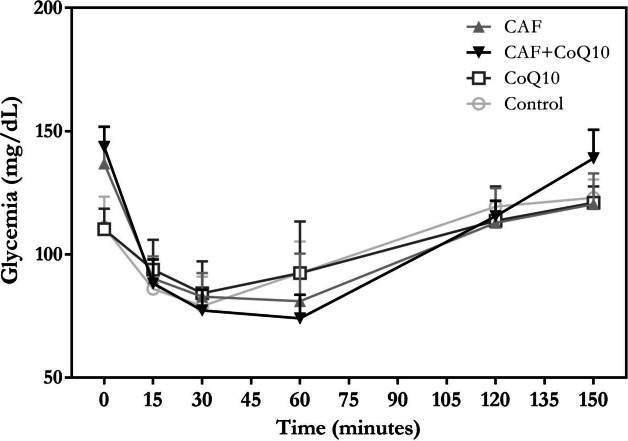
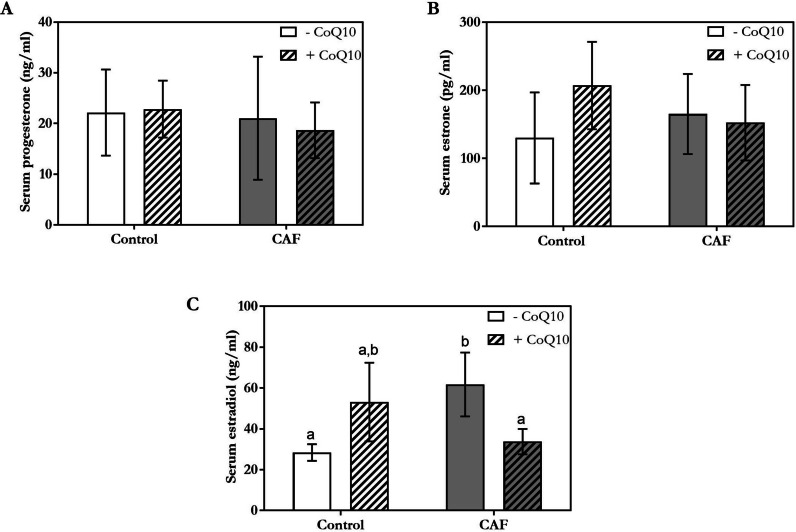
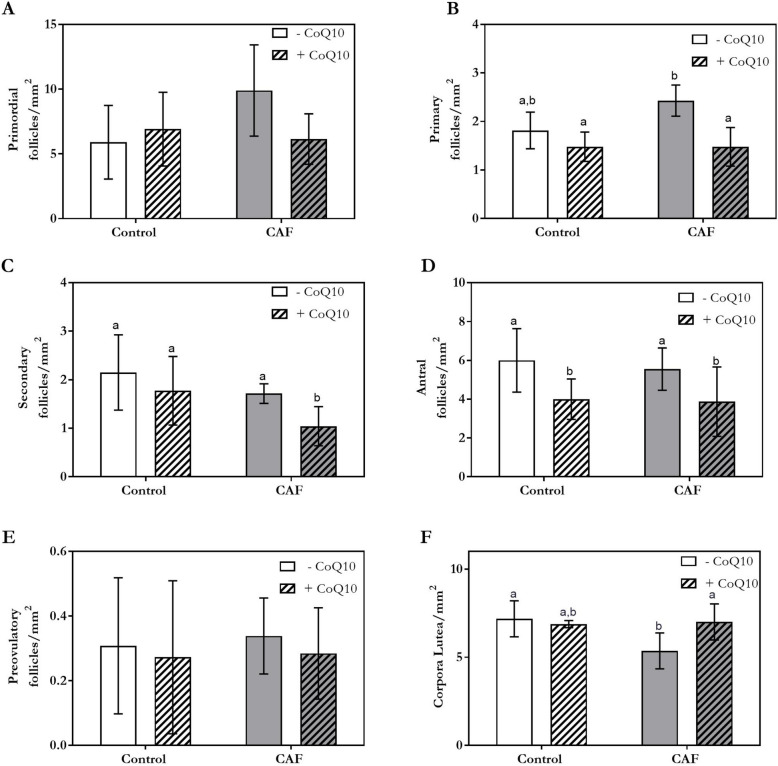
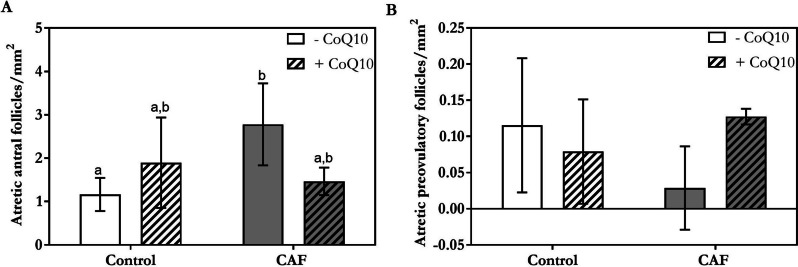
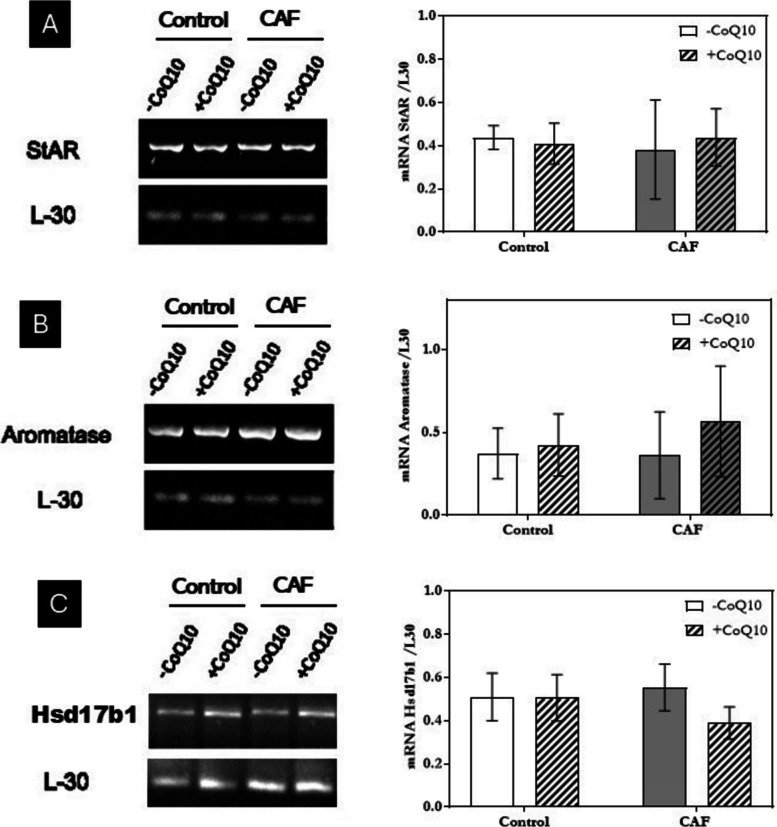
Obesity, a global epidemic, is linked to adverse reproductive outcomes, including infertility and ovulation dysfunction. The cafeteria diet (CAF) serves as an animal model mirroring Western diet habit. Coenzyme Q10 (CoQ10), known for enhancing reproductive outcomes in various pathologies, is not fully understood for its effects on obesity treatment. Here, obesity was modeled using CAF-fed rats to assess CoQ10's impact on metabolic and ovarian disruptions caused by obesity. Wistar rats were divided into control (standard diet) and obese (CAF diet) groups. After 75 days, half of each group received oral CoQ10 (5 mg/kg) for 13 days, while the rest received a vehicle. Animals were euthanized during the estrus phase, and blood and ovaries were collected for analysis. CAF caused increased body weight gain (p < 0.01) associated with hyperglycemia, hypertriglyceridemia, and hypercholesterolemia (p < 0.05). Moreover, it caused a reduction in the number of AMH + follicles (p < 0.001), increasing follicular atresia (p < 0.05) and serum estradiol levels (p < 0.05). Obesity also altered the estrous cycle and reduced the ovulation rate (p < 0.05). CoQ10 administration showed beneficial effects on all ovarian disruptions but had no effect on the metabolic alterations induced by obesity. In summary, CoQ10 could be an additional treatment for obesity-related infertility in patients with normal metabolic profiles. While CoQ10 does not affect metabolic parameters influenced by obesity, crucial for reproductive issues and offspring health, it is recommended as part of a treatment plan that includes a balanced diet and increased physical activity for obese individuals with metabolic alterations seeking pregnancy.
Keywords: Coenzyme Q10; Metabolism; Obesity; Ovulation.
© 2025. The Author(s).
Conflict of interest statement
Declarations. Competing interests: The authors declare no competing interests.
Figures


Similar articles
-
Obesity-induced oocyte mitochondrial defects are partially prevented and rescued by supplementation with co-enzyme Q10 in a mouse model.Hum Reprod. 2016 Sep;31(9):2090-7. doi: 10.1093/humrep/dew181. Epub 2016 Jul 17. Hum Reprod. 2016. PMID: 27432748 Free PMC article.
-
Obesity alters the ovarian glucidic homeostasis disrupting the reproductive outcome of female rats.J Nutr Biochem. 2017 Apr;42:194-202. doi: 10.1016/j.jnutbio.2017.01.003. Epub 2017 Jan 23. J Nutr Biochem. 2017. PMID: 28189918
-
The effect of norepinephrine on ovarian dysfunction by mediating ferroptosis in mice model.Acta Biochim Biophys Sin (Shanghai). 2024 Oct 22;57(4):542-553. doi: 10.3724/abbs.2024187. Acta Biochim Biophys Sin (Shanghai). 2024. PMID: 39439417 Free PMC article.
-
Does coenzyme Q10 supplementation improve fertility outcomes in women undergoing assisted reproductive technology procedures? A systematic review and meta-analysis of randomized-controlled trials.J Assist Reprod Genet. 2020 Oct;37(10):2377-2387. doi: 10.1007/s10815-020-01906-3. Epub 2020 Aug 7. J Assist Reprod Genet. 2020. PMID: 32767206 Free PMC article.
-
The Effects of Coenzyme Q10 Supplementation on Lipid Profiles Among Patients with Metabolic Diseases: A Systematic Review and Meta-analysis of Randomized Controlled Trials.Curr Pharm Des. 2018;24(23):2729-2742. doi: 10.2174/1381612824666180406104516. Curr Pharm Des. 2018. PMID: 29623830
References
-
- World Health Organization. WHO European regional obesity report 2022. 2022; Available from: http://apps.who.int/bookorders.
-
- Khubchandani J, Price JH, Sharma S, Wiblishauser MJ, Webb FJ. COVID-19 pandemic and weight gain in American adults: A nationwide population-based study. Diabetes Metab Syndr. 2022;16(1):102392. https://pubmed.ncbi.nlm.nih.gov/35030452/. Epub 2022 Jan 10. - PMC - PubMed
-
- Barathikannan K, Chelliah R, Rubab M, Daliri EB-M, Elahi F, Kim D-H, et al. Gut Microbiome Modulation Based on Probiotic Application for Anti-Obesity: A Review on Efficacy and Validation. Microorganisms. 2019 [cited 2022 Jul 26];7. Available from: http://www.ncbi.nlm.nih.gov/pubmed/31623075 - PMC - PubMed
-
- Broughton DE, Moley KH. Obesity and female infertility: potential mediators of obesity’s impact. Fertil Steril. 2017;107:840–7 https://pubmed.ncbi.nlm.nih.gov/28292619/. - PubMed
-
- Ding N, Harlow SD, Randolph JF, Loch-Caruso R, Park SK. Perfluoroalkyl and polyfluoroalkyl substances (PFAS) and their effects on the ovary. Hum Reprod Update. 2020;26:724–52 https://pubmed.ncbi.nlm.nih.gov/32476019/. - PMC - PubMed
MeSH terms
Substances
Grants and funding
LinkOut - more resources
Full Text Sources
Medical
