. 2025 Feb 3;7(1):zcaf002.
doi: 10.1093/narcan/zcaf002. eCollection 2025 Mar.

Histone H3E50K remodels chromatin to confer oncogenic activity and support an EMT phenotype

Affiliations

Histone H3E50K remodels chromatin to confer oncogenic activity and support an EMT phenotype

Kirti Sad et al. NAR Cancer. .

Abstract

Sequencing of human patient tumors has identified recurrent missense mutations in genes encoding core histones. We report that mutations that convert histone H3 amino acid 50 from a glutamate to a lysine (H3E50K) support an oncogenic phenotype. Expression of H3E50K is sufficient to transform human cells as evidenced by an increase in cell migration and invasion, and an increase in proliferation and clonogenicity. H3E50K also increases the invasive phenotype in the context of co-occurring BRAF mutations, which are present in patient tumors characterized by H3E50K. H3E50 lies on the globular domain surface in a region that contacts H4 within the nucleosome. We find that H3E50K selectively increases chromatin accessibility and perturbs proximal H3 post-translational modifications including H3K27me3; together these changes to chromatin dynamics dysregulate gene expression to support the epithelial-to-mesenchymal transition. Functional studies using Saccharomyces cerevisiae reveal that, while yeast cells that express H3E50K as the sole copy of histone H3 show sensitivity to cellular stressors, including caffeine, H3E50K cells display some genetic interactions that are distinct from the characterized H3K36M oncohistone yeast model. Taken together, these data suggest that additional H3 mutations have the potential to support oncogenic activity and function through distinct mechanisms that dysregulate gene expression.


Conflict of interest statement

None declared.

Figures

Graphical Abstract
Graphical Abstract
Figure 1.
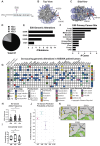
Figure 1.
H3E50 mutation occurs in human cancers. (A) Schematic of H3.3 highlighting the E50 residue within the globular domain. Top (B) and side view (C) of H3E50 and H3K36 within the nucleosome. The nucleosome, including DNA, H3K36, and H3E50, are modeled with PDB 5X7X [36]. (D) Survey of E50 mutation abundance in histone H3 genes encoded in the human genome. (E) Identity of defined H3E50 mutations in human cancers. (F) Survey of H3E50 mutation abundance across human cancer types. (G) Overview of cancer pathology, ploidy score, co-occurring genomic alterations, and total number of genomic alterations in patient tumors characterized by H3E50K variant expression. (H) Variant allele frequency (VAF) of the H3E50 genomic alterations compared with known oncohistones H3K27 and H3K36 observed in patient tumors defined in cBioPortal. One-way ANOVA was performed for statistical significance. (I) Boxplots showing aneuploidy score for patient samples reported in cBioPortal. One-way ANOVA was performed for statistical significance. (J) Logistic regression model demonstrating the probability of cancer diagnosis associated with variants of H3, where 0 = no diagnosis and 1 = cancer diagnosis. (K) In silico modeling of human H3E50, H3D50, and H3K50, using PDB 5X7X [36].
Figure 2.
Figure 2.
H3E50 variant expression increases cell proliferation and clonogenicity. HMECDD cells stably transduced with (A) pBabePuro H3.3-TY1, H3.3K27M-TY1, H3.3K36M, or H3.3E50K or (B) pBabePuro H3.1-HA, H3.1E50K-HA, or H3.1E50D and lysates acid extracted. Lysates were immunoblotted with the indicated antibodies. Representative images shown, n = 3. (C, D) Stable HMECDD cells expressing the indicated H3.3 mutant proteins were seeded and cell proliferation measured over the indicated timecourse, n = 3. (E) HMECDD cells stably transduced with the indicated H3.3 plasmids were seeded and cell clonogenicity measured after 15 days. Representative images are shown. (F) Quantification of panel (E), n = 3. (G) Stable HMECDD cells expressing the indicated H3.1 mutant proteins were seeded and cell clonogenicity measured after 20 days. Representative images are shown. (H) Quantification of panel (G), n = 4.
Figure 3.
Figure 3.
H3E50K expression enhances phenotypes associated with cancer progression. (A) HMECDD cells stably transduced with the indicated H3.3 plasmids were seeded and cell migration through an 8.0 μm filter was measured after 8 h. Representative images are shown. (B) Quantification of panel (A), n = 3. (C) HMECDD cells stably transduced with the indicated H3.3 plasmids were seeded and cell invasion through an 8.0 μm 1 mg/ml matrigel-coated filter was measured after 48 h. Representative images are shown. (D) Quantification of panel (C), n = 2. (E) HMECDD cells stably transduced with the indicated H3.1 plasmids were seeded and cell invasion through an 8.0 μm 1 mg/ml matrigel-coated filter was measured after 48 h. Representative images are shown. (F) Quantification of panel (E), n = 3. (G) A2058 cells stably transduced with the indicated H3.3 plasmids were seeded and cell migration through an 8.0 μm filter was measured after 8 h. Representative images are shown. (H) Quantification of panel (G), n = 3. (I) A2058 cells stably transduced with the indicated H3.3 plasmids were seeded and cell invasion through an 8.0 μm 1 mg/ml matrigel-coated filter was measured after 48 h. Representative images are shown. (J) Quantification of panel (I), n = 3.
Figure 4.
Figure 4.
H3E50K expression perturbs chromatin accessibility, histone modification, and gene expression dynamics. (A) Tornado plots assessing chromatin accessibility in HMECDD cells stably transduced with WT H3.3 or H3.3E50K. Representative plot of the top 30 000 peaks shown of a single biological replicate, n = 3. (B) Genomic distribution of the DARs between HMECDD cells expressing H3.3E50K or WT H3.3. (C) Gene cluster heatmap depicting the distribution of the 5000 most significantly DARs across the genome between HMECDD cells expressing H3.3E50K or WT H3.3, n = 3. (D) Heatmap showing top 25 most differentially accessible transcription factor binding motifs between H3.3E50K and WT H3.3, n = 3. (E) HMECDD cells stably transduced with the indicated plasmids and histone lysates were acid extracted as described in ‘Materials and methods’ section. For each sample, 40 μg of lysates was immunoblotted with the indicated antibodies. Representative images are shown. (F) Quantification of panel (E) for the following modifications: H3K4, H3K27, H3K36, H3K56ac, and H3K79me3, n = 3. All results shown are normalized to the WT H3.3, which was set to 1.0. (G) Tornado plots representing promoter-associated H3K27me3 via CUT&Tag in HMECDD cells stably expressing WT H3.3 or H3.3E50K. Merged plot of two biological replicates are shown.
Figure 5.
Figure 5.
H3E50K supports an EMT gene expression program. (A) Gene cluster heatmap of HMECDD H3.3-TY1 and HMECDD H3.3E50K-TY1 cells from RNA-seq data showing differentially expressed genes. Z scores with normalized read counts were used for heatmap representation, n = 2. (B) FGSEA depicting upregulated or downregulated hallmark pathways from HMECDD H3.3E50K-TY1 cells compared with HMECDD H3.3-TY1 cells. (C) Enhanced volcano plot depicting significantly differentially expressed genes between HMECDD H3.3-TY1 cells and HMECDD H3.3E50K-TY1 cells, where P ≤ .05 (blue) and log2fold change ≥ 1.5 (red). (D) Normalized read counts of indicated EMT-associated genes that are upregulated in HMECDD H3.3E50K-TY1 cells compared with H3.3-TY1. (E) HMECDD cells stably transduced with the indicated plasmids and proteins extracted. Thirty micrograms of lysates were immunoblotted with the indicated antibodies. Representative images are shown, n = 2. (F) Quantification of the protein levels shown in panel (E) normalized to actin as a loading control.
Figure 6.
Figure 6.
Chromatin changes underlie an H3E50K-associated EMT transcriptional program. (A) Tornado plot assessing differential accessibility of genes and regulatory regions associated with EMT. Representative plots are shown, n = 3. (B) Tornado plots representing promoter-associated H3K27me3 at EMT genomic loci via CUT&Tag in HMECDD cells stably expressing WT H3.3 or H3.3E50K. Representative plots are shown, n = 3. (C) Scatterplot depicting integration of RNA-seq differential gene expression and ATAC-seq differential accessibility. (D) Integrative genomics viewer (IGV) tracks from ATAC-seq, H3K27me3 CUT&Tag, and RNA-seq of selected EMT-associated genes.
Figure 7.
Figure 7.
H3E50K S. cerevisiae exhibit restricted growth phenotypes via distinct mechanisms from H3K36M. (A) In silico modeling of S. cerevisiae H3E50, H3E50K, H3E50D, H3E50R, and H3E50A harboring possible PTMs, using PDB 1ID3 [37]. (B) Insilico modeling of H. sapiens E50R and E50A, using PDB 5X7X [36]. (C) Serial dilution spotting assays of S. cerevisiae cells expressing the yeast H3 homologue HHT2 containing the indicated mutation were grown on normal media (YEPD) or media containing cellular stressors – 18 μg/ml camptothecin, 6 μg/ml bleomycin, or 15 mM caffeine – for 2–5 days. Representative images are shown, n = 3. (D) Serial dilution spotting assays of S. cerevisiae cells expressing the yeast H3 homologue hht2 containing the indicated mutation in the absence of HHT1 were grown on normal media (YEPD) or media containing cellular stressors – 18 μg/ml camptothecin, 6 μg/ml bleomycin, or 15 mM caffeine – for 2–5 days. Representative images are shown, n = 3. (E) Lysates acid extracted from S. cerevisiae cells of the indicated genotypes were immunoblotted with the indicated antibodies. Representative images are shown, n = 3. (F) Quantification of panel (E). Signals were normalized to H3 and PGK1 levels.

Update of

References

    1. Cancer Genome Atlas Network Comprehensive genomic characterization of head and neck squamous cell carcinomas. Nature. 2015; 517:576–82.10.1038/nature14129. - DOI - PMC - PubMed
    1. Cancer Genome Atlas Research Network Ley TJ, Miller C et al. . Genomic and epigenomic landscapes of adult de novo acute myeloid leukemia. N Engl J Med. 2013; 368:2059–74. - PMC - PubMed
    1. Cancer Genome Atlas Research Network Weinstein JN, Collisson EA et al. . The Cancer Genome Atlas Pan-Cancer analysis project. Nat Genet. 2013; 45:1113–20.10.1038/ng.2764. - DOI - PMC - PubMed
    1. Berger MF, Mardis ER The emerging clinical relevance of genomics in cancer medicine. Nat Rev Clin Oncol. 2018; 15:353–65.10.1038/s41571-018-0002-6. - DOI - PMC - PubMed
    1. Gnad F, Doll S, Manning G et al. . Bioinformatics analysis of thousands of TCGA tumors to determine the involvement of epigenetic regulators in human cancer. BMC Genomics. 2015; 16(Suppl 8):S5.10.1186/1471-2164-16-S8-S5. - DOI - PMC - PubMed