. 2025 Feb 3;9(2):e70071.
doi: 10.1002/hem3.70071. eCollection 2025 Feb.

Dynamic evolution of TCF3-PBX1 leukemias at the single-cell level under chemotherapy pressure

Affiliations

Dynamic evolution of TCF3-PBX1 leukemias at the single-cell level under chemotherapy pressure

Mira Kusterer et al. Hemasphere. .

Abstract

Acute lymphoblastic leukemia (ALL) is the most common childhood cancer. The translocation t(1;19), encoding the TCF3-PBX1 fusion, is associated with intermediate risk and central nervous system (CNS) infiltration at relapse. Using our previously generated TCF3-PBX1 conditional knock-in mice, we established a model to study relapsed clones after in vivo chemotherapy treatment, CNS infiltration, and clonal dynamic evolution of phenotypic diversity at the single cell-level using next-generation sequencing technologies and mass cytometry. Mice transplanted with TCF3-PBX1 + leukemia cells and treated with vehicle succumbed to disease, whereas 40% of treated mice with prednisolone or daunorubicin survived. Bulk and single-cell RNA sequencing of FACS-sorted GFP+ cells from TCF3-PBX1 + leukemias arising after chemotherapy treatment revealed that apoptosis, interleukin-, and TGFβ-signaling pathways were regulated in CNS-infiltrating leukemic cells. Across tissues, upregulation of the MYC signaling pathway was detected in persisting leukemic cells and its downregulation by BRD3/4 inhibition increased sensitivity to chemotherapy. In TCF3-PBX1+ leukemia cells collected after chemotherapy treatment, mass cytometry identified increased phosphorylation of STAT3/5 upon preBCR stimulation, which was susceptible to inhibition by the proteasome inhibitor bortezomib. In summary, we developed a TCF3-PBX1+ ALL mouse model and characterized relapsed disease after in vivo chemotherapy and cell phenotype dependence on microenvironment. Transcriptomics and phospho-proteomics revealed distinct pathways that may underlie chemotherapy resistance and might be suitable for pharmacological interventions in human ALL.


Conflict of interest statement

The authors declare no conflicting financial interest with the submission of this article. Jesús Duque‐Afonso received speakers honoraria from Roche, Amgen, Riemser, SOBI, IPSEN, Abbvie, Beigene, NovoNordisk, and AstraZeneca and travel support from Lilly, Roche, Gilead, IPSEN, SOBI, and Beigene.

Figures

Figure 1
Figure 1
Establishment of an in vivo mouse model to study relapsed disease after chemotherapy exposure depending on leukemia niche. (A) Schematic illustration of experimental setup. Mice were sublethally irradiated and transplanted with 1000 GFP+/TCF3‐PBX1+ leukemic cells. After engraftment, on Day 7, the mice were divided into three treatment groups: prednisolone, daunorubicin, and vehicle. Mice were treated i.p. for 20 days. After treatment, mice were monitored regularly and sacrificed when showing symptoms of leukemic disease. Isolated tissues were analyzed. (B) The Kaplan–Meier curve shows that 40% of the prednisolone‐(n = 11) or daunorubicin‐(n = 14) treated mice survive at least 270 days. Vehicle‐treated mice (n = 13) died after a median survival of 62 days (log‐rank test, p < 0.05). The experiment was performed three times with cohorts of five mice in each treatment group. Two vehicle‐treated, four prednisolone‐treated, and one daunorubicin‐treated mice died of toxicity of the treatment or without leukemia cells and were excluded from final analysis. (C) Blood smear showing morphology of lymphoblasts from mouse TCF3‐PBX1+ leukemias (May–Grünwald Giemsa staining). (D) Hematoxylin and eosin staining of histological sections shows infiltration of TCF3‐PBX1+ leukemia cells in central nervous system tissues (cortex, choroid plexus, and spinal cord) compared to a wild‐type control. Gy, gray; i.p., intraperitoneal; MGG, May–Grünwald Giemsa.
Figure 2
Figure 2
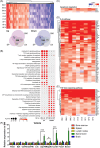
Transcriptomic changes across tissue microenvironments in GFP + TCF3‐PBX1 + cells by bulk RNA sequencing. (A) Differentially expressed genes in GFP+ TCF3‐PBX1 + leukemia cells infiltrating SC compared to BM, SP, and LNs with a p < 0.05 and log fold change (FC) > 0.6. Heatmap illustrating the gene expression level as log FC (e.g., tones of red indicate upregulation in SC, tones of blue downregulation in SC, no row scaling was used). Venn diagram displays common up and downregulated genes of SC‐infiltrating leukemic cells. GFP+ TCF3‐PBX1+ leukemic cells were isolated and FACS‐sorted from specific organs from three different moribund mice from each treatment group. (B) Enrichment of biological top 10 processes in SC versus other tissues shown as dot plot. Size of the dot corresponds to the number of genes from the gene set and ‐log10 FDR value is shown in color, see also Supporting Information S1: Table S1. (CE) Heatmaps illustrating the gene expression level as log FC (see Figure 2A) from apoptosis regulating genes and Enrichr Bioplanet upregulated pathways: IL2 and TGF‐beta signaling. (F) Bar graph shows relative expression of genes in GFP + TCF3‐PBX1+ leukemic cells isolated from specific tissues and compared to BM in vehicle‐treated mice quantified by RTqPCR. ΔΔC T method and a two‐sided Mann–Whitney test were used for statistical analysis. N, is depicted in the graph for each tissue as biological replicate. Each measurement by RT‐qPCR was performed in technical triplicate. Error bars show the standard deviation. *p < 0.05; ***p < 0.001. BM, bone marrow; LN, lymph nodes; SC, spinal cord; SP, spleen.
Figure 3
Figure 3
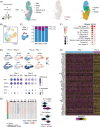
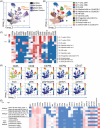
Single‐cell transcriptomic analysis distinguishes transcriptional and genetic heterogeneity within each tissue. (A) Left panel, Overview of the experimental setup for scRNAseq. Tissues from representative euthanized TCF3‐PBX1+ mice are isolated and cells fixed in formaldehyde before acquisition. Middle and right panel, Vehicle‐treated tissues are shown on the UMAP plot. The predominant leukemic cells cluster together, while healthy blood cells, for example, myeloid cells and T‐cells cluster separately. Colors correspond to different tissues (left) and PTPN11 mutation status (middle) and cell cycle phase (right). (B) Cell cycle phase in BM vehicle sample shown on UMAP (refer to Supporting Information S1: Figure 8 for CNS, LN, and SP). (C) Two distinct phenotypes across tissues in vehicle‐treated samples. Two phenotypes are indicated on BM UMAP (left) and their proportions compared across tissues (right). (D) Upper panels, Phenotype 1 and 2 specific genes visualized on UMAPs (red color indicates higher expression, note cells in order of expression). Lower panels, Dotplot heatmap shows expression levels of phenotype specific genes (average expression level is indicated by tones of blue and dot sized represents percentage of cells expressing each gene). (E) Copy number estimates: Heatmap shows Log ratio to non‐leukemic cells separated by chromosome for BM G1‐phase cell (left). Blue denotes lower and red higher log ratio relative to reference nonleukemic cells (indicated in green). Violin plot shows LogRatio for chr 4 and chr 6 (right) comparing non‐leukemic, Phe1, and Phe2 cells. (F) Dotplot visualization from Enrichment of biological top 10 upregulated processes (MSigDB Hallmark adj. p < 0.1) in vehicle‐treated BM samples opposing the two phenotypes, see also Figure 2B and Supporting Information S1: Table S2. (G) Heatmap visualization of Myc targets and metabolic pathway genes (oxidative Phosphorylation and mTORC1 Signaling) from vehicle BM. Colors correspond to two different phenotypes (tones of violet indicate low‐level expression, tones of yellow high level). BM, bone marrow; CNS, central nervous system (spinal cord and brain); LN, lymph nodes; Myel, myeloid cells; Phe 1, phenotype 1; Phe 2, phenotype 2; SP, spleen; T ly, T‐lymphocytes. Number of cells analyzed is indicated below figure panels.
Figure 4
Figure 4
Myc active phenotype becomes predominant after chemotherapy pressure. (A) UMAP shows clustering across samples for cells in G1 cell cycle phase. Color denotes treatment group. (B) Phenotype labels indicated by color on the UMAP (left). BM vehicle cells were used as reference cells in label transfer. (C) Phenotype label proportion plot for all cells in treated samples (right). (D) Dotplot visualization from pathway enrichment analysis (dot size: number of genes; color: term significance). Enriched terms corresponding to upregulated genes (MSigDB Hallmark) in each treatment (daunorubicin or prednisolone) are shown comparing BM and CNS tissue, see also Supporting Information S1: Table S2. (E) Left upper panel, heatmap represents reduction of clonogenicity by the combination treatment of low‐dose JQ1 and prednisolone compared to vehicle‐treated TCF3‐PBX1+ leukemia cells. Right upper and left lower panels, titration curves represent CFA of TCF3‐PBX1+ leukemia cells treated with a combination of JQ1 and prednisolone. JQ1 reduced the IC50 of prednisolone significantly (p = 0.0003). Data show the IC50 calculated using nonlinear regression analysis and curves were compared with the sum‐of‐squares F test. Dose‐response curves of each JQ1 concentration were compared to the dose‐response curve of the vehicle‐treated cells as controls (n = 3). Error bars represent the standard deviation. Lower right panel, bliss interaction index between JQ1 and prednisolone is shown. ns not significant; **p < 0.01; ***p < 0.001. dauno, daunorubicin; Phe 1, phenotype 1; Phe 2, phenotype 2; predni, prednisolone.
Figure 5
Figure 5
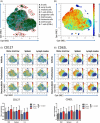
Clonal dynamics of TCF3‐PBX1 + leukemias at the protein level by single‐cell mass cytometry (CyTOF) in different tissues under chemotherapy pressure. (A) Opt‐SNE visualization of unstimulated samples reveals large cluster of GFP+ leukemic cells in the middle of the panel along with smaller clusters of healthy blood cells (GFP‐negative), for example, B‐cells, T‐cells, and myeloid cells in the periphery. Tissues BM, SP, and LN from a representative mouse from each treatment group are shown (n = 9 samples). Each color represents a different sample. Clustering does not differ in between the samples. (B) Opt‐SNE visualization of heterogeneous GFP expression of unstimulated TCF3‐PBX1 + leukemic cells. (C, D) Some examples from regulated proteins depending on treatment and/or microenvironment are shown. (C) Upper panel, opt‐SNE visualization of the upregulated expression of the IL7‐receptor (CD127) and (D) SELL (CD62L) after treatment with prednisolone and daunorubicin. TCF3‐PBX1 + leukemia cells from lymph nodes show a decreased expression of CD127 but an increased expression of CD62L. (C, D) Lower panels show the quantification of protein expression depending on treatments (vehicle, prednisolone, daunorubicin) and microenvironments (BM, SP, LN). Bars represent the mean expression and error bars the standard deviation. Statistics are calculated using a two‐sided Mann–Whitney test. BM, bone marrow; Dauno, Daunorubicin; Predni, Prednisolone; LN, lymph nodes; SP, spleen; Vehi, Vehicle.
Figure 6
Figure 6
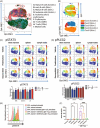
Activation of signaling pathways of TCF3‐PBX1 + leukemias upon preBCR stimulation at the protein level in different tissues under chemotherapy pressure. (A) Opt‐SNE visualization of unstimulated and preBCR‐stimulated (IgM + H2O2) cells. TCF3‐PBX1 + leukemia cells from unstimulated and preBCR‐stimulated samples cluster together in the middle with a concentration of stimulated cells in the top half and unstimulated cells in the lower half of the panel. Healthy cells (GFP negative) including early and mature B‐cells, cluster in the periphery. Tissues BM, SP, and LN from a representative mouse from each treatment group with and without preBCR stimulation are shown (n = 18 samples). Each color represents a different sample. Clustering does not differ in between the samples. (B) Upper panel, opt‐SNE diagram shows GFP expression. Heterogeneous GFP expression in TCF3‐PBX1 + leukemia cells does not differ between stimulation conditions. Lower panel, FlowSOM Clustering identifies three major clusters of leukemic cells after gating for GFP+ cells only: Cluster 1 represents the unstimulated cells. Cluster 2 and 3 divide the stimulated samples, with Cluster 3 being predominant. (C) Upper panel, phosphorylation of STAT3 after preBCR stimulation is increased in Cluster 3 in all analyzed tissues (BM, SP, and LN) after treatment with prednisolone or daunorubicin compared to vehicle treatment. (D) Upper panel, phosphorylation of PLCG2 after preBCR stimulation is increased in Cluster 3 in LN compared to BM and SP. No differences of pPLCG2 after preBCR stimulation were observed after treatments. (C, D) Lower panels show the quantification of protein expression depending on treatments (vehicle, prednisolone, daunorubicin) and microenvironments (BM, SP, LN). Bars represent the mean expression and error bars the standard deviation. Statistics are calculated using a two‐sided Mann–Whitney test. (E) STAT3‐phosphorylation is assessed in vitro in unstimulated and preBCR stimulated TCF3‐PBX1 + cells (M159) after pretreatment with bortezomib at different concentrations by phosphoFlow. Median Fluorescence Intensity (MFI) of pSTAT3‐PE is visualized as histograms. (F) Relative MFI to DMSO is shown (n = 4), statistical analysis is performed by one‐way analysis of variance. Bars represent the mean and error bars represent the standard deviation. ns, not significant; ***p < 0.0002, ****p < 0.0001. BM, bone marrow; Borte, Bortezomib; Dauno, Daunorubicin; LN, lymph nodes; Predni, Prednisolone; SP, spleen; Vehi, Vehicle.
Figure 7
Figure 7
Activation of signaling pathways in bone marrow cells from wild‐type mice upon preBCR stimulation at the protein level. (A) UMAP visualization of unstimulated and preBCR‐stimulated (IgM + H2O2) samples of bone marrow and SP from two pooled wild‐type mice symmetrically opposed. (B) FlowSOM Clustering identifies 11 different clusters including B‐, T‐, NK‐, myeloid, and progenitor cells. (C) Heatmap shows surface and intracytoplasmatic protein expression of clusters identified via FlowSOM Clustering. Related clusters of opposing stimulation conditions cluster next to each other. (D) UMAP visualization of surface, intracytoplasmatic, and phospho‐protein expression in clusters define cellular populations depending on tissue (BM, SP) and preBCR stimulation. Of note, expression of pZAP70/pSYK and pERK after preBCR stimulation and PAX5 is weaker in healthy pro B‐ and mature B‐cells compared to TCF3‐PBX1 + leukemia cells (see Supporting Information S1: Figure 21). (E) Heatmap reveals differences in median protein expression in bone marrow between mature B cells¹ from leukemic mice (Cluster A), early and mature B cells² from wildtype mice (Cluster 03 and 11) and TCF3‐PBX1 + leukemic cells as can be seen in mass spectrometry. BM, bone marrow; SP, spleen; Stim, preBCR‐stimulated; Unstim, unstimulated.

References

    1. Inaba H, Mullighan CG. Pediatric acute lymphoblastic leukemia. Haematologica. 2020;105:2524‐2539. 10.3324/haematol.2020.247031 - DOI - PMC - PubMed
    1. Jeha S, Pei D, Choi J, et al. Improved CNS control of childhood acute lymphoblastic leukemia without cranial irradiation: St Jude Total Therapy Study 16. J Clin Oncol. 2019;37:3377‐3391. 10.1200/JCO.19.01692 - DOI - PMC - PubMed
    1. Locatelli F, Zugmaier G, Rizzari C, et al. Effect of blinatumomab vs chemotherapy on event‐free survival among children with high‐risk first‐relapse B‐cell acute lymphoblastic leukemia: a randomized clinical trial. JAMA. 2021;325:843‐854. 10.1001/jama.2021.0987 - DOI - PMC - PubMed
    1. O'Brien MM, Ji L, Shah NN, et al. Phase II trial of inotuzumab ozogamicin in children and adolescents with relapsed or refractory B‐cell acute lymphoblastic leukemia: Children's Oncology Group Protocol AALL1621. J Clin Oncol. 2022;40:956‐967. 10.1200/JCO.21.01693 - DOI - PMC - PubMed
    1. Myers RM, Li Y, Barz Leahy A, et al. Humanized CD19‐targeted chimeric antigen receptor (CAR) T cells in CAR‐naive and CAR‐exposed children and young adults with relapsed or refractory acute lymphoblastic leukemia. J Clin Oncol. 2021;39:3044‐3055. 10.1200/JCO.20.03458 - DOI - PMC - PubMed

LinkOut - more resources