. 2025 Apr;19(4):1075-1091.
doi: 10.1002/1878-0261.13816. Epub 2025 Feb 4.

Stroma gene signature predicts responsiveness to chemotherapy in pancreatic ductal adenocarcinoma patient-derived xenograft models

Affiliations

Stroma gene signature predicts responsiveness to chemotherapy in pancreatic ductal adenocarcinoma patient-derived xenograft models

Alessia Anastasia et al. Mol Oncol. 2025 Apr.

Abstract

Despite many efforts to understand the molecular mechanisms of pancreatic ductal adenocarcinoma (PDAC) treatment resistance, there is still no reliable method for selecting patients who could benefit from standard pharmacological treatment. Here, four PDAC patient-derived xenografts (PDAC-PDXs) with different responses to gemcitabine plus nab-paclitaxel (nanoparticle albumin-bound paclitaxel) were studied to dissect the contribution of both tumor and host microenvironment to treatment response. PDAC-PDXs transplanted into the pancreas of immunodeficient mice retained the main genetic and histopathological characteristics of the original human tumors, including invasiveness and desmoplastic reaction. Response to chemotherapy was associated with a specific 294 stroma gene signature and was not due to the intrinsic responsiveness of tumor cells or differences in drug delivery. Human dataset analysis validated the expression of the 294 stroma gene signature in PDAC clinical samples, confirming PDAC-PDXs as a useful tool to study the biology of tumor-host interactions and to test drug efficacy. In summary, we identified a stroma gene signature that differentiates PDAC-PDXs that are responsive to gemcitabine plus Nab-paclitaxel treatment from those that are not, confirming the active role of the tumor microenvironment in the drug response.

Keywords: pancreatic cancer; patient‐derived xenografts; stroma signature; treatment response.


Conflict of interest statement

The authors declare no conflict of interest.

Figures
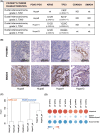
Fig. 1
Fig. 1
Molecular and histological characterization of orthotopic pancreatic ductal adenocarcinoma patient‐derived xenograft (PDAC‐PDXs: Hupa4, Hupa8, Hupa11, and Hupa13). (A) Tumor features and mutational status of KRAS, TP53, CDKN2A, and SMAD4 genes. ND: Gene/transcript not detectable [i.e., unable to amplify any of the four CDKN2A exons (1a, 1b, 2 and 3) and the SMAD4 mRNA]. wt, wild‐type. (B) Representative images of PDAC‐PDX tumors immunostained for P16/INK4 and SMAD4. Scale bar: 200 μm. For each PDAC‐PDX, three replicates were evaluated. (C) Unsupervised hierarchical clustering of global gene expression of human tumor compartments. The dendrogram presents the relationship of similarity among the global gene expression profiles of each PDAC‐PDX (average of normalized gene expression data of three replicates) across different in vivo passages (P2 and P4). Euclidean distance as distance metric and Ward's as clustering method were used. (D) Subtype classification of PDAC‐PDXs. Centroids were calculated for samples from each class of the Collisson dataset, and then, the Pearson correlation was calculated between centroids and gene expression data from our PDAC‐PDX samples. The correlation matrix shows positive (red dots), or negative (blue dots) correlations with the pancreatic cancer subtypes described by Collisson et al. [13]. Bigger dots correspond to greater positive or negative correlation.
Fig. 2
Fig. 2
Morphology of pancreatic ductal adenocarcinoma patient‐derived xenograft (PDAC‐PDXs) compared with patients' samples. Representative images of hematoxylin–eosin (H&E) staining of patients' tumor (two different magnifications) and the corresponding PDAC‐PDXs at early (P2) and late passages (P4). In the lower panel, tumor xenografts invading the normal pancreatic tissue (highlighted by the asterisks) of the recipient mice are shown. Scale bar: 400 or 100 μm as indicated. For each PDAC‐PDX three replicates were evaluated.
Fig. 3
Fig. 3
High stroma deposition in pancreatic ductal adenocarcinoma patient‐derived xenograft (PDAC‐PDXs). (A) Representative images of PDAC‐PDX tumor staining for hematoxylin–eosin (H&E), for MHC I (HLA, detecting human tumor parenchyma), for Vimentin EPR3776 (Vim EPR3776, recognizing both the human and murine epitopes), and for Vimentin sp20 (Vim sp20, recognizing the human epitope) to visualize murine stroma. Scale bar: 400 μm. (B) Representative staining for H&E, Alcian Blue (for secretory parenchyma) and Sirius Red (to detect fibrosis). Scale bar: 100 μm. For each PDAC‐PDX, three replicates were evaluated.
Fig. 4
Fig. 4
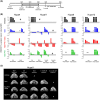
Pancreatic ductal adenocarcinoma patient‐derived xenograft (PDAC‐PDXs) respond differently to the combination of Nab‐PTX and gemcitabine (Gem). (A) Schematic experimental design: tumor fragments of each PDAC‐PDX were implanted into the pancreas of C.B‐17 SCID female mice. When tumors were palpable, magnetic resonance imaging (MRI) was used to evaluate growth. Tumors were randomized at a mean volume of 320 mm3 (Standard Deviation: SD, 152) Hupa4, 200 mm3 (SD 144) Hupa11, 252 mm3 (SD 151) Hupa8, and 233 mm3 (SD 93) Hupa13 to receive the different treatments. Gem and/or Nab‐PTX were injected intravenously at respectively 150 and 25 mg·kg−1. When administered in combination, Nab‐PTX was delivered immediately before Gem. Drugs were given on Days 1 and 8 of each 21‐day cycle, for a total of four cycles. Tumor growth was monitored over time by MRI and tumor volume was calculated. (B) Drug effect is shown as the percentage change in the tumor volume (calculated as described in Section 2) for each mouse, against time. According to the RECIST guidelines , disease is considered progressive if the increase in tumor volume is greater than 20%, stable (gray area in the graphs) if the change is between +20% and −30%, and regressive if the change is lower than −30%. *Single mouse euthanized; # all mice in the experimental group euthanized. NA, not available. (C) Hupa11 representative MRI images. The white lines indicate tumor masses. # All mice in the experimental group euthanized.
Fig. 5
Fig. 5
Contribution of the microenvironment to pancreatic ductal adenocarcinoma patient‐derived xenograft (PDAC‐PDX) responsiveness to chemotherapy. (A, B) Hupa4 tumor fragments were implanted into the pancreas (A) and subcutis (B) in C.B‐17 SCID female mice. Tumor growth was monitored over time by palpation for the intrapancreas tumor and by measurements with Vernier calipers (see Section 2) for the subcutaneous tumor. When subcutis tumors reached 275 mm3 (Standard Deviation: SD, 107) mice were randomized (four to five per group) into treatment, and likewise for the intrapancreas tumor when they were all palpable. Gemcitabine was injected intravenously at the dose of 150 mg·kg−1 on Days 1 and 8 of each 21‐day cycle for two cycles. For both settings, intrapancreas tumor weights (mean ± standard error mean, SEM), with representative images at autopsy (A), and relative tumor volume curves for subcutaneous growth (B) are shown (for each point mean ± SEM is shown). Scale bar: 10 mm. (C) Representative images of hematoxylin and eosin (H&E) staining of intrapancreas and subcutis Hupa4 tumors. Quantitative analysis of Sirius Red staining is shown and data are expressed as the percentage of stained area (mean ± SD, n = 3 for each setting). *P < 0.05, unpaired t‐test. Scale bar: 200 μm.
Fig. 6
Fig. 6
Stroma signature. (A) Heatmap presenting the 294 upregulated genes in murine cancer microenvironment of responsive (Resp) and not responsive (Not Resp) pancreatic ductal adenocarcinoma patient‐derived xenografts (PDAC‐PDXs). Gene Ontology processes and pathways with statistically significant enrichment are reported. (B) Representative images and quantification (mean ± standard error mean, n = 8 for each setting) of immunohistochemical staining for Tenascin‐C and TIMP1 in responsive (Hupa4 and Hupa11) vs not responsive (Hupa8 and Hupa13) PDAC‐PDXs. *P < 0.05, unpaired t‐test. Scale bar: 400 μm. (C) Heatmap presenting the specificity of the stroma signature in a microdissected Pilarsky dataset (E‐MEXP‐950/E‐MEXP‐1121). CPS, pancreatitis fibrotic stroma; NE, normal epithelium; TE, tumor epithelium; TS, tumor stroma. (D) Heatmap of the stroma signature in a ‘whole tissue’ clinical dataset (GSE15471, Badea), confirming the ability to distinguish healthy from tumor tissues. For all four heatmaps, Z‐scores (median‐centered log2 intensity divided by standard deviation) are reported by a red‐to‐blue gradient to indicate up‐ or downregulation for each gene. Unsupervised hierarchical clustering of samples was based on the Z‐scores.
Fig. 7
Fig. 7
Stroma signature in clinical tumor samples. (A, B) Stroma signature in pancreatic ductal adenocarcinoma (PDAC) samples from GSE15471, GSE16515, GSE43795, and GSE32676 clinical datasets (A) and from TCGA (B). Z‐scores (median‐centered log2 intensity values divided by standard deviation) are reported by a red‐to‐blue gradient to indicate levels of up‐ or downregulation for each gene. Unsupervised hierarchical clustering of samples was based on the Z‐scores. In each dataset, the signature separates tumor samples into two main clusters (lilac triangles), according to their high or low expression. (C) High expression of the stroma signature is associated with reduced disease‐free survival and overall survival in the TCGA dataset. Kaplan–Meier curves are presented. Pancreatic cancer patients were stratified into two groups depending on high (75th percentile) or low (25th percentile) mean expression of the stroma signature. Statistical significance was calculated by the log‐rank test between the groups. The disease‐free Kaplan–Meier curve: low expression (n = 35 samples) and high expression (n = 103 samples). The overall survival Kaplan–Meier curve: low expression (n = 45 samples) and high expression (n = 133 samples).

References

    1. Bray F, Laversanne M, Sung H, Ferlay J, Siegel RL, Soerjomataram I, et al. Global cancer statistics 2022: GLOBOCAN estimates of incidence and mortality worldwide for 36 cancers in 185 countries. CA Cancer J Clin. 2024;74:229–263. 10.3322/caac.21834 - DOI - PubMed
    1. Vincent A, Herman J, Schulick R, Hruban RH, Goggins M. Pancreatic cancer. Lancet. 2011;378:607–620. 10.1016/S0140-6736(10)62307-0 - DOI - PMC - PubMed
    1. Rawla P, Sunkara T, Gaduputi V. Epidemiology of pancreatic cancer: global trends, etiology and risk factors. World J Oncol. 2019;10:10–27. 10.14740/wjon1166 - DOI - PMC - PubMed
    1. Von Hoff DD, Ervin T, Arena FP, Chiorean EG, Infante J, Moore M, et al. Increased survival in pancreatic cancer with nab‐paclitaxel plus gemcitabine. N Engl J Med. 2013;369:1691–1703. 10.1056/NEJMoa1304369 - DOI - PMC - PubMed
    1. Nevala‐Plagemann C, Hidalgo M, Garrido‐Laguna I. From state‐of‐the‐art treatments to novel therapies for advanced‐stage pancreatic cancer. Nat Rev Clin Oncol. 2020;17:108–123. 10.1038/s41571-019-0281-6 - DOI - PubMed

MeSH terms