. 2025 Feb 11;122(6):e2414230122.
doi: 10.1073/pnas.2414230122. Epub 2025 Feb 4.

Human MAIT cell response profiles biased toward IL-17 or IL-10 are distinct effector states directed by the cytokine milieu

Affiliations

Human MAIT cell response profiles biased toward IL-17 or IL-10 are distinct effector states directed by the cytokine milieu

Caroline Boulouis et al. Proc Natl Acad Sci U S A. .

Abstract

Mucosal-associated invariant T (MAIT) cells are unconventional T cells that mediate rapid antimicrobial immune responses to antigens derived from microbial riboflavin pathway metabolites presented by the evolutionarily conserved MR1 molecules. MAIT cells represent a large pre-expanded T cell subset in humans and are involved in both protective immunity and inflammatory immunopathology. However, what controls the functional heterogeneity of human MAIT cell responses is still largely unclear. Here, combining functional and transcriptomic analyses, we investigate how MAIT cell response programs are influenced by the cytokine milieu at the time of antigen recognition. Activation by MR1-presented antigen together with IL-12 induces intermediate levels of IFNγ and TNF, as well as a regulatory profile with substantial IL-10 production and elevated expression of TIM-3, LAG-3, and PD-1. Activation by the combination of antigen and IL-12 induces a c-MAF-dependent program required for IL-10 production. The MAIT cell-derived IL-10 mediates both autocrine and paracrine immune regulation. In contrast, coactivation of MAIT cells with IL-18 induces IL-17, GM-CSF, IFNγ, and TNF, without IL-10. Notably, IL-18 dominantly counteracts IL-10 expression. The activation states biased toward IL-10 or IL-17 production are reversible and do not represent stable subsets. Finally, MR1-restricted TCR-mediated activation without cytokine coactivation drives primarily granzyme B cytolytic arming. Altogether, these findings demonstrate that human MAIT cells adapt their functional effector response during antigen recognition to cytokine cues in the microenvironment, and identify programs biased toward either regulatory c-MAF-dependent IL-10 expression, or an inflammatory IL-17 and GM-CSF profile.

Keywords: IL-10; MAIT cells; MR1; T cells; human.


Conflict of interest statement

Competing interests statement:The authors declare no competing interest.

Figures
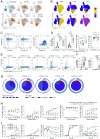
Fig. 1.
Fig. 1.
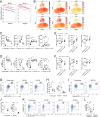
Quality of the antigen-specific MAIT cell response influenced by the cytokine microenvironment. (A) UMAP of total MAIT cells (gray) with unstimulated (blue) and stimulated overlays (orange) (n = 6). Data acquired by flow cytometry. (B) UMAP of total MAIT cells showing the protein expression of the indicated markers. Representative flow cytometry plots (C) and summary data (D) of MAIT cell expression of IFNγ (n = 14 to 19), TNF (n = 14 to 19), GzmB (n = 14 to 19), and CD107a degranulation (n = 6 to 12) upon the indicated stimulations. Representative flow cytometry plots (E) and summary data (F) of MAIT cells IL-10 (n = 18 to 24) and IL-17A (n = 16 to 21) production upon the indicated stimulations. (G) Polyfunctionality profile of MAIT cell functions at the indicated stimulations (n = 6) in terms of numbers of functions (pie slice) and the type of cytokine (arc). (H) Percentage of IL-10, IL-17A, TNF, GzmB, and IFNγ expression by MAIT cells in PBMC over a range of cytokine concentrations (n = 6). For the IL-12+IL-18 costimulation, IL-12 was used at 10 ng/mL while IL-18 concentration varied. (I) Kinetics of IL-10, IL-17A, TNF, GzmB, and IFNγ expression in MAIT cells at the indicated stimulation and time (n = 2). The MAIT cell stimulation was performed with the THP-1/Vα7.2+ cell coculture for 24 h unless stated otherwise. The line and error bar represent mean and SE. Kruskal–Wallis test followed by Dunn’s multiple comparison. * P < 0.05, ** P < 0.01, *** P < 0.001, **** P < 0.0001.
Fig. 2.
Fig. 2.
MAIT cell transcriptional response profile is shifted by the cytokine milieu. Representative flow cytometry plots (A) and summary data (B) of in situ hybridization of IL10 mRNA and IL17A mRNA in MAIT cells stimulated with 5-OP-RU+IL-12 or 5-OP-RU+IL-18 (n = 2 to 6 by time point). (C) UMAP of MAIT cell transcriptome colored by the Leiden clusters at 0.5 resolution (Upper) or by the kind of stimulation (Lower). (D) Proportion from the two donors in each cluster (Upper) and proportion of the type of stimulation in each cluster (Lower). (E) Heatmap of the 10 top differentially expressed genes (DEG) in each stimulation with log fold change >1. (F) UMAP of the MAIT cell transcriptome showing the expression of IL10, IL17A, IL17F, IFNG, TNF, and GZMB. (G) Venn diagram of the up-regulated DEG of each stimulation against the other conditions. (H) Dot plots of the transcripts found using DGE comparing each stimulation to 5-OP-RU alone with log fold changes >0.5 and adjusted P < 0.05. The color bar was centered to 0 by setting the minimum and maximum value to −3 and 3 respectively. The MAIT cell stimulation was performed with the THP-1/Vα7.2+ cell coculture for 14 h in (CH), or at the indicated time (A and B). The lines and error bars represent mean and SE.
Fig. 3.
Fig. 3.
MAIT cells producing IL-10 display a regulatory profile. (A) Dot plot of the top 30 genes with log fold change >0.5 and adjusted P < 0.05 in the IL10 positive and negative cells. (B) UMAP of the MAIT cell transcriptome highlighting expressions of HAVCR2, GZMH, METRNL, FURIN, FASLG, CSF1, CCR1, CXCR6, CCR5, SELPLG, TNIP3, and PRDM1. Representative flow cytometry plots (C) and summary data (D) of TIM-3, LAG-3, and PD-1 expression in MAIT cells upon the different stimulations (n = 8 to 12). Representative flow cytometry plots (E) and summary data of IL-10, IL-17A, and TNF secretion in MAIT cells expressing TIM-3 (F), LAG-3 (G), or PD-1 (H) or not at the indicated stimulation (n = 5 to 10). The MAIT cell stimulation was performed with the THP-1/Vα7.2+ cell coculture for 14 h in (A and B), and 24 h in (C–H). Lines and error bars represent mean and SE. Kruskal–Wallis test (D) Wilcoxon test (FH). * P < 0.05, ** P < 0.01, *** P < 0.001, **** P < 0.0001.
Fig. 4.
Fig. 4.
IL-17A-producing MAIT cells display an inflammatory profile. (A) Dot plot of the top 30 genes with log fold change >0.5 and adjusted P < 0.05 in the IL17A positive and negative cells, or (B) in the IL17F positive and negative cells. (C) UMAP of the MAIT cell transcriptome showing expression of CCL20, CSF2, LGALS3, IL23A, REL, and CD82. Representative flow cytometry plots (D) and summary data (E) of GM–CSF expression in MAIT cells upon the different stimulations (n = 6). Representative flow cytometry plots (F) and summary data (G) of lymphotoxin α expression in MAIT cells upon the different stimulations (n = 6). The MAIT cell stimulation was performed with the THP-1/Vα7.2+ cell coculture for 14 h in (AC), and 24 h in (DG). Lines and error bars represent mean and SE. Friedman test followed by Dunn’s multiple comparison. * P < 0.05, ** P < 0.01, *** P < 0.001.
Fig. 5.
Fig. 5.
c-MAF is required for IL-10 production in MAIT cells. (A) Regulon specificity score in the IL10 positive or negative cells. (B) UMAP of the MAIT cell transcription showing the gene expression of the transcription factors MAF, CREM, CEBPB, ETS1, IKZF1, and BATF. Flow cytometry summary data of the levels (C) and percentage (D) of the transcription factors c-MAF, Aiolos, BATF, and RORγt in MAIT cells upon the indicated stimulation in PBMC (n = 6). (E) Expression of c-MAF, Aiolos, or BATF in IL-10+ or IL-10 MAIT cells (n = 6), or (F) in IL-17A+ or IL-17A-MAIT cells (n = 5). (G) Representative flow cytometry plots, and (H) mean fluorescence and percentage of c-MAF in MAIT cells after MAF or control knockout and stimulated with 5-OP-RU+IL-12 (n = 6). (I) Representative flow cytometry plots, and (J) mean fluorescence and percentage of Aiolos in MAIT cells after IKZF3 or control knockout and stimulated with 5-OP-RU+IL-12 (n = 6). (K) Representative flow cytometry plots, and (L) percentage of IL-10 in MAIT cells after MAF, IKZF3, or control knockout and stimulated with 5-OP-RU+IL-12 (n = 6). The MAIT cell stimulation was performed with the THP-1/Vα7.2+ cell coculture for 14 h in (A and B) and 24 h in (CL). Lines and error bars represent mean and SE. Friedman test followed by Dunn’s multiple comparison (C, D, H, and L). Wilcoxon test (E, F, and J). * P < 0.05, ** P < 0.01, *** P < 0.001, **** P < 0.0001.

References

    1. Dusseaux M., et al. , Human MAIT cells are xenobiotic-resistant, tissue-targeted, CD161hi IL-17-secreting T cells. Blood 117, 1250–1259 (2011). - PubMed
    1. Kammann T., et al. , MAIT cell heterogeneity across paired human tissues reveals specialization of distinct regulatory and enhanced effector profiles. Sci. Immunol. 9, eadn2362 (2024). - PubMed
    1. Corbett A. J., et al. , T-cell activation by transitory neo-antigens derived from distinct microbial pathways. Nature 509, 361–365 (2014). - PubMed
    1. Le Bourhis L., et al. , Antimicrobial activity of mucosal-associated invariant T cells. Nat. Immunol. 11, 701–708 (2010). - PubMed
    1. Ussher J. E., et al. , CD161++ CD8+ T cells, including the MAIT cell subset, are specifically activated by IL-12+IL-18 in a TCR-independent manner. Eur. J. Immunol. 44, 195–203 (2014). - PMC - PubMed

MeSH terms

LinkOut - more resources