. 2025 Jun 24;9(12):2907-2919.
doi: 10.1182/bloodadvances.2024014860.

CD19.CAR T-cell-derived extracellular vesicles express CAR and kill leukemic cells, contributing to antineoplastic therapy

Affiliations

CD19.CAR T-cell-derived extracellular vesicles express CAR and kill leukemic cells, contributing to antineoplastic therapy

Paola Lanuti et al. Blood Adv. .

Abstract

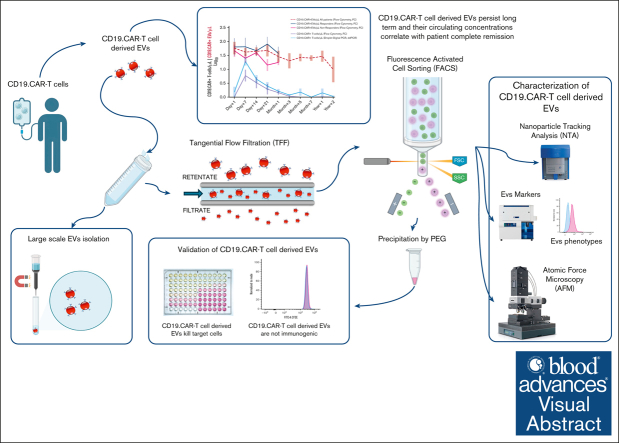
Chimeric antigen receptor (CAR) T-cell-derived extracellular vesicles (EVs) might represent a new therapeutic tool for boosting CAR T-cell antileukemic effects. Here, a cohort of 22 patients who received infusion with CD19 CAR T cells were monitored for the presence of circulating CD19 CAR+ T-cell-derived EVs (CD19.CAR+EVs), which were then separated and functionally characterized for their killing abilities. A good manufacturing practice (GMP)-compliant separation method was also developed. Results demonstrated that CD19.CAR+EVs were detectable in peripheral blood up to 2 years after infusion, indicating long-lasting persistence of their parental cells. Notably, early decreases of circulating CD19.CAR+EV concentrations correlated with failure of CAR T-cell therapy. Circulating CD19.CAR+EVs displayed a median size (standard deviation) of 133.1 ± 65.5 nm and carried a proapoptotic protein cargo. These EVs expressed higher CAR levels than their parental cells. Furthermore, CD19.CAR+EVs did not activate heterologous T cells and produced significant, specific, and dose-dependent cytotoxic effects on CD19+ cell lines and primary cells. The new GMP-compliant EV isolation method allowed for a recovery of 63% ± 5.7% of CD19.CAR+EVs. A deeper analysis of the different protein cargoes carried by EVs derived from different CAR T-cell subpopulations identified a proapoptotic functional pathway linked to CD8+LAG-3+ EVs. Overall, our data indicate that CD19.CAR+EVs may be proposed as promising dynamic new biomarkers of CAR T-cell activity and, by contributing to the direct killing of leukemic targets, represent a new product with strong therapeutic potential that could be infused independently of CAR T cells.


Conflict of interest statement

Conflict-of-interest disclosure: The authors declare no competing financial interests.

Figures

None
Graphical abstract
Figure 1.
Figure 1.
Monitoring of CD19 CAR T cells and CD19.CAR+EVs in patients treated with CD19 CAR T cells. A total of 22 patients were monitored for 2 years from CD19 CAR T-cell infusion. The concentration of circulating CD19 CAR T cells was monitored both by flow cytometry (purple line) and ddPCR (blue line). CD19 CAR T-cell monitoring was paralleled with the concentration of CD19.CAR+EVs (red line). Flow cytometry analysis of CD19.CAR+EVs in responding vs nonresponding patients is also shown. Data were log transformed. A 2-way analysis of variance (ANOVA), followed by Tukey multiple comparisons test, was performed. An alpha value of .05 was established for the significance threshold. Each time point represents the mean (+SEM) of at least 3 independent measurements from distinct patients. Data are represented as mean + SEM; Mann-Whitney nonparametric test, and Robust Regression followed by OUTlier Identification test for outliers were applied.
Figure 2.
Figure 2.
Characterization of CD19.CAR+EVs. (A) NTA (i); AFM analysis of circulating CD19.CAR+EVs (ii); western blot analysis of CD63, flotillin-1, and cytochrome C in circulating CD19.CAR+EV samples (T lymphocytes were used as controls for cytochrome C expression) (iii); and flow cytometry evaluation of CD63 and flotillin-1 expression in circulating CD19.CAR+EVs (iv). CD63 and flotillin-1 expression (red histograms) were analyzed using the related fluorescence minus one (FMO) as controls (blue histograms). Mean fluorescence intensity (MFI) ratio values were calculated by dividing the MFI of the positive sample and that of the related FMO control. Data are representative of 3 separate experiments. (B) Transmission electron microscopy analysis of circulating CD19.CAR+EVs (scale bar, 100 nm). (C) Flow cytometry evaluation of CAR expression on circulating CD19.CAR+EVs. CAR expression (red histogram) was analyzed using the related FMOs as controls (blue histogram). MFI ratio values were calculated by dividing the MFI of the positive sample and that of the related FMO control. Data are representative of 3 separate experiments. (D) Venn diagram shows the common and uncommon proteins identified in circulating and preinfusion CD19.CAR+EVs. Same amount of EVs (pool of 3 individuals per condition containing 3 × 10⁶ EVs) were compared when proteomic analyses were performed to parallel circulating vs preinfusion EV cargoes. The number 4 refers to the number of identified proteins (4, corresponding to the 1.41% of the total number of identified proteins) uniquely carried by circulating EVs, whereas 275 proteins (99.97 % of identified proteins) were those shared by circulating and preinfusion CAR+EVs, and 4 other proteins (1.41% of identified proteins) were carried only by preinfusion CAR+EVs. (E) NTA (i) and AFM analysis (ii) of preinfusion CD19.CAR+EVs; western blot analysis of CD63, flotillin-1, and cytochrome C in preinfusion CD19.CAR+EV samples (T lymphocytes were used as controls for cytochrome C expression) (iii); and flow cytometry evaluation of CD63 and flotillin-1 expression in preinfusion CD19.CAR+EVs (iv). CD63 and flotillin-1 expression (red histograms) were analyzed using the related FMOs as controls (blue histograms). MFI ratio values were calculated by dividing the MFI of the positive sample and that of the related FMO control. Data are representative of 3 separate experiments.
Figure 3.
Figure 3.
In vitro cytolytic activity of CD19.CAR+EVs on Raji and SUP-B15 cell lines. (A) Cell viability of 2 cell lines, Raji (i) and SUP-B15 (ii), assessed by MTT assays after incubation for 48 hours with CD19.CAR+EVs at the indicated concentrations. Data shown are means ± SD of 3 to 4 replicates. ∗Statistically significant differences, compared with control (0 μg); ∗P < .05; ∗∗P < .01; ∗∗∗P < .001; ∗∗∗∗P < .0001. (B) Flow cytometry killing assays were performed using the concentration of 0.015 μg of circulating EVs per target cell to treat both Raji and SUP-B15 cell lines and analyzing their cytolytic activity by measuring the 7-AAD staining of target cells after 24 hours of treatment (Student t test, P = .0187). Values are averages of 3 independent experiments. (C) Flow cytometry killing assays were performed using the concentration of 0.015 μg of preinfusion EVs per target cell to treat both Raji and SUP-B15 cell lines and analyzing their cytolytic activity by measuring the 7-AAD staining of target cells after 24 hours of treatment (Student t test, not significant). (D) The immunogenicity of CD19.CAR+EVs was studied by treating heterologous T cells for 24 hours with the same dose of CD19.CAR+EVs used for testing their cytolytic abilities (0.015-μg protein EV per target cell). The red histogram represents the CFSE profile of untreated heterologous T cells, whereas the overlaid blue histogram represents the CFSE profile of heterologous T cells treated with CD19.CAR+EVs. Data are representative of 2 independent experiments. CFSE, carboxyfluorescein succinimidyl ester.
Figure 4.
Figure 4.
CD19.CAR+EV protein cargo. (A) Estimated MEFs per μm2. The analysis of MEF was performed both on circulating CD19.CAR+EVs and their circulating parental cells from the same patients (n = 3). The red dots refer to the estimated MEFs per μm2 of CD19.CAR+EV surface, whereas the blue dots represents the estimated MEFs per μm2 of CAR T-cell surface. (B) Dot plots showing expression of granzyme B and perforin in circulating CD19.CAR+EVs; the fluorescence minus one (FMO) control for granzyme B is shown (i); the percentage of granzyme B–positive EVs is represented (mean percent, 61.9% [SD, 4.7%]; mean MFI ratio, 3.5 [SD, 0.8]) (ii); the control FMO of perforin is shown (iii); and the percentage of perforin-positive EVs is represented (mean percent, 67.6% [SD, 4.2%]; mean MFI ratio, 6.7 [SD, 1.3]) (iv). The protein functional analyses of circulating (C) and preinfusion CD19.CAR+EVs (D), calculated by IPA with all identified proteins, are shown. IPA, ingenuity pathway analysis.
Figure 5.
Figure 5.
CD19 CAR T-cell–expressing PD-1 and LAG-3 are functional and produce EVs. (A) Flow cytometry analysis of markers, known to be involved in T-cell exhaustion, expressed on CD19 CAR T cells, residual from the infusion bags. The 3 graphs indicate the percentage of PD-1+ cells, LAG-3+ cells, and TIM-3+ cells gated on total CD3+ CAR T cells (gray circles), CD4+ CAR T cells (blue circles), and CD8+ CAR T cells (blue circles). Data are presented as mean ± SEM (1-way ANOVA; CD4+PD-1+ CAR T cells vs CD8+PD-1+ CAR T cells, P = .0100; CD4+LAG-3+ CAR T cells vs CD8+LAG-3+ CAR T cells, P = .0386). (B) Cytotoxic function of total CD3+ CAR T cells, CD4+PD-1+ CAR T cells, CD4+PD-1 CAR T cells, CD8+LAG-3+ CAR T cells, and CD8+LAG-3 CAR T cells, isolated by FACS from the infusion bag, against a CD19-expressing cell line, Raji. After 24 hours of culture, the percentage of target living cells with CAR T cells (target-to-CAR T-cell ratio, 1:10) was assessed by flow cytometry. The bars represent the mean and SEM of killing of CAR T cells derived from at least 4 different donors. (Student t test; CD3+ CAR T cells vs CD8+LAG-3+ CAR T cells, P = .0115; CD4+PD-1+ CAR T cells vs CD8+LAG-3+ CAR T cells, P = .0160; CD4+PD-1 CAR T cells vs CD8+LAG-3+ CAR T cells, P = .0137). (C) Comparison of the percentage of CD4+PD-1+ CAR T cells and CD8+LAG-3+ CAR T cells, assessed by flow cytometry. The cells analyzed were obtained from the residual bags or from the PB of patients, 14 days after CD19 CAR T-cell infusion (2-way ANOVA, not significant). (D) The protein functional analysis calculated by ingenuity pathway analysis with all identified proteins is shown for CD8+LAG3+ EVs paralleled with the CD8+LAG-3 EV compartment.
Figure 6.
Figure 6.
Characterization of CD3+–immune-selected CD19.CAR+EVs. NTA (A) and AFM analysis (B). (C) Flow cytometry evaluation of CD63 and flotillin-1 expression. CD63 and flotillin-1 expression (red histograms) were analyzed using the related FMOs as controls (blue histograms). MFI ratio values were calculated by dividing the MFI of the positive sample and that of the related FMO control. Data are representative of 3 separate experiments. (D) Flow cytometry killing assays were performed using the concentration of 0.015 μg of protein from CD3-immunoselected EVs per target cell to treat both Raji and SUP-B15 cell lines and by analyzing their cytolytic activity by measuring the 7-AAD staining of target cells after 24 hours of treatment.

Comment in

References

    1. Neelapu SS, Locke FL, Bartlett NL, et al. Axicabtagene ciloleucel CAR T-cell therapy in refractory large B-cell lymphoma. N Engl J Med. 2017;377(26):2531–2544. - PMC - PubMed
    1. Maude SL, Laetsch TW, Buechner J, et al. Tisagenlecleucel in children and young adults with B-cell lymphoblastic leukemia. N Engl J Med. 2018;378(5):439–448. - PMC - PubMed
    1. Grupp SA, Kalos M, Barrett D, et al. Chimeric antigen receptor-modified T cells for acute lymphoid leukemia. N Engl J Med. 2013;368(16):1509–1518. - PMC - PubMed
    1. Sharma P, Kanapuru B, George B, et al. FDA approval summary: idecabtagene vicleucel for relapsed or refractory multiple myeloma. Clin Cancer Res. 2022;28(9):1759–1764. - PMC - PubMed
    1. Dellar ER, Hill C, Melling GE, Carter DRF, Baena-Lopez LA. Unpacking extracellular vesicles: RNA cargo loading and function. J Extracell Biol. 2022;1(5) - PMC - PubMed