. 2025 Mar 3;157(2):e202413642.
doi: 10.1085/jgp.202413642. Epub 2025 Feb 4.

ERG responses to high-frequency flickers require FAT3 signaling in mouse retinal bipolar cells

Affiliations

ERG responses to high-frequency flickers require FAT3 signaling in mouse retinal bipolar cells

Evelyn C Avilés et al. J Gen Physiol. .

Abstract

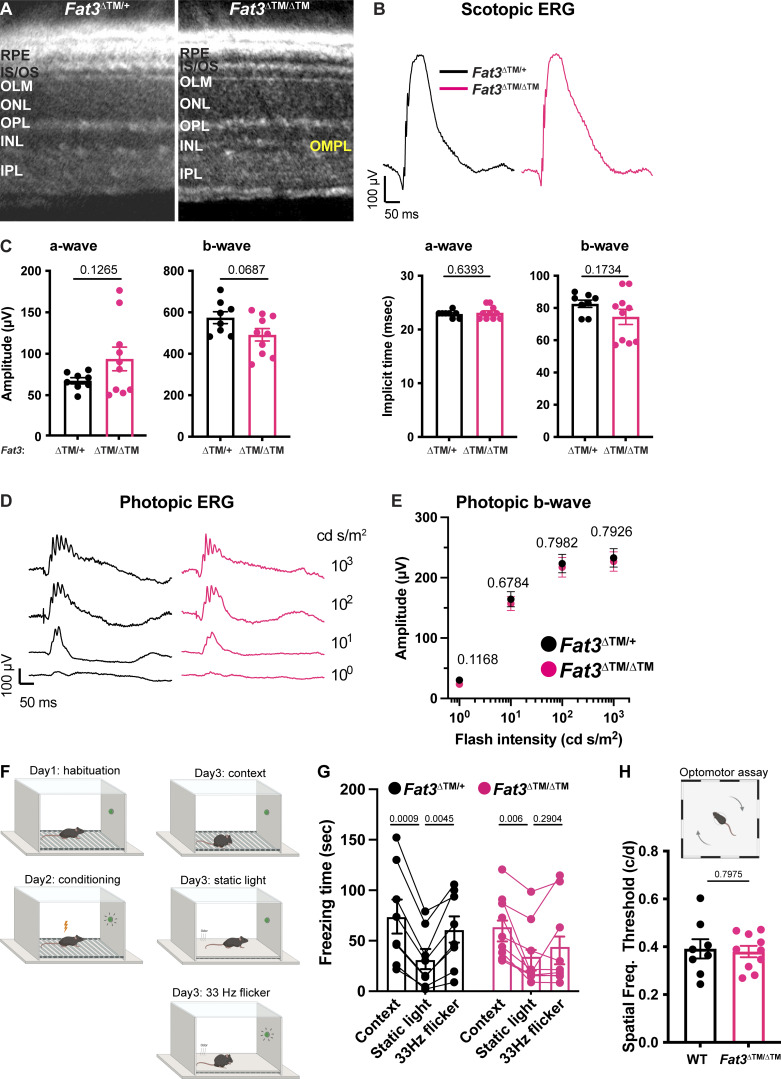
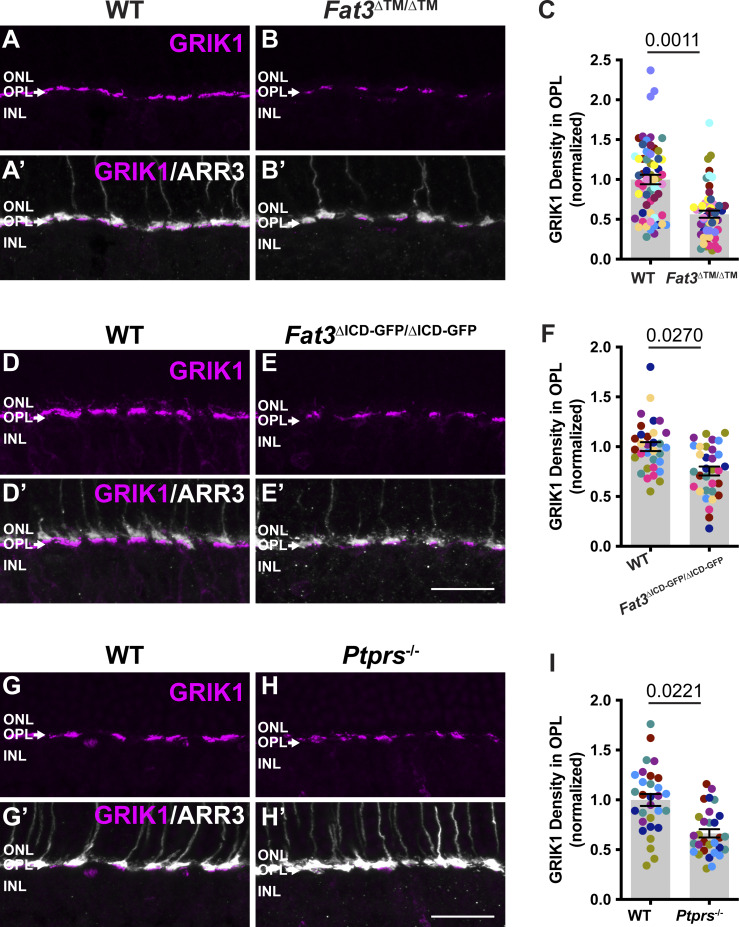
Vision is initiated by the reception of light by photoreceptors and subsequent processing via downstream retinal neurons. Proper circuit organization depends on the multifunctional tissue polarity protein FAT3, which is required for amacrine cell connectivity and retinal lamination. Here, we investigated the retinal function of Fat3 mutant mice and found decreases in both electroretinography and perceptual responses to high-frequency flashes. These defects did not correlate with abnormal amacrine cell wiring, pointing instead to a role in bipolar cell subtypes that also express FAT3. The role of FAT3 in the response to high temporal frequency flashes depends upon its ability to transduce an intracellular signal. Mechanistically, FAT3 binds to the synaptic protein PTPσ intracellularly and is required to localize GRIK1 to OFF-cone bipolar cell synapses with cone photoreceptors. These findings expand the repertoire of FAT3's functions and reveal its importance in bipolar cells for high-frequency light response.


Conflict of interest statement

Disclosures: The authors declare no competing interests exist.

Figures

Figure 1.
Figure 1.
Flicker ERG and vision at high frequency and step ERG of Fat3-deficient mice. (A) Schematic representation of retinal neurons and their layers. (B) Averaged oscillatory potentials of Fat3∆TM/+ (n = 8) and Fat3∆TM/∆TM (n = 10) eyes at scotopic condition are elicited by 0.1 cd s/m2 flashes (same as Fig. S1 B). Line: Mean values. Error bar: SEM. (C) Peak amplitude (N3-P3) of oscillatory potentials (same as Fig. 1 B, 0.1 cd s/m2 scotopic condition). Fat3∆TM/+: 146.7 ± 16.8 µV, n = 8 eyes; Fat3∆TM/∆TM: 179.9 ± 26.5 µV, n = 10 eyes. Unpaired two-tailed Student’s t test. Error bar: SEM. The numerical values above the bar graph for this and the rest of figures: P values. (D) Peak implicit time (P3) of oscillatory potentials. Fat3∆TM/+: 34.38 ± 0.18 ms, n = 8 eyes; Fat3∆TM/∆TM: 33.70 ± 0.37 µV, n = 10 eyes. Unpaired two-tailed Student’s t test. Error bar: SEM. (E) Representative flicker ERG raw traces of WT control and Fat3∆TM/∆TM eyes elicited by 3.162 cd s/m2 flashes at 20, 30, 40, and 50 Hz frequencies. (F) Flicker ERG amplitude at 0.5, 10, 20, 30, 40, and 50 Hz for WT control (n = 10) and Fat3∆TM/∆TM (n = 10) eyes. Unpaired two-tailed Student’s t test. Error bar: SEM. (G) Flicker ERG implicit time (first peak) at 20 Hz for WT control (36.5 ± 0.5 ms, n = 10) and Fat3∆TM/∆TM (46.2 ± 1.0 ms, n = 10) eyes. Unpaired two-tailed Student’s t test. Error bar: SEM. (H) Representative step ERG raw traces of WT (n = 10) control and Fat3∆TM/∆TM (n = 10) eyes elicited by a 3-s step light at 1,000 cd/m2 intensity. (I) Quantification of step ERG d-wave amplitudes of WT (38.9 ± 2.2 µV, n = 10) control and Fat3∆TM/∆TM (30.2 ± 3.0 µV, n = 10) eyes elicited by a 3-s step of light at 1,000 cd/m2 intensity. Unpaired two-tailed Student’s t test. Error bar: SEM.
Figure S1.
Figure S1.
Scotopic and photopic ERG of FAT3-deficient mice (Related to Fig. 1 ). (A) Representative OCT images of Fat3∆TM/+ control and Fat3∆TM/∆TM eyes. (B) Representative scotopic ERG raw traces of Fat3∆TM/+ and Fat3∆TM/∆TM eyes elicited by 0.1 cd s/m2 flashes. (C) Quantification of scotopic ERG parameters (amplitude and implicit time of a-wave and b-wave) of Fat3∆TM/+ (n = 8) and Fat3∆TM/∆TM (n = 10) eyes. (D) Representative photopic ERG raw traces of Fat3ΔTM/+ and Fat3ΔTM/ΔTM eyes elicited by 1, 10, 100, and 1,000 cd s/m2 flashes at 30 cd/m2 background light to saturate the response from rod-pathway. (E) Ensemble-averaged photopic ERG b-wave amplitude from Fat3∆TM/+ (n = 8) and Fat3∆TM/∆TM (n = 10) eyes. (F) Schematics of fear conditioning and optomotor behavioral experiment. On Day 1, a mouse is brought to the electric-shock cage with a floor of metal bars for habituation of the environment. On Day 2, the mouse is conditioned by electrical shock paired with 33 Hz flashing light. On Day 3, the mouse is first subjected to a contextual check, in which the “Context” measures the freezing time of the mouse after it is brought back to the electric shock cage, which presents a fear-associated context environment, without the shock. “Static” measures the freezing time of the mouse with a static light, after the covering the metal bars and an odor change. Following this measurement, a 33 Hz flickering light is turned on, and the freezing time of the mouse is measured, as the “flicker” time. (G) Fear conditioning responses as freezing time (seconds) from Fat3∆TM/+ (n = 8) and Fat3∆TM/∆TM (n = 9) mice. One-way ANOVA (matched data) with Dunnett multiple comparison test. (H) The visual threshold of spatial frequency of WT (n = 8) and Fat3∆TM/∆TM (n = 10) mice measured with the optomotor behavioral assay shown in the bottom cartoon in panel D. Unpaired two-tailed Student’s t test. Abbreviations: RPE, retinal pigmented epithelium; IS/OS, inner-outer segments junction; OLM, outer limiting membrane; OPL, outer plexiform layer; IPL, inner plexiform layer; IMPL: inner misplaced plexiform layer. NS: non-significant. Error bars: SEM.
Figure 2.
Figure 2.
Flicker ERG at high frequency of Ptf1a CRE conditional Fat3 mice (Ptf1a cKO ). (A) Schematic representation of cell classes that express FAT3 in wild type retina, shown in magenta. (B) Schematic representation of cell classes, i.e., ACs, that lose Fat3 expression in a Ptf1acKO, shown in black outlines. (C) Flicker ERG amplitude at 0.5, 10, 20, 30, 40, and 50 Hz for the Ptf1acKO condition. Control exact genotypes are Ptf1aCRE;Fat3fl/+ (n = 8 eyes) and Ptf1acKO exact genotypes are Ptf1aCRE;Fat3fl/∆TM (n = 8 eyes). Unpaired two-tailed Student’s t test. Error bar: SEM. (D) Flicker ERG implicit time at 20 Hz for control (39.0 ± 0.4 ms, n = 8 eyes) and Ptf1acKO (38.9 ± 1.0 ms, n = 8 eyes). Unpaired two-tailed Student’s t test. Error bar: SEM. (E) Representative flicker ERG raw traces for control (n = 8 eyes) and Ptf1acKO (n = 8 eyes).
Figure 3.
Figure 3.
Fat3 RNA is enriched in OFF-cone bipolar cells. (A) Schematic representation of the retina highlighting the position of bipolar cell bodies, as stained by VSX2. (B)In situ hybridization for Fat3 RNA in WT P22 retinas. (C)In situ hybridization for Fat3 RNA in Fat3∆TM/∆TM P22 retinal tissue. (B′ and C′) In B and C the RNA puncta are shown in white and the yellow brackets indicate the area of VSX2+ cell bodies (cyan, B′ and C′). Yellow dashed lines demark the inner nuclear layer (INL) and the outer misplaced plexiform layer (OMPL) in Fat3∆TM/∆TM tissue. The squares demark the insets seen in B′ and C′ at higher magnification. VSX2 protein is seen in cyan. (D) Hybridization chain reaction-immunohistochemistry (HCR-IHC) of FAT3 in wild type retinas. (D′) Inset demarked in a yellow box in D is shown at higher magnification in D′. (E) HCR-IHC of FAT3 in Fat3∆TM/∆TM mutant retinas. (E′) Inset demarked in a yellow box in E is shown at higher magnification in E′. (F) Schematic representation of Grik1 and Grm6 RNA enrichment in bipolar cells, according to data in Fig. S2. (G and G′)in situ hybridization of Grik1 RNA (magenta) and Grm6 RNA (yellow, G′) with immunostaining for VSX2 (cyan). (G″ and G‴) The insets in G and G′ are shown at a higher magnification in G″ and G‴. (H) Triple in situ hybridization of Fat3 (white), Grik1 (magenta), and Grm6 (yellow) RNA. (I–I‴) Inset in H is seen at higher magnification in I–I‴. (I) Higher magnification of inset shown in H. Yellow dashed lines in I″ and I‴ demark Grik1 RNA+ cell bodies. Fat3 RNA (white) is shown together with Grm6 (yellow) RNA in I′, with Grik1 (magenta) RNA in I″ and alone in I‴. Scale bars: 20 µm.
Figure S2.
Figure S2.
scRNAseq data display (Related to Fig. 2 ). Expression of Fat3, Grik1, Grm6, and Ptprs gene transcripts by bipolar cell identity are displayed. These data are based on Shekhar et al. (2016).
Figure 4.
Figure 4.
Flicker ERG at high frequency of Isl1 CRE conditional Fat3 mice (Isl1 cKO ). (A) Schematic representation of cell classes, i.e., starburst ACs, RGCs, and ON-CBCs, that lose Fat3 expression in an Isl1cKO shown in black outlines compared to magenta cells seen in WT controls. (B) VGAT immunostaining for control (exact genotype throughout this figure: Isl1CRE/+;Fat3fl/+) mice. (C) VGAT immunostaining for Isl1cKO (exact genotype throughout this figure: Isl1CRE/+;Fat3fl/∆TM). (B′ and C′) TdTomato reporter of Cre expression is seen in B′ and C′. (D) Quantification of the OMPL score for Isl1cKO. Controls: 0.095 ± 0.065 (n = 3 animals, 14 retinal regions); Isl1cKO: 0.825 ± 0.074 (n = 3 animals, 19 retinal regions). Each data point corresponds to a retinal region, color-coded by animal, nested two-tailed test. Error bar: SEM. (E) DAPI and Bhlhb5 immunostaining of control retinas. (F) DAPI and Bhlhb5 immunostaining of Isl1cKO retinas. (G) Quantification of the number of nuclei per field in the IPL. Controls: 1.25 ± 0.35 (n = 3 animals, 12 retinal regions); Isl1cKO: 5.11 ± 0.39 (n = 3 animals, 18 retinal regions). Each data point corresponds to a retinal region, color-coded by animal, nested two-tailed test. Error bar: SEM. (H) Quantification of the number of Bhlhb5+ nuclei per field in the IPL and GCL. Controls: 3.67 ± 0.43 (n = 3 animals, 12 retinal regions); Isl1cKO: 9.33 ± 0.67 (n = 3 animals, 18 retinal regions). Each data point corresponds to a retinal region, color-coded by animal, nested two-tailed test. Error bar: SEM. (I) Representative flicker ERG raw traces for control and Isl1cKO. (J) Flicker ERG amplitude at 0.5, 10, 20, 30, 40, and 50 Hz for control (n = 6 eyes) and Isl1cKO (n = 6 eyes). Unpaired two-tailed Student’s t test. Error bar: SEM. (K) Flicker ERG implicit time at 20 Hz for control (38.1 ± 0.8 ms, n = 6 eyes) and Isl1cKO (38.5 ± 0.5 ms, n = 6 eyes). Unpaired two-tailed Student’s t test. Error bar: SEM. Scale bars: 20 µm.
Figure S3.
Figure S3.
Effect of removal of Fat3 from OFF-CBC type 2 on flicker ERG (Related to Fig. 4 ). (A) Schematic representation of cells types, i.e., type 2 OFF-CBCs and GABAergic ACs, that lose Fat3 expression in a Bhlhe22CRE cKO mice (Bhlhe22cKO). Magenta coloring represents cell type expression of FAT3. (B) VGAT immunostaining for control mice (exact genotype throughout this figure: Bhlhe22CRE/+;Fat3fl/+). (C) VGAT immunostaining for Bhlhe22cKO mice (exact genotype throughout this figure: Bhlhe22CRE/+;Fat3fl/∆TM). (D) Quantification of the OMPL score for Bhlhe22cKO. Controls: 0.0 ± 0.0 (n = 3 animals, 15 retinal regions); Bhlhe22cKO: 1.0 ± 0.0 (n = 3 animals, 18 retinal regions). Each data point corresponds to a retinal region, color-coded by animal, analyzed using a nested two-tailed test. (E) DAPI and Bhlhb5 (a.k.a. Bhlhe22 gene encoded protein) staining of control mouse retinas. (F) DAPI and Bhlhb5 staining of Bhlhe22cKO retinas. (G) Quantification of the number of nuclei per field in the IPL. Controls: 2.79 ± 0.66 (n = 3 animals, 14 retinal regions); Bhlhe22cKO: 7.53 ± 1.20 (n = 3 animals, 15 retinal regions). Each data point corresponds to a retinal region, color-coded by animal, analyzed using a nested two-tailed test. (H) Quantification of the number of Bhlhb5+ nuclei per field in the IPL and GCL. Controls: 4.29 ± 0.98 (n = 3 animals, 14 retinal regions); Bhlhe22cKO: 11.13 ± 1.34 (n = 3 animals, 15 retinal regions). Each data point corresponds to a retinal region, color-coded by animal, nested two-tailed test. (I) Representative flicker ERG raw traces for controls (n = 6 eyes) and Bhlhe22cKO (n = 6 eyes) at 20 and 30 Hz. (J) Flicker ERG amplitude at 0.5, 10, 20, 30, 40, and 50 Hz for controls (n = 6 eyes) and Bhlhe22cKO (n = 6 eyes). (K) Flicker ERG implicit time at 20 Hz for controls (39.7 ± 1.1 ms, n = 6 eyes) and Bhlhe22cKO (38.3 ± 1.1 ms n = 6 eyes). Scale bars: 20 µm. Error bars: SEM.
Figure S4.
Figure S4.
BC and cones numbers, visualization of Grik1+ BCs morphology via injection of an AVV-Grik1-GFP virus in Fat3 mutants (Related to Figs. 3 and 4). (A) ARR3 immunohistochemistry of WT retinas. (A′) shows ARR3 staining together with DAPI staining. (B) ARR3 immunohistochemistry of Fat3∆TM/∆TM retinas. (B′) shows ARR3 staining together with DAPI staining. (C) VSX2 immunostaining of WT retinas. (D) VSX2 immunostaining of Fat3∆TM/∆TM retinas. (E) Quantification of number of cones marked by ARR3, as shown in A and B. WT controls: 27.77 ± 0.907 (n = 4 animals, 13 retinal regions); Fat3∆TM/∆TM: 29.00 ± 0.593 (n = 4 animals, 14 retinal regions). Each data point corresponds to a retinal region, color-coded by animal, analyzed using a nested two-tailed test. (F) Quantification of thickness of area occupied by VSX2 staining, as shown in C and D. WT controls: 21.09 ± 1.045 (n = 4 animals, 15 retinal regions); Fat3∆TM/∆TM: 21.59 ± 0.969 (n = 4 animals, 15 retinal regions). Each data point corresponds to a retinal region, color-coded by animal, analyzed using a nested two-tailed test. (G) Examples of retinal sections showing cells expressing GFP under the control of the Grik1 enhancer. The GFP reporter was introduced through in vivo injection of AAV8-Grik1-GFP. WT retinas are shown in G. (H)Fat3∆TM/∆TM retinas injected with AAV8-Grik1-GFP. The OPL is indicated with a yellow arrowhead and the OMPL, labeled with VGAT staining, is marked with a yellow arrow. Scale bar: 20 µm. (I) Quantification of Grik1+ BC dendrites in the OPL (WT Controls: 100%; Fat3∆TM/∆TM: 100%), axons in the IPL only (WT Controls: 100%; Fat3∆TM/∆TM: 44 ± 18.6%), and axons in the OMPL or in the OMPL and IPL (WT Controls: 0%; Fat3∆TM/∆TM: 56 ± 18.6%). Controls: n = 5 animals, 12 cells, Fat3∆TM/∆TM: n = 7 animals, 22 cells. Mann–Whitney test. Error bars: SEM.
Figure 5.
Figure 5.
High - frequency flicker ERG and step ERG of FAT3 ICD deficient mice. (A and B) Schematics of molecular structure of FAT3 WT and FATΔICD-GFP proteins B. Immunostaining for GFP in WT retinal sections. The arrow points the OPL. Inset (yellow box) is seen in B′. (C) Immunostaining for GFP in Fat3∆ICD-GFP/∆ICD-GFP retinal sections. The arrow points to the OPL. Inset (yellow box) is seen in C′. (D) Representative OCT images of Fat3ΔICD-GFP/+ control and Fat3ΔICD-GFP/ΔICD-GFP eyes. (E) Representative flicker ERG raw traces of Fat3ΔICD-GFP/+ control and Fat3ΔICD-GFP/ΔICD-GFP eyes elicited by 3.162 cd s/m2 flashes at 20, 30, 40, and 50 Hz frequencies. (F) Flicker ERG amplitude at 0.5, 10, 20, 30, 40, and 50 Hz for Fat3ΔICD-GFP/+ control (n = 10 eyes) and Fat3ΔICD-GFP/ΔICD-GFP (n = 10) eyes. Unpaired two-tailed Student’s t test. Error bar: SEM. (G) Flicker ERG implicit time at 20 Hz for Fat3ΔICD-GFP/+ control (37.4 ± 0.5 ms, n = 10 eyes) and Fat3ΔICD-GFP/ΔICD-GFP (41.9 ± 0.8 ms, n = 10) eyes at 20 Hz. Unpaired two-tailed Student’s t test. Error bar: SEM. (H) Representative step ERG raw traces of Fat3ΔICD/+ control (left) and Fat3ΔICD-GFP/ΔICD-GFP (right) eyes elicited by a 3-s step light at 1,000 cd/m2 intensity. (I) Quantification of step ERG d-wave amplitudes for Fat3ΔICD-GFP/+ control (36.1 ± 3.7 µV, n = 10 eyes) and Fat3ΔICD-GFP/ΔICD-GFP (14.4 ± 3.8 µV, n = 10) eyes elicited by a 3-s step of light at 1,000 cd/m2 intensity. Unpaired two-tailed Student’s t test. Error bar: SEM.
Figure 6.
Figure 6.
PTPσ and HOMER1 localization in WT and FAT3 mutant retinas. (A) Western blot for PTPσ in protein lysate (input), in the supernatant after pulldown with a GST fusion to FAT-ICD (sup), and in the pellet after pulldown with GST alone (GST) or a FAT3-ICD GST fusion protein. (B and B′) Immunostaining of PTPσ (yellow) and GRIK1 (magenta, B′) in the OPL region of WT retinal sections. (C and C″) Immunostaining of PTPσ (yellow) and CtBP2 (cyan, C″), a marker of presynaptic terminals in photoreceptor axons. (D and D′) Immunostaining of PTPσ (yellow) and ARR3 (white) and PTPσ (D′) alone in the OPL region of WT retinal sections. (E and E′) Immunostaining of PTPσ (yellow) and ARR3 (white) and PTPσ (E′) alone in the OPL region of Fat3∆TM/∆TM retinal sections. (F) Quantification of PTPσ integrated intensity (normalized) in the OPL. WT Controls: 1.00 ± 0.07 (n = 4 animals, 16 retinal regions); Fat3∆TM/∆TM: 0.56 ± 0.05 (n = 3 animals, 12 retinal regions). Each data point corresponds to a retinal region, color-coded by animal, nested two-tailed test. Error bar: SEM. (G and G′) Immunostaining of HOMER1 (yellow) and SV2 (cyan), and HOMER1 (G′) alone in WT retinal sections. (H and H′) Immunostaining of HOMER1 (yellow) and SV2 (cyan), and HOMER1 (H′) alone in Fat3∆TM/∆TM retinal sections. (I) Quantification of HOMER1 integrated intensity in the OPL. WT Controls: 1.00 ± 0.07 (n = 3 animals, eight retinal regions); Fat3∆TM/∆TM: 0.91 ± 0.06 (n = 3 animals, eight retinal regions). Each data point corresponds to a retinal region, color-coded by animal, nested two-tailed test. Error bar: SEM. Scale bars: 20 µm. Source data are available for this figure: SourceData F6.
Figure S5.
Figure S5.
Expression pattern of postsynaptic components PTPσ, HOMER1, GRIK1, and GRM6 in the retina (Related to Figs. 6 and 7). (A and B) PTPσ immunostaining in WT retinas B. PTPσ immunostaining in Ptprs−/− retinas. (A′ and B′) Cone arrestin (ARR3) labels the cone photoreceptors endings in the OPL in A′ and B′. (C) Schematic representation of OFF-BCs and their synapses with cone photoreceptors. ARR3 (white) labels cones and GRIK1 (magenta) labels postsynaptic BC dendrites. (D) Schematic representation of ON-BCs and their synapses with cone photoreceptors. ARR3 (white) labels cones and GRM6 (magenta) labels postsynaptic cone and rod BC (RBC) dendrites. (E and E′) GRIK1 and GRM6 (E′) immunostaining of adult WT retina. (F and F′) GRIK1 and GRM6 (F′) immunostaining of Grik1−/− retina. (G and G′) GRIK1 and GRM6 (G′) immunostaining of Grm6−/− retina. (H) Immunostaining for CtBP2, a marker of presynaptic ribbon in WT retinas. (I) Immunostaining for CtBP2 Fat3∆TM/∆TM retinas. (H′ and I′) Cone arrestin (ARR3) labels the cone photoreceptors endings in the OPL in H′ and I′. (J) Quantification of CtBP2 mean fluorescence intensity in the OPL, normalized by ONL signal. WT controls: 1.00 ± 0.02 (n = 8 animals, 36 retinal regions); Fat3∆TM/∆TM: 1.11 ± 0.02 (n = 8 animals, 36 retinal regions). Each data point corresponds to a retinal region, color-coded by animal, analyzed using a nested two-tailed test. (K) Immunostaining for CtBP2 in WT retinas, littermates of Fat3∆ICD-GFP/∆ICD-GFP animals. (L) Immunostaining for CtBP2 in Fat3∆ICD-GFP/∆ICD-GFP retinas. (K′ and L′) Cone arrestin (ARR3) labels the cone photoreceptors endings in the OPL in K′ and L′. (M) Quantification of CtBP2 mean fluorescence intensity in the OPL, normalized by ONL signal. WT controls: 1.00 ± 0.02 (n = 9 animals, from 36 retinal regions); Fat3∆ICD/∆ICD: 1.03 ± 0.02 (n = 9 animals, from 36 retinal regions). Each data point corresponds to a retinal region, color-coded by animal, analyzed using a nested two-tailed test. Scale bars: 20 µm. Error bars: SEM.
Figure 7.
Figure 7.
GRIK1 localization in WT, FAT3, and PTPσ mutant retinas. (A) Immunostaining for GRIK1 (magenta) in the OPL region of WT retinal sections. (B) Immunostaining for GRIK1 (magenta) in Fat3∆TM/∆TM retinal sections. (A′ and B′) Cone arrestin (ARR3) (white) labels the cone photoreceptor axonal endings in the OPL in A′ and B′. (C) Quantification of GRIK1 integrated intensity in the OPL. WT Controls: 1.00 ± 0.06 (n = 13 animals, 60 retinal regions); Fat3∆TM/∆TM: 0.56 ± 0.04 (n = 12 animals, 54 retinal regions). Each data point corresponds to a retinal region, color-coded by animal, nested two-tailed test. Error bar: SEM. (D) Immunostaining for GRIK1 (magenta) in the OPL region of WT retinal sections. (E) Immunostaining for GRIK1 (magenta) in the OPL region of Fat3∆ICD-GFP/∆ICD-GFP retinal sections. (D′ and E′) Cone arrestin (ARR3) (white) labels the cone photoreceptor endings in the OPL in D′ and E′. (F) Quantification of GRIK1 integrated intensity in the OPL. WT Controls: 1.00 ± 0.04 (n = 8 animals, 32 retinal regions); Fat3∆ICD/∆ICD: 0.75 ± 0.04 (n = 8 animals, 32 retinal regions). Each data point corresponds to a retinal region, color-coded by animal, nested two-tailed test. Error bar: SEM. (G) Immunostaining for GRIK1 (magenta) in the OPL region of WT retinal sections. (H) Immunostaining for GRIK1 (magenta) in Ptprs−/− retinal sections. (G′ and H′) Cone arrestin (ARR3) (white) labels the cone photoreceptor endings in the OPL in G′ and H′. (I) Quantification of GRIK1 integrated intensity in the OPL. WT Controls: 1.00 ± 0.06 (n = 6 animals, 30 retinal regions); Ptprs−/−: 0.66 ± 0.04 (n = 6 animals, 30 retinal regions). Each data point corresponds to a retinal region, color-coded by animal, nested two-tailed test. Error bar: SEM. Scale bars: 20 µm.
Figure S6.
Figure S6.
In situ hybridization of Grik1 and Grm6 and immunostaining of GRM6 upon loss of Fat3 in mouse retina (Related to Fig. 7 ). (A–A″) VSX2 immunostaining (A) after in situ hybridization for Grik1 (A′) and Grm6 (A″) in WT retina. (B–B″) VSX2 immunostaining (B) after in situ hybridization for Grik1 (B′) and Grm6 (B″) in Fat3∆TM/∆TM retina. (C) Quantification of Grik1 RNA mean fluorescence intensity in bipolar cells. WT: 1.00 ± 0.03, n = 4 animals, 16 retinal regions; Fat3∆TM/∆TM: 0.75 ± 0.04, n = 4 animals, 17 retinal regions. Each data point corresponds to a retinal region, color-coded by animal, analyzed using a nested two-tailed test. (D) Quantification of Grm6 RNA mean fluorescence intensity in bipolar cells. WT: 1.00 ± 0.02, n = 4 animals, from 16 retinal regions; Fat3∆TM/∆TM: 0.98 ± 0.02, n = 4 animals, from 17 retinal regions. Each data point corresponds to a retinal region, color-coded by animal, analyzed using a nested two-tailed test. (E) Immunostaining for GRM6 in WT retinas. (F) Immunostaining for GRM6 in Fat3∆TM/∆TM retinas. (E′ and F′) Cone arrestin (ARR3) labels the cone photoreceptors endings in the OPL in E′ and F′. (G) Immunostaining for GRM6 in WT retinas, littermates of Fat3∆ICD-GFP/∆ICD-GFP animals. (H) Immunostaining for GRM6 in Fat3∆ICD-GFP/∆ICD-GFP retinas. Cone arrestin (ARR3) labels the cone photoreceptors endings in the OPL in G′ and H′. (I) Quantification of GRM6 integrated intensity in the OPL. WT controls: 1.00 ± 0.08 (n = 8 animals, 35 retinal regions); Fat3∆TM/∆TM: 1.15 ± 0.09 (n = 9 animals, 41 retinal regions). Each data point corresponds to a retinal region, color-coded by animal, nested two-tailed test. (J) Quantification of GRM6 integrated intensity in the OPL. WT Controls: 1.00 ± 0.09 (n = 5 animals, 21 retinal regions); Fat3∆ICD/∆ICD: 0.86 ± 0.07 (n = 5 animals, 22 retinal regions). Each data point corresponds to a retinal region, color-coded by animal, analyzed using a nested two-tailed test. (K) Flicker ERG amplitude at 30 Hz for WT (18.70 ± 2.05 µV n = 6 eyes) and Ptprs−/− retinas (24.50 ± 2.86 µV, n = 6 eyes). (L) Flicker ERG implicit time at 20 Hz for WT (34.3 ± 0.6 ms, n = 6 eyes) and Ptprs−/− retinas (34.5 ± 1.4 ms, n = 6 eyes). (M) Representative flicker ERG raw traces of WT control and Ptprs−/− eyes elicited by 3.162 cd s/m2 flashes at 20 and 30 Hz frequencies. (N) Quantification of step ERG d-wave amplitudes of WT (55.58 ± 6.43 µV n = 6 eyes) and Ptprs−/− (46.40 ± 5.94 µV n = 6 eyes) elicited by a 3-s step of light at 1,000 cd/m2 intensity. (O) Representative step ERG raw traces of WT (n = 6) control and Ptprs−/− (n = 6) eyes elicited by a 3-s step light at 1,000 cd/m2 intensity. Scale bars: 20 µm. Error bars: SEM.

Update of

Similar articles

Cited by

References

    1. Amamoto, R., Garcia M.D., West E.R., Choi J., Lapan S.W., Lane E.A., Perrimon N., and Cepko C.L.. 2019. Probe-Seq enables transcriptional profiling of specific cell types from heterogeneous tissue by RNA-based isolation. Elife. 8:e51452. 10.7554/eLife.51452 - DOI - PMC - PubMed
    1. Avilés, E.C., Krol A., Henle S.J., Burroughs-Garcia J., Deans M.R., and Goodrich L.V.. 2022. Fat3 acts through independent cytoskeletal effectors to coordinate asymmetric cell behaviors during polarized circuit assembly. Cell Rep. 38:110307. 10.1016/j.celrep.2022.110307 - DOI - PMC - PubMed
    1. Awatramani, G., Wang J., and Slaughter M.M.. 2001. Amacrine and ganglion cell contributions to the electroretinogram in amphibian retina. Vis. Neurosci. 18:147–156. 10.1017/S0952523801181149 - DOI - PubMed
    1. Barlan, K., Cetera M., and Horne-Badovinac S.. 2017. Fat2 and lar define a basally localized planar signaling system controlling collective cell migration. Dev. Cell. 40:467–477.e5. 10.1016/j.devcel.2017.02.003 - DOI - PMC - PubMed
    1. Borghuis, B.G., Looger L.L., Tomita S., and Demb J.B.. 2014. Kainate receptors mediate signaling in both transient and sustained OFF bipolar cell pathways in mouse retina. J. Neurosci. 34:6128–6139. 10.1523/JNEUROSCI.4941-13.2014 - DOI - PMC - PubMed

MeSH terms