. 2025 Feb 4;20(2):e0316552.
doi: 10.1371/journal.pone.0316552. eCollection 2025.

Identification and validation of TSPAN13 as a novel temozolomide resistance-related gene prognostic biomarker in glioblastoma

Affiliations

Identification and validation of TSPAN13 as a novel temozolomide resistance-related gene prognostic biomarker in glioblastoma

Haofei Wang et al. PLoS One. .

Abstract

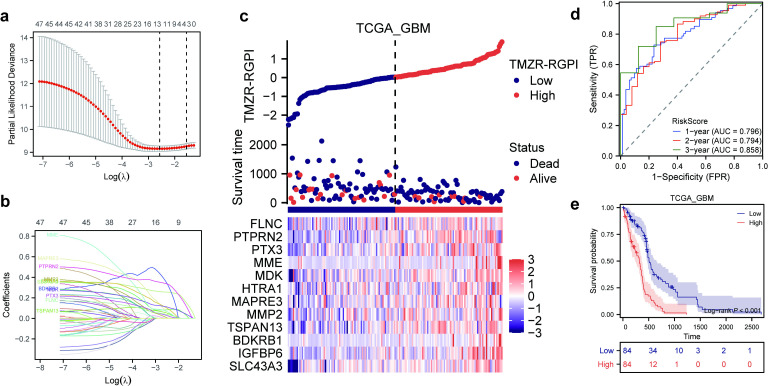
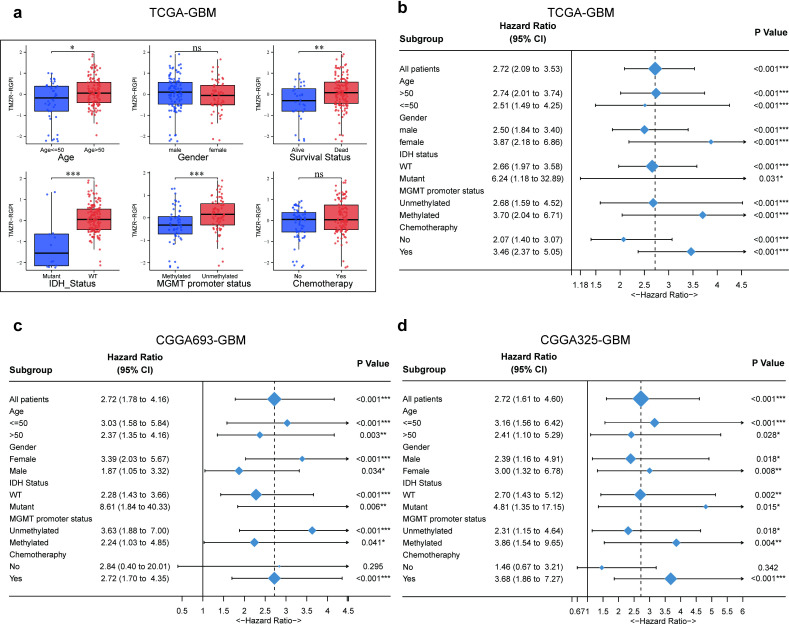
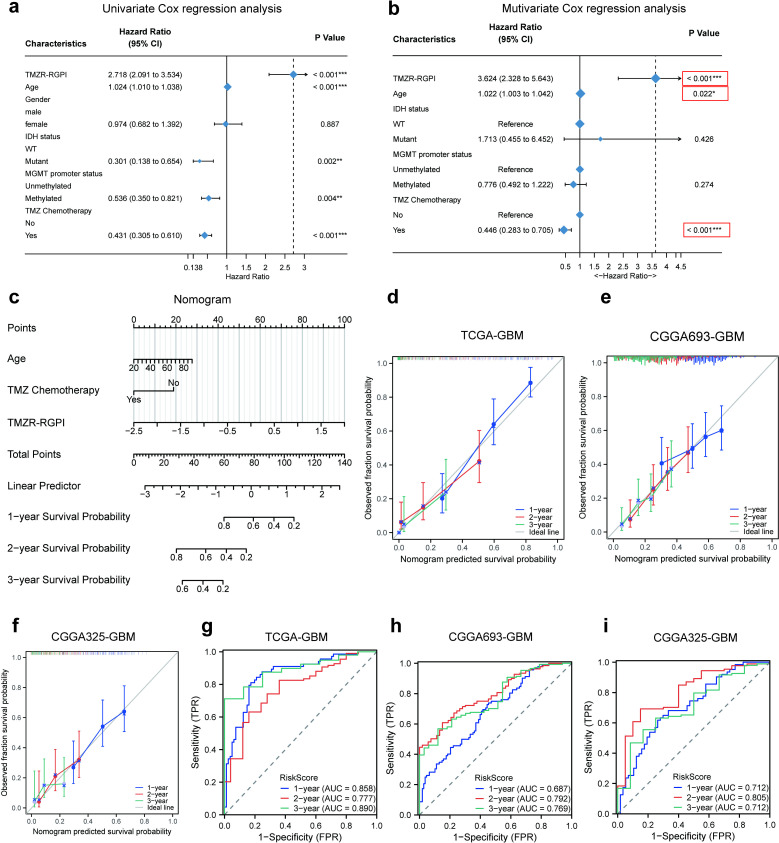
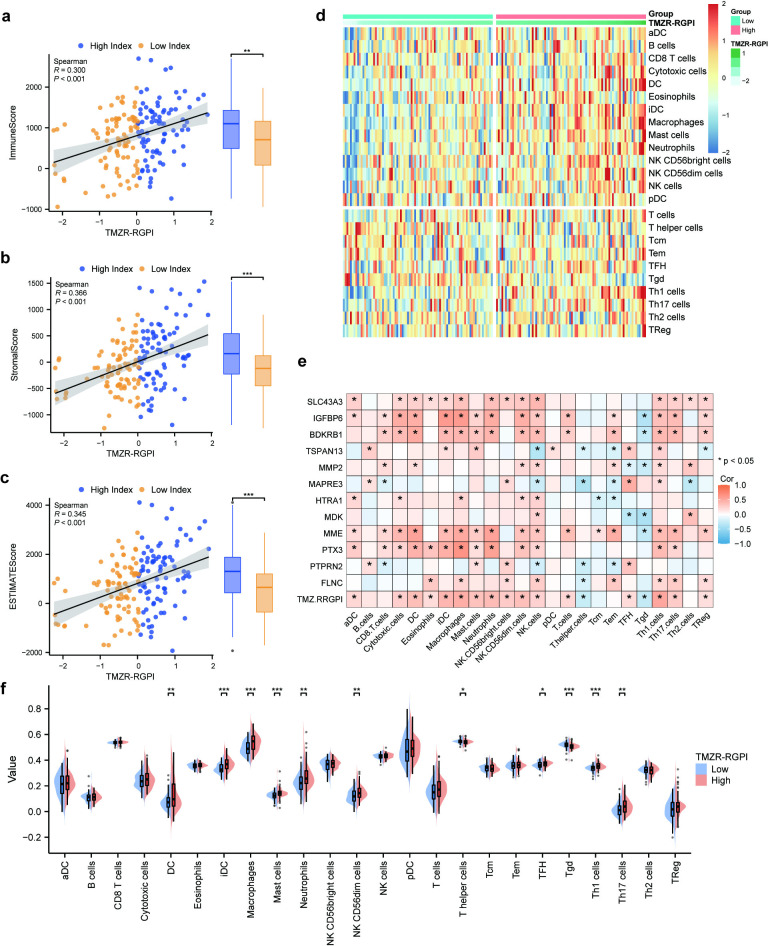
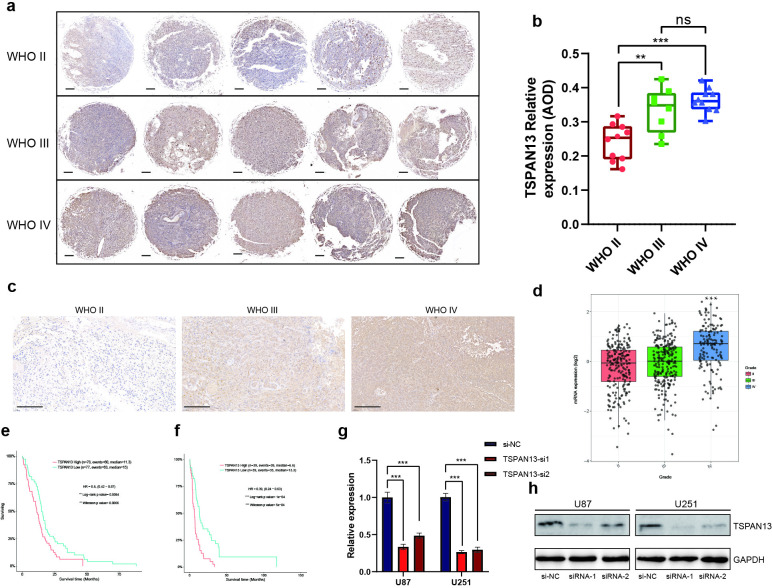
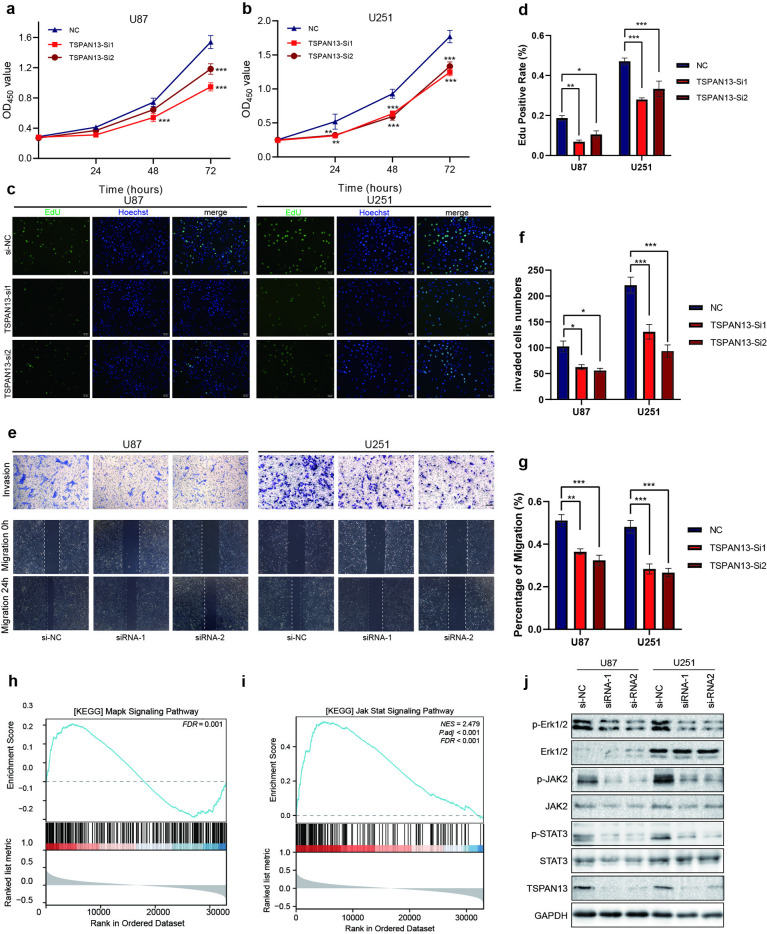
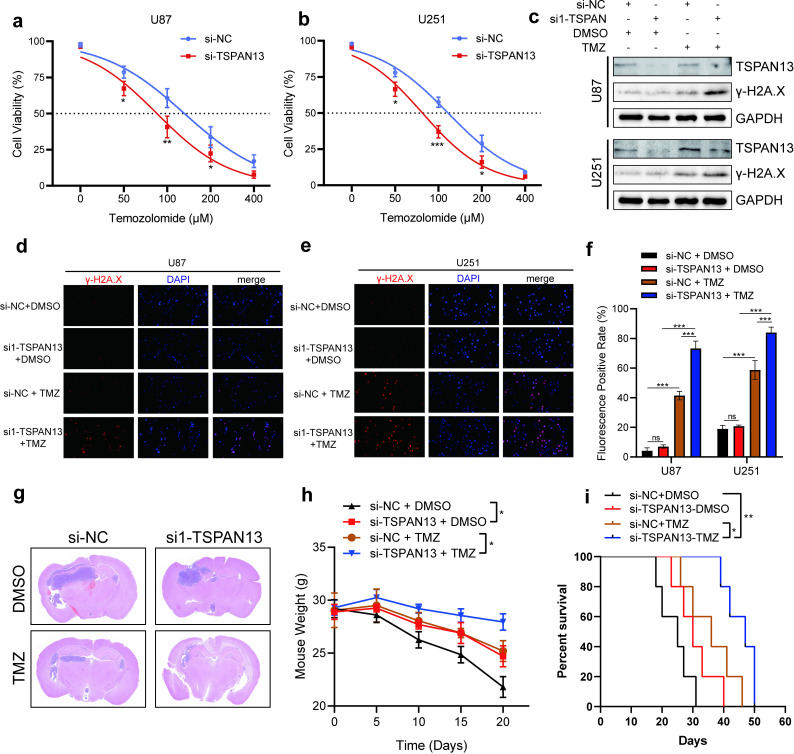
Glioblastoma (GBM) is the most lethal primary tumor of the central nervous system, with its resistance to treatment posing significant challenges. This study aims to develop a comprehensive prognostic model to identify biomarkers associated with temozolomide (TMZ) resistance. We employed a multifaceted approach, combining differential expression and univariate Cox regression analyses to screen for TMZ resistance-related differentially expressed genes (TMZR-RDEGs) in GBM. Using LASSO Cox analysis, we selected 12 TMZR-RDEGs to construct a risk score model, which was evaluated for performance through survival analysis, time-dependent ROC, and stratified analyses. Functional enrichment and mutation analyses were conducted to explore the underlying mechanisms of the risk score and its relationship with immune cell infiltration levels in GBM. The prognostic risk score model, based on the 12 TMZR-RDEGs, demonstrated high efficacy in predicting GBM patient outcomes and emerged as an independent predictive factor. Additionally, we focused on the molecule TSPAN13, whose role in GBM is not well understood. We assessed cell proliferation, migration, and invasion capabilities through in vitro assays (including CCK-8, Edu, wound healing, and transwell assays) and quantitatively analyzed TSPAN13 expression levels in clinical glioma samples using tissue microarray immunohistochemistry. The impact of TSPAN13 on TMZ resistance in GBM cells was validated through in vitro experiments and a mouse orthotopic xenograft model. Notably, TSPAN13 was upregulated in GBM and correlated with poorer patient prognosis. Knockdown of TSPAN13 inhibited GBM cell proliferation, migration, and invasion, and enhanced sensitivity to TMZ treatment. This study provides a valuable prognostic tool for GBM and identifies TSPAN13 as a critical target for therapeutic intervention.


Conflict of interest statement

The authors have declared that no competing interests exist.

Figures

Fig 1
Fig 1. Identification of prognostic TMZR-RDEGs in GBM.
(a-c) The volcano plot shows the differentially expressed genes in GSE199689, GSE193957, and GSE100736 datasets. (d) The heatmap visualizes the expression levels of 196 TMZR-RDEGs across various datasets, identified via RRA methods. Red and blue bands represent high and low gene expressions, respectively. (e) The forest plot showed the 48 prognostic TMZR-RDEGs in the TCGA-GBM dataset. (*p <  0.05, **p <  0.01, ***p <  0.001).
Fig 2
Fig 2. Construction of the TMZR-RGPI in the TCGA-GBM cohort.
(a, b) LASSO regression was performed with the minimum criteria. (c) The distribution plots of TMZR-RGPI, survival status and expression of 12 selected TMZR-RDEGs. (d) Time-Dependent ROC Curves of the 12-Gene TMZR-RGPI Model in the TCGA GBM Cohort. (e) Kaplan‒Meier curves of TMZR-RGPI subgroups for survival.
Fig 3
Fig 3. Correlation analysis of TMZR-RGPI with clinicopathological features in training and validation cohorts.
(a) Variations in TMZR-RGPI among glioma patients categorized by age, sex, grade, survival status, IDH status, MGMT promoter status, and whether to receive chemotherapy. (b-d) Forest plots illustrating survival outcomes in subgroups stratified by these clinicopathological characteristics. (*p <  0.05, **p <  0.01, ***p <  0.001, ns =  not significant).
Fig 4
Fig 4. Establishment and evaluation of a nomogram.
(a, b) Conducted univariate and multivariate Cox regression analyses within the TCGA-GBM cohort. (c) Nomogram based on TMZR-RGPI, age and whether to receive chemotherapy. (d-f) Calibration curves showed the concordance between predicted and observed 1-, 2-, and 3-year OS in TCGA-GBM, CGGA693-GBM, and CGGA325-GBM. (g-i) ROC curve analyses of the nomogram in predicting 1-, 2-, and 3-year OS in TCGA-GBM, CGGA693-GBM, and CGGA325-GBM. (*p <  0.05, **p <  0.01, ***p <  0.001, ns =  not significant).
Fig 5
Fig 5. Association of TMZR-RGPI with Immune Cell Infiltration.
(a) Scatter plot illustrating the positive correlation between TMZR-RGPI and ImmuneScore (Spearman’s rank correlation coefficient). (b) Scatter plot demonstrating the positive correlation between TMZR-RGPI and StromalScore (Spearman’s rank correlation coefficient). (c) Scatter plot depicting the positive correlation between TMZR-RGPI and ESTIMATEScore (Spearman’s rank correlation coefficient). (d) Heatmap displaying the association between TMZR-RGPI and the infiltration levels of 24 immune cell types in the TCGA-GBM dataset. (e) Correlation matrix of immune infiltration and TMZR-RGPI, along with the majority of its constituent molecules. (f) Boxplots revealing the relationship between TMZR-RGPI levels and infiltration levels of 24 immune cell types in the TCGA-GBM cohort. (*p <  0.05, **p <  0.01, ***p <  0.001).
Fig 6
Fig 6. Upregulated TSPAN13 is a prognostic biomarker in glioma.
(a) Representative pictures of IHC staining in our glioma tissue microarray cohort (scale bars of f =  200 μm). (b) TSPAN13 protein expression in the glioma tissue microarray. (c). Representative pictures of IHC staining in surgical removal samples (scale bars of g =  100 μm). (d) The expression levels of TSPAN13 in glioma tissues of different grades in the TCGA database. (e) K-M curves of TSPAN13 for GBM based on the TCGA-GBM cohorts. (f) K-M curves of TSPAN13 for GBM based on the Gravendeel cohorts. (g, h) TSPAN13 knockdown efficiency was detected using qRT-PCR and Western blotting in U251 and U87 cell lines. (*p <  0.05, **p <  0.01, ***p <  0.001, ns =  not significant).
Fig 7
Fig 7. Knockdown TSPAN13 inhibits the proliferation, migration, and invasion abilities of GBM cells and suppresses the activation of the MAPK and JAK2/STAT3 signaling pathways.
(a, b) Cell proliferation of U87 and U251 transfected with TSPAN13 siRNA and control was examined by CCK8 assay. (c) Representative pictures of EdU assays in U251 and U87 cell lines. (bar = 50 μm) (d) Statistical results of EdU assays in U251 and U87 cell lines. (e) Representative pictures of transwell and wound healing assays in U251 and U87 cell lines. (f, g) Statistical results of transwell and wound healing assays in U251 and U87 cell lines. (h, i) The GSEA of MAPK and JAK-STAT signalling pathway based on TSPAN13-associated genes. (j) Western blotting analysis showing the expression level of Erk1/2, p-Erk/2, JAK2, p-JAK2, STAT3 and p-STAT3 in TSPAN13 knockdown U87 and U251 cell lines. (*p < 0.05, **p < 0.01, ***p < 0.001).
Fig 8
Fig 8. TSPAN13 knockdown can improve the sensitivity of GBM to temozolomide.
(a, b) Cell viability of U87 and U251 treated with TMZ transfected with TSPAN13 siRNA and control was examined by CCK8 assay. (c-f) The expression of γ-H2A.X in U87 and U251 cells transfected with siRNA or treated with TMZ was detected by western blotting and immunofluorescence assay. (g) Representative HE-stained brain sections from tumor-bearing mice in each group of the animal model. (h). Weights of mice are recorded in each group of the animal model. (i). Kaplan–Meier survival of mice in each group. (*p <  0.05, **p <  0.01, ***p <  0.001, ns =  not significant).

Similar articles

References

    1. Louis DN, Perry A, Wesseling P, Brat DJ, Cree IA, Figarella-Branger D, et al.. The 2021 WHO Classification of Tumors of the Central Nervous System: a summary. Neuro Oncol. 2021;23(8):1231–51. Epub 2021/06/30. doi: 10.1093/neuonc/noab106 ; PMCID: PMC8328013 - DOI - PMC - PubMed
    1. Nicholson JG, Fine HA. Diffuse glioma heterogeneity and its therapeutic implications. Cancer Discov. 2021;11(3):575–90. Epub 2021/02/10. doi: 10.1158/2159-8290.CD-20-1474 - DOI - PubMed
    1. Reifenberger G, Wirsching H-G, Knobbe-Thomsen CB, Weller M. Advances in the molecular genetics of gliomas - implications for classification and therapy. Nat Rev Clin Oncol. 2017;14(7):434–52. Epub 2016/12/30. doi: 10.1038/nrclinonc.2016.204 - DOI - PubMed
    1. Aldape K, Zadeh G, Mansouri S, Reifenberger G, von Deimling A. Glioblastoma: pathology, molecular mechanisms and markers. Acta Neuropathol. 2015;129(6):829–48. Epub 2015/05/07. doi: 10.1007/s00401-015-1432-1 - DOI - PubMed
    1. Lapointe S, Perry A, Butowski NA. Primary brain tumours in adults. Lancet. 2018;392(10145):432–46. Epub 2018/08/01. doi: 10.1016/S0140-6736(18)30990-5 - DOI - PubMed

MeSH terms