. 2025 Mar;12(12):e2412680.
doi: 10.1002/advs.202412680. Epub 2025 Feb 4.

Reaction Pathway Differentiation Enabled Fingerprinting Signal for Single Nucleotide Variant Detection

Affiliations

Reaction Pathway Differentiation Enabled Fingerprinting Signal for Single Nucleotide Variant Detection

Huixiao Yang et al. Adv Sci (Weinh). 2025 Mar.

Abstract

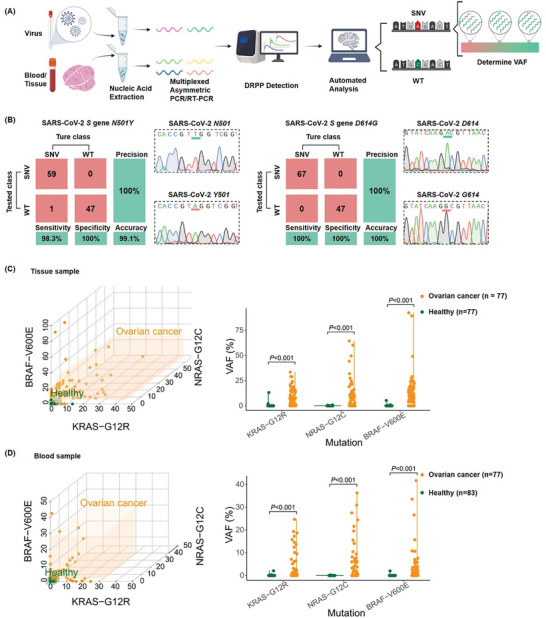
Accurate identification of single-nucleotide variants (SNVs) is paramount for disease diagnosis. Despite the facile design of DNA hybridization probes, their limited specificity poses challenges in clinical applications. Here, a differential reaction pathway probe (DRPP) based on a dynamic DNA reaction network is presented. DRPP leverages differences in reaction intermediate concentrations between SNV and WT groups, directing them into distinct reaction pathways. This generates a strong pulse-like signal for SNV and a weak unidirectional increase signal for wild-type (WT). Through the application of machine learning to fluorescence kinetic data analysis, the classification of SNV and WT signals is automated with an accuracy of 99.6%, significantly exceeding the 80.7% accuracy of conventional methods. Additionally, sensitivity for variant allele frequency (VAF) is enhanced down to 0.1%, representing a ten-fold improvement over conventional approaches. DRPP accurately identified D614G and N501Y SNVs in the S gene of SARS-CoV-2 variants in patient swab samples with accuracy over 99% (n = 82). It determined the VAF of ovarian cancer-related mutations KRAS-G12R, NRAS-G12C, and BRAF-V600E in both tissue and blood samples (n = 77), discriminating cancer patients and healthy individuals with significant difference (p < 0.001). The potential integration of DRPP into clinical diagnostics, along with rapid amplification techniques, holds promise for early disease diagnostics and personalized diagnostics.

Keywords: DNA reaction network; classification; kinetics; machine learning; single‐nucleotide variant detection; variant allele frequency.


Conflict of interest statement

The authors declare no conflict of interest.

Figures

Figure 1
Figure 1
Working principles and signal characterization of SRPP and DRPP for SNV Detection. A) Schematic of SNV detection by SRPP (TMSD probe). Both SNV and WT initiate the strand displacement reactions with the TMSD probe. The binding of WT with the TMSD probe lead to an energy penalty due to a single‐base mismatch, resulting in slower reaction rates. B) Fluorescence kinetics of TMSD probes reacting with SNV/WT (DNA sequences in Table S4, Supporting Information). Data are mean±S.D. (n = 3 independent experiments). C) Schematic of SNV detection by DRPP. The reactions in “seesaw layer” and “pathway layer” are shown. The DNA species are shown in the time‐dependent signal curve. D) Kinetics of DRRP for SNV/WT. Data are mean ± S.D. (n = 3 independent experiments). E) Procedure of SNV identification and VAF determination using machine learning‐based DRPP fluorescence kinetics analysis.
Figure 2
Figure 2
Fluorescence kinetics analysis of SNV and WT detection by DRPP. A) Schematic of the reaction of SNV and DRPP; the SNV binding to S‐Probe initiated a strand displacement reaction driven by free energy, leading to the consumption of a significant portion of SNV species. This process generated a substantial concentration of messenger DNA. Serving as a fuel molecule, the messenger DNA entered the pathway layer, triggering a “fuel dissipation” reaction, and was ultimately consumed, resulting in a pulse‐like fluorescence kinetics signal. B) Fluorescence kinetics of DRPP with different SNV concentrations. Nucleic acid species are marked. Data are mean±S.D. (n = 3 independent experiments). C) Schematic of the reaction of WT and DRPP, the WT sequences initiated a strand displacement reaction with S‐Probe. Mismatch prevented the consumption of most WT species, resulting in a low concentration of messenger DNA. This led to the simultaneous entry of low messenger DNA concentration and high WT concentration into the pathway layer. The messenger DNA first reacted with the P‐Probe, and upon digestion, the WT bound to the opened P‐Probe, blocking its re‐folding. D) Fluorescence kinetics of DRPP with different SNV concentrations. Data are mean±S.D. (n = 3 independent experiments). Nucleic acid species are marked. The forward toehold and reverse toehold of S‐Probe were 7 and 5 nt, respectively. The mismatch site was located at the 7 nt of the 3′ end of the forward toehold of S‐Probe. All reactions were performed at 37 °C in DRPP buffer. All nucleic acid species in DRPP were 100 nm, and λ Exo was 50 U mL−1. Detailed information regarding the hybridization regions of the SNV/WT, P‐Probe, and messenger DNA is shown in Figure S5 (Supporting Information).
Figure 3
Figure 3
Investigation of the reaction mechanism of DRPP. A) Validation of differential reaction pathways by fluorescence assay. Both SNV and WT were labeled fluorophore, and the P‐Probe was labeled with quencher. Other conditions of DRPP are the same as those in Figure 2A,C. B) Fluorescence kinetics of Figure 3A. WT induced irreversible fluorescence decrease by forming WT‐P‐Probe complex, while SNV did not react with P‐Probe maintaining the high fluorescence. Data are mean±S.D. (n = 3 independent experiments). C) Structures of WT and P‐Probe and possible products presented by coarse‐grained model. The green DNA strand represents WT, the purple DNA strand represents P‐Probe, and the blue is the region of interest for energy and root mean square fluctuation study. D) The coarse‐grained model simulated the energy landscape of the reaction process between WT and opened P‐Probe. E) Fluorescence kinetics from the reactions of panel A in the absence of λ Exo. Data are mean±S.D. (n = 3 independent experiments). The forward toehold and reverse toehold of S‐Probe were 7 and 5 nt, respectively. The mismatch site was located at the 7 nt of the 3′ end of the forward toehold of S‐Probe. All reactions were performed at 37 °C in DRPP buffer. All nucleic acid species in DRPP were 100 nm, and λ Exo was 50 U mL−1.
Figure 4
Figure 4
DRPP fluorescence kinetics automated classification based on machine learning. A) The workflow of the machine learning‐based automated classification process for DRPP fluorescence kinetics. The DRPP fluorescence kinetics of the SNVs and WTs in the 11 real genes in Figure 4C were randomly split into a 70% training set and a 30% testing set, and four classifier algorithms were trained for optimization. B) The confusion matrix for DRPP fluorescence kinetics is based on the RF classifier. C) SNV and WT clustering by principal component analysis based on DRPP fluorescence kinetics. D) The confusion matrix for SRPP fluorescence kinetics is based on the RF classifier, with the RF classifier recognized as the optimal model (Figure S22, Supporting Information). E) SNV and WT clustering by principal component analysis based on SRPP fluorescence kinetics.
Figure 5
Figure 5
Multi‐classification of DRPP fluorescence kinetics for VAF identification. A) Simulation of DRPP fluorescence kinetics at various SNV/WT ratios. B) Experimental fluorescence kinetics of DRPP for WT (VAF = 0%) and various VAF of 0.1%, 0.5%, 2%, 20%, and 100%. Total concentration of SNV and WT was 500 nm. C) The workflow of automated determination of VAF by machine learning algorithm. SNV was first identified by binary classification, and then VAF was determined by multi‐classification.The binary classification confusion matrix is shown in Figure S22 (Supporting Information). D) The multi‐classification confusion matrix for DRPP fluorescence kinetics of various VAFs based on RF which was recognized as the optimal model. The probability of correct determination is shown. E) Linear discriminant analysis‐based clustering of different VAFs.
Figure 6
Figure 6
SNV detection in clinical samples. A) Workflow of SNV detection in clinical samples. Nucleic acids were extracted from virus transport medium, patient serum, and tissue. The regions containing SNVs of interest were amplified by asymmetric PCR or asymmetric RT‐PCR to generate single‐stranded amplicons for DRPP detection. Multiplexed DRPP assays were performed to obtain fingerprinting signals for machine learning‐based automated analysis. B) The confusion matrix of DRPP fluorescence kinetics is based on the RF classifier, and representative Sanger sequencing results are shown. C) VAF at three mutation sites (KRAS G12R, BRAF V600E, and NRAS G12C) in ovarian cancer and healthy tissue samples. Orange: tumor samples. Green: healthy samples. p < 0.001, calculated by t‐test. D) Variant allele frequency at three mutation sites (KRAS G12R, BRAF V600E, and NRAS G12C) in ovarian cancer and healthy blood samples. Orange: tumor samples. Green: healthy samples. p < 0.001 (t‐test).

Similar articles

Cited by

References

    1. a) Miller A. M., Shah R. H., Pentsova E. I., Pourmaleki M., Briggs S., Distefano N., Zheng Y., Skakodub A., Mehta S. A., Campos C., Nature 2019, 565, 654; - PMC - PubMed
    2. b) Lo Y. D., Han D. S., Jiang P., Chiu R. W., Science 2021, 372, eaaw3616. - PubMed
    1. a) Abbosh C., Birkbak N. J., Wilson G. A., Jamal‐Hanjani M., Constantin T., Salari R., Le Quesne J., Moore D. A., Veeriah S., Rosenthal R., Nature 2017, 545, 446; - PubMed
    2. b) Shin H.‐T., Choi Y.‐L., Yun J. W., Kim N. K., Kim S.‐Y., Jeon H. J., Nam J.‐Y., Lee C., Ryu D., Kim S. C., Nat. Commun. 2017, 8, 1377. - PMC - PubMed
    1. a) Kumar S., Thambiraja T. S., Karuppanan K., Subramaniam G., J. Med. Virol. 2022, 94, 1641; - PubMed
    2. b) Antonelli M., Pujol J. C., Spector T. D., Ourselin S., Steves C. J., Lancet 2022, 399, 2263; - PMC - PubMed
    3. c) He P., Liu B., Gao X., Yan Q., Pei R., Sun J., Chen Q., Hou R., Li Z., Zhang Y., Nat. Microbiol. 2022, 7, 1635. - PMC - PubMed
    1. a) Tyagi S., Bratu D. P., Kramer F. R., Nat. Biotechnol. 1998, 16, 49; - PubMed
    2. b) Heyries K. A., Tropini C., VanInsberghe M., Doolin C., Petriv O. I., Singhal A., Leung K., Hughesman C. B., Hansen C. L., Nat. Methods 2011, 8, 649; - PubMed
    3. c) Schmitt M. W., Kennedy S. R., Salk J. J., Fox E. J., Hiatt J. B., Loeb L. A., Proc. Natl. Acad. Sci. USA 2012, 109, 14508; - PMC - PubMed
    4. d) Si Y., Wang X., Su X., Weng Z., Hu Q., Li Q., Fan C., Zhang D. Y., Wang Y., Luo S., Angew. Chem., Int. Ed. 2024, 136, e202400551. - PubMed
    1. a) Akhoundova D., Rubin M. A., Cancer Cell 2022, 40, 920; - PubMed
    2. b) Chabon J. J., Hamilton E. G., Kurtz D. M., Esfahani M. S., Moding E. J., Stehr H., Schroers‐Martin J., Nabet B. Y., Chen B., Chaudhuri A. A., Nature 2020, 580, 245. - PMC - PubMed

LinkOut - more resources