. 2025 Mar;12(12):e2413937.
doi: 10.1002/advs.202413937. Epub 2025 Feb 4.

Lgals3 Promotes Calcium Oxalate Crystal Formation and Kidney Injury Through Histone Lactylation-Mediated FGFR4 Activation

Affiliations

Lgals3 Promotes Calcium Oxalate Crystal Formation and Kidney Injury Through Histone Lactylation-Mediated FGFR4 Activation

Zehua Ye et al. Adv Sci (Weinh). 2025 Mar.

Abstract

The incidence of kidney stones is increasing worldwide. However, the underlying mechanism of the process of kidney stone formation and the kidney damage caused are not well understood. Here, it is observed that Lgals3, a β-galactoside-binding protein, is significantly increased in tissues with calcium oxalate (CaOx) stones, and in both in vivo and in vitro models. Lgals3 expression is positively correlated with the deposition of CaOx crystals. Knockout of Lgals3 markedly reduces the deposition of CaOx crystal and renal fibrosis in vivo. Furthermore, Lgals3 deficiency decrease the glycolytic rate and lactate production during the process of CaOx deposition and inhibited histone lactylation of H3K18la. Mechanistic studies shows that Lgals3 directly interacted with the key glycolysis protein pyruvate kinase M2 (PKM2) and promoted its expression by modulating E3 ligase Trim21, preventing the ubiquitination of PKM2. Furthermore, H3K18 lactylation promoted CaOx crystal deposition and kidney injury in vivo and in vitro. Lgals3 deficiency inhibites the transcription, activation, and expression of FGFR4 through inhibition of H3K18la. These findings suggest that Lgals3 may play a key role in CaOx stone formation and kidney injury by interacting with PKM2 and promoting both H3K18la-mediated gene transcription and activation.

Keywords: CaOx crystal; Lgals3; epigenetics; histone lactylation; kidney injury.


Conflict of interest statement

The authors declare no conflict of interest.

Figures

Figure 1
Figure 1
Expression and distribution of Lgals3 in both mouse and human CaOx stone specimens. A) heatmap for differentially expressed Lgals family member in the kidney tissues from NC mice and CaOx stone mice based on the RNA‐seq. B) heatmap for differentially expressed Lgals family member in the kidney tissues from NC mice and CaOx stone mice based on the DIA proteomic analysis. C) The expression of Lgals3 based on the result of RNA‐seq. D) The expression of Lgals3 based on the DIA proteomic analysis. E‐F) The immunofluorescence images and quantification of Lgals3 and α‐SMA levels in the kidney tissues from NC mice and CaOx stone mice (scale bar = 100 µm in first colcumn and 40 µm in second colcums, n = 5 mice per group). G) Immunoblots of the protein expression levels of Lgals3 in kidney tissues from NC mice and CaOx stone mice (n = 5 mice per group). H) Immunoblots of the protein expression levels of Lgals3 in HK‐2 cells treated with COM for 48h. I) Immunofluorescence images showing the Lgals3 level in HK‐2 cell with COM treated for 48h. J) Immunoblots of the protein expression levels of Lgals3 in kidney tissues from CaOx kidney stone patients (n = 10 per group). K) mRNA levels of Lgals1‐Lgals7 in kidney tissues from CaOx kidney stone patients (n = 10 per group). L,M) Immunohistochemical staining and quantification of Lgals3 in kidney tissues from CaOx kidney stone patients. (scale bar = 50 µm, n = 10 per group). N) The correlation between Lgals3 expression and kidney function (eGFR) in the clinical cohort. *P<0.01; **P<0.05.
Figure 2
Figure 2
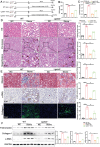
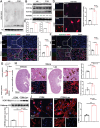
Lgals3 deficiency inhibits kidney injury and renal fibrosis caused by CaOx crystal. A) The schematic of the experimental design. B‐C) The BUN and Scr level in blood from WT mice and Lgals3 knockout (Lgals3−/−) mice (n = 5 mice per group). D) Representative images and quantification of HE and Von‐kossa staining in kidney tissues from WT mice and Lgals3 knockout (Lgals3−/−) mice (scale bar = 50 µm, n = 5 mice per group). E) Representative images and quantification of Masson staining and the immunohistochemical staining of α‐SMA and Collagen1 in kidney tissues from WT mice and Lgals3 knockout (Lgals3−/−) mice (scale bar = 50 µm, n = 5 mice per group). F) Immunoblots of the protein expression levels and quantification of Fibronectin, α‐SMA and Collagen1 in kidney tissues from WT mice and Lgals3 knockout (Lgals3−/−) mice (n = 5 mice per group). **P<0.01, compared to the NC group; # P<0.05, compared with WT‐Stone mice.
Figure 3
Figure 3
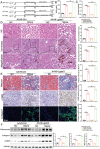
Lgals3 overexpression promotes kidney injury and renal fibrosis induced by CaOx crystal. A) The schematic of the experimental design. B,C) The BUN and Scr level in blood from AAV9‐NC mice and AAV9‐Lgals3 mice (n = 5 mice per group). D) Representative images and quantification of HE and Von‐kossa staining in kidney tissues from AAV9‐NC mice and AAV9‐Lgals3 mice (scale bar = 50 um, n = 5 mice per group). E) Representative images and quantification of Masson staining and the immunohistochemical staining of α‐SMA and Collagen1 in kidney tissues from AAV9‐NC mice and AAV9‐Lgals3 mice (scale bar = 50 um, n = 5 mice per group). F) Immunoblots of the protein expression levels and quantification of Fibronectin, α‐SMA and Collagen1 in kidney tissues from AAV9‐NC mice and AAV9‐Lgals3 mice (n = 5 mice per group). **P<0.01, compared to the NC group; # P<0.05, compared with AAV9‐Ctrl‐Stone mice.
Figure 4
Figure 4
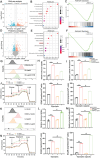
Lgals3 regulates glycolysis during the process of kidney injury caused by CaOx crystal. A) Volcano plot for differentially expressed genes (DEGs) in the kidney tissues from WT mice and Lgals3 knockout (Lgals3−/−) mice that with CaOx crystal deposition. (n = 5 mice per group). B) Bubble chart showing the KEGG pathway enrichment analysis of the DEGs. C) Gene Set Enrichment Analysis (GSEA) of WT and Lgals3−/− mice from RNA‐seq data. D) Volcano plot for differentially expressed proteins (DEPs) in the kidney tissues from WT mice and Lgals3 knockout (Lgals3−/−) mice (n = 5 mice per group). E) Bubble chart showing the KEGG pathway enrichment analysis of the DEPs. F) Gene Set Enrichment Analysis (GSEA) of WT and Lgals3−/− mice from DIA proteomic data. G) The flow cytometry was used to monitor glucose uptake in Sh‐ctrl HK‐2 and Sh‐Lgals3 HK‐2 cells incubated with 2‐NDBG. H,I) The glucose uptake and lactate production in Sh‐ctrl HK‐2 and Sh‐Lgals3 HK‐2 cells. J) Seahorse metabolic analysis to test the glycolysis in Sh‐ctrl HK‐2 and Sh‐Lgals3 HK‐2 cells. **P<0.01, compared to the Sh‐Ctrl group group; # P<0.05, compared with COM + Sh‐Ctrl group. K) The flow cytometry was used to monitor glucose uptake in Lv‐Vector HK‐2 and Lv‐Lgals3 HK‐2 cells incubated with 2‐NDBG. L,M) The glucose uptake and lactate production in Lv‐Vector HK‐2 and Lv‐Lgals3 HK‐2 cells. N) Seahorse metabolic analysis to test the glycolysis in Lv‐Vector HK‐2 and Lv‐Lgals3 HK‐2 cells. **P<0.01, compared to the Lv‐Vector group; # P<0.05, compared with COM +Lv‐Vector group.
Figure 5
Figure 5
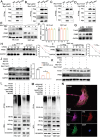
Lgals3 interacts with PKM2 and regulates PKM2 level to promote lactate generation. A) The schedule of IP‐MS. B) Silver staining showing IP products. C) The top8 proteins that binding to Lgals3. D) The overlap protein from the IP‐MS database and DIA protemic analysis. E) The peptide of PKM2 from IP‐MS. F) The molecular docking of Lgals3 and PKM2. G) Cell lysates of HK‐2 cells were immunoprecipitated with Lgals3 or PKM2 antibodies, and immunoblot assays were performed. H) 293T cells were transfected with plasmids encoding Flag‐Lgals3 or His‐PKM2. Cell lysates were immunoprecipitated with Flag and HA antibodies and immunoblot assays were performed. I) HK‐2 cells were transfected with plasmids encoding Flag‐Lgals3 or His‐PKM2. Cell lysates were immunoprecipitated with Flag and HA antibodies and immunoblot assays were performed. J) Representative images of the immunofluorescence staining of Lgals3 (green) and PKM2 (red) in kidney tissues. K) Co‐localization of Lgals3 (green) and PKM2 (red) in the HK‐2 cells.
Figure 6
Figure 6
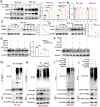
Lgals3 inhibits PKM2 Ubiquitination and degradation. A) Immunoblots of the protein expression levels of PKM2 in HK‐2 and 293T cells transfected with the indicated doses of plasmids encoding Flag‐Lgals3. **P<0.01, ***P<0.005, compared to the NC group. B) The mRNA level of PKM2 in HK‐2 and 293T cells transfected with the indicated doses of plasmids encoding Flag‐Lgals3. C) Cycloheximide (CHX) was used to block protein synthesis. Immunoblots of the protein expression levels and quantification of PKM2 in HK‐2 cells. D) Cycloheximide (CHX) was used to block protein synthesis. Immunoblots of the protein expression levels and quantification of PKM2 in 293T cells. E) Immunoblots of the protein expression levels and quantification of PKM2 in MG132 treated HK‐2 cells (n = 3 per group). F) Immunoblots of the protein expression levels and quantification of PKM2 in CQ and NH4CL treated HK‐2 cells (n = 3 per group). **P<0.01, compared to the Sh‐Ctrl group; # P<0.05, compared with Sh‐Lgals3 group. G) Detection of endogenous ubiquitination levels of PKM2 in COM treated HK‐2 cells. H) Detection of endogenous ubiquitination levels of PKM2 in kidney tissues of CaOx mice. I,J) Cells were pretreated with MG132 (5 um) for 8h. Detection of the ubiquitinated levels of PKM2 in Lgals3‐overexpression or Lgals3‐knockdown HK‐2 cells.
Figure 7
Figure 7
Lgals3 inhibits PKM2 Ubiquitination and degradation by interact with Trim21. A‐D) Cell lysates of HK‐2 cells were immunoprecipitated with Flag, Myc and His antibodies, and immunoblot assays were performed. E) Immunoblots of the protein expression levels of PKM2 in HK‐2 and 293T cells transfected with the indicated doses of plasmids encoding Myc‐Trim21. F) The mRNA level of PKM2 in HK‐2 and 293T cells transfected with the indicated doses of plasmids encoding Myc‐Trim21. G) Immunoblots of the protein expression levels and quantification of PKM2 in Trim21 knockdown HK‐2 cells (n = 3 per group). H) Cycloheximide (CHX) was used to block protein synthesis. Immunoblots of the protein expression levels and quantification of PKM2 in HK‐2 cells. I) Cycloheximide (CHX) was used to block protein synthesis. Immunoblots of the protein expression levels and quantification of PKM2 in 293T cells. J) Immunoblots of the protein expression levels and quantification of PKM2 in MG132 treated HK‐2 cells (n = 3 per group). **P<0.01, compared to the Myc‐Ctrl group; # P<0.05, compared with Myc‐Trim21 group. K) Immunoblots of the protein expression levels and quantification of PKM2 in CQ and NH4CL treated HK‐2 cells (n = 3 per group). L‐M) HK‐2 and 293T cells were pretreated with MG132 (5 um) for 8h. Detection of the ubiquitinated levels of PKM2 in Trim21‐overexpression or Trim21‐knockdown cells. N) Co‐localization of Lgals3, PKM2 and Trim21 in HK‐2 cells.
Figure 8
Figure 8
Histone lactylation promotes CaOx crystal formation and renal fibrosis. A) Immunoblots of the protein expression levels and quantification of Lacty‐lysine in HK‐2 cells with COM treated for 48h (n = 3 per group). B,C) Immunoblots of the protein expression levels and quantification of H3K9la, H3K14la, H3K18la and H3K56la in HK‐2 cells with COM treated for 48h (n = 3 per group). D) Immunofluorescence images showing the H3K18la level in HK‐2 cell with COM treated for 48h (n = 3 per group). E) Representative images and quantification of the immunofluorescence staining of Lacty‐lysine and α‐SMA in kidney tissues from NC mice and CaOx mice (scale bar = 50 um, n = 5 mice per group). F) Representative images and quantification of the immunofluorescence staining of H3K18la and α‐SMA in kidney tissues from NC mice and CaOx mice (scale bar = 50 um, n = 5 mice per group). **P<0.01, compared to the NC group. G) The schematic of the experimental design. H) Representative images and quantification of the von‐kossa staining and the immunofluorescence staining of α‐SMA in kidney tissues from mice treated with Lac (scale bar = 50 um, n = 5 mice per group). **P<0.01, compared to the Stone group. I) Immunoblots of the protein expression levels and quantification of H3K18la in HK‐2 cells with Lac treated for 48h (n = 3 per group). J) Immunofluorescence images showing the α‐SMA level in HK‐2 cell with Lac treated for 48h (n = 3 per group). **P<0.01, compared to the COM group.
Figure 9
Figure 9
Inhibition of Lgals3 reduces H3K18la during the formation of CaOx crystal. A) The schematic of the experimental design. B) Representative images and quantification of the von‐kossa staining and the immunofluorescence staining of α‐SMA in kidney tissues from mice treated with FX‐11 (scale bar = 50 um, n = 5 mice per group). **P<0.01, compared to the Stone group. C) Immunoblots of the protein expression levels and quantification of H3K18la in HK‐2 cells with FX‐11 treated for 48h (n = 3 per group). D) Immunofluorescence images showing the α‐SMA level in HK‐2 cell with FX‐11 treated for 48h (n = 3 per group). E) Immunoblots of the protein expression levels and quantification of Lacty‐lysine in Lgals3 knockdown HK‐2 cells with COM treated for 48h (n = 3 per group). F) Immunoblots of the protein expression levels and quantification of H3K9la, H3K14la, H3K18la and H3K56la in Lgals3 knockdown HK‐2 cells with COM treated for 48h (n = 3 per group). G) Immunofluorescence images showing the H3K18la level in Lgals3 knockdown HK‐2 cell with COM treated for 48h (n = 3 per group). **P<0.01, compared to the COM group. H) Representative images and quantification of the immunofluorescence staining of Lacty‐lysine and α‐SMA in kidney tissues from WT mice and Lgals3 knockout mice (scale bar = 50 um, n = 5 mice per group). I) Representative images and quantification of the immunofluorescence staining of H3K18la and α‐SMA in kidney tissues from WT mice and Lgals3 knockout mice (scale bar = 50 um, n = 5 mice per group). **P<0.01, compared to the WT+Stone group. J) Immunoblots of the protein expression levels and quantification of Lacty‐lysine and H3K18la in kidney tissues from WT mice and Lgals3 knockout (Lgals3−/−) mice (n = 5 mice per group). **P<0.01, compared to the NC group; # P<0.05, compared with WT‐Stone mice.
Figure 10
Figure 10
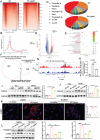
Lgals3‐mediated H3K18la targets multiple fibrosis‐related genes. A,B) The binding density of H3K18la in the transcriptional start site was visualized. C) Genome‐wide distribution of differentiated H4K12la‐binding peaks in Sh‐Ctrl HK‐2 cell and Sh‐Lgals3 HK‐2 cells. D) Volcano plot for different genetic loci bound by H3K18la in CUT‐tag. E) Bubble chart showing the KEGG pathway enrichment analysis of the H3K18la binding DEGs. F) Venn diagram showed genes downregulated in WT and Lgals3 knockout mice and the downregulated target genes bound by H3K18la. G) Integrative Genomics Viewer analysis representing H3K18la peaks at the FGFR4 locus. H) Chip‐qPCR assays of H3K18la in the FGFR4 in HK‐2 cells. I) Immunoblots of the protein expression levels and quantification of FGFR4 in kidney tissues from WT mice and Lgals3 knockout (Lgals3−/−) mice (n = 5 mice per group). **P<0.01, compared to the NC group; # P<0.05, compared with WT‐Stone mice. J) Immunoblots of the protein expression levels and quantification of FGFR4 in Lgals3 knockdown HK‐2 cells with COM treated for 48h (n = 3 per group). **P<0.01, compared to the Sh‐Ctrl group; # P<0.05, compared with COM+Sh‐Ctrl group. K) Immunofluorescence images showing the α‐SMA level in Lgals3 overexpression HK‐2 cells with BLU9931 treated for 48h (n = 3 per group). L) Immunoblots of the protein expression levels and quantification of Collagen1 and α‐SMA in Lgals3 overexpression HK‐2 cells with BLU9931 treated for 48h (n = 3 per group). **P<0.01, compared to the Lv‐Vector group; # P<0.05, compared with Lv‐Lgals3 group.
Figure 11
Figure 11
Pharmacological inhibition of Lgals3 ameliorates CaOx crystal formation and renal fibrosis. A) The schematic of the experimental design. B) The BUN and Scr level in blood from Caox stone mice and CaOx stone+MCP mice (n = 5 mice per group). C,D) Representative images and quantification of HE, Von‐kossa and α‐SMA staining in kidney tissues from Caox stone mice and CaOx stone+MCP mice (scale bar = 50 um, n = 5 mice per group). E,F) Immunoblots of the protein expression levels and quantification of PKM2, Lacty‐lysine, H3K18la, FGFR4, α‐SMA and Collagen1in kidney tissues from Caox stone mice and CaOx stone+MCP mice (n = 5 mice per group). **P<0.01, compared to the NC group; # P<0.05, compared with Stone group.
Figure 12
Figure 12
Lgals3 may be key factors involved in CaOx stone patients. A–C) Graphic presentation shows serum Lgals3 levels in a cohort of patients with nephrolithiasis (n = 10) and healthy participants (n = 10). D,E) The H3K18la level in the kidney tissues from CaOx stone patients. **P<0.01 compared to the NC group.
Figure 13
Figure 13
Schematic representation of the mechanism of Lgals3 in CaOx stone formation. Elevated Lgals3 interacted with PKM2 and promoted the expression of FGFR4 via H3K18la, thereby facilitating CaOx crystal deposition and the development of renal fibrosis.

References

    1. Singh P., Harris P. C., Sas D. J., Lieske J. C., Nat. Rev. Nephrol. 2022, 18, 224. - PubMed
    1. Peerapen P., Thongboonkerd V., Adv. Nutr. 2023, 14, 555. - PMC - PubMed
    1. Thongprayoon C., Krambeck A. E., Rule A. D., Nat. Rev. Nephrol. 2020, 16, 736. - PubMed
    1. Khan S. R., Canales B. K., Dominguez‐Gutierrez P. R., Nat. Rev. Nephrol. 2021, 17, 417. - PubMed
    1. Evan A., Lingeman J., Coe F. L., Worcester E., Kidney Int. 2006, 69, 1313. - PubMed

MeSH terms

LinkOut - more resources