LDHA- Mediated Histone Lactylation Promotes the Nonalcoholic Fatty Liver Disease Progression Through Targeting The METTL3/ YTHDF1/SCD1 m6A Axis
- PMID: 39903889
- PMCID: PMC11835221
- DOI: 10.33549/physiolres.935289
LDHA- Mediated Histone Lactylation Promotes the Nonalcoholic Fatty Liver Disease Progression Through Targeting The METTL3/ YTHDF1/SCD1 m6A Axis
Abstract
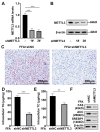
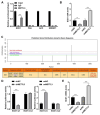
Nonalcoholic fatty liver disease (NAFLD) is characterized by elevated hepatic lipids caused by nonalcoholic factors, where histone lactylation is lately discovered as a modification driving disease progression. This research aimed to explore the role of histone 3 lysine 18 lactylation (H3K18lac) in NAFLD progression using a high-fat diet (HFD)-treated mouse model and free fatty acids (FFA)-treated L-02 cell lines. Lipids accumulation was screened via Oil Red O staining, real-time quantitative polymerase chain reaction (RT-qPCR), western blotting, and commercially available kits. Similarly, molecular mechanism was analyzed using immunoprecipitation (IP), dual-luciferase reporter assay, and RNA decay assay. Results indicated that FFA upregulated lactate dehydrogenase A (LDHA) and H3K18lac levels in L-02 cells. Besides, LDHA-mediated H3K18lac was enriched on the proximal promoter of methyltransferase 3 (METTL3), translating into an increased expression. Moreover, METTL3 or LDHA knockdown relieved lipid accumulation, decreased total cholesterol (TC) and triglyceride (TG) levels, and downregulated lipogenesis-related proteins in FFA-treated L-02 cell lines, in addition to enhancing the m6A and mRNA levels of stearoyl-coenzyme A desaturase 1 (SCD1). The m6A modification of SCD1 was recognized by YTH N6-methyladenosine RNA binding protein F1 (YTHDF1), resulting in enhanced mRNA stability. LDHA was found to be highly expressed in HFD-treated mice, where knocking down LDHA attenuated HFD-induced hepatic steatosis. These findings demonstrated that LDHA-induced H3K18lac promoted NAFLD progression, where LDHA-induced H3K18lac in METTL3 promoter elevated METTL3 expression, thereby promoting m6A methylation and stabilizing SCD1 via a YTHDF1-dependent manner. Keywords: Nonalcoholic fatty liver disease, LDHA, METTL3, YTHDF1, Histone lactylation.
Conflict of interest statement
Figures


Similar articles
-
METTL3 promotes the progression of non-alcoholic fatty liver disease by mediating m6A methylation of FAS.Sci Rep. 2025 Feb 20;15(1):6162. doi: 10.1038/s41598-025-90419-z. Sci Rep. 2025. PMID: 39979577 Free PMC article.
-
METTL3 regulated by histone lactylation promotes ossification of the ligamentum flavum by enhancing the m6A methylation of BMP2.Mol Med. 2025 Mar 25;31(1):118. doi: 10.1186/s10020-025-01173-x. Mol Med. 2025. PMID: 40133819 Free PMC article.
-
Berberine attenuates nonalcoholic hepatic steatosis through the AMPK-SREBP-1c-SCD1 pathway.Free Radic Biol Med. 2019 Sep;141:192-204. doi: 10.1016/j.freeradbiomed.2019.06.019. Epub 2019 Jun 18. Free Radic Biol Med. 2019. PMID: 31226399
-
m6A RNA Methylation and Implications for Hepatic Lipid Metabolism.DNA Cell Biol. 2024 Jun;43(6):271-278. doi: 10.1089/dna.2023.0410. Epub 2024 Apr 18. DNA Cell Biol. 2024. PMID: 38635960 Review.
-
Lactylation: a promising therapeutic target in ischemia-reperfusion injury management.Cell Death Discov. 2025 Mar 13;11(1):100. doi: 10.1038/s41420-025-02381-4. Cell Death Discov. 2025. PMID: 40082399 Free PMC article. Review.
Cited by
-
Targeting Lactylation: From Metabolic Reprogramming to Precision Therapeutics in Liver Diseases.Biomolecules. 2025 Aug 16;15(8):1178. doi: 10.3390/biom15081178. Biomolecules. 2025. PMID: 40867622 Free PMC article. Review.
-
Roles of lactylation in lipid metabolism and related diseases.Cell Death Discov. 2025 Aug 23;11(1):401. doi: 10.1038/s41420-025-02705-4. Cell Death Discov. 2025. PMID: 40849305 Free PMC article. Review.
References
MeSH terms
Substances
LinkOut - more resources
Full Text Sources
Medical
Miscellaneous
