Review
. 2025 Feb;15(2):240239.
doi: 10.1098/rsob.240239. Epub 2025 Feb 5.

Exploring glycolytic enzymes in disease: potential biomarkers and therapeutic targets in neurodegeneration, cancer and parasitic infections

Affiliations
Review

Exploring glycolytic enzymes in disease: potential biomarkers and therapeutic targets in neurodegeneration, cancer and parasitic infections

Maura Rojas-Pirela et al. Open Biol. 2025 Feb.

Abstract

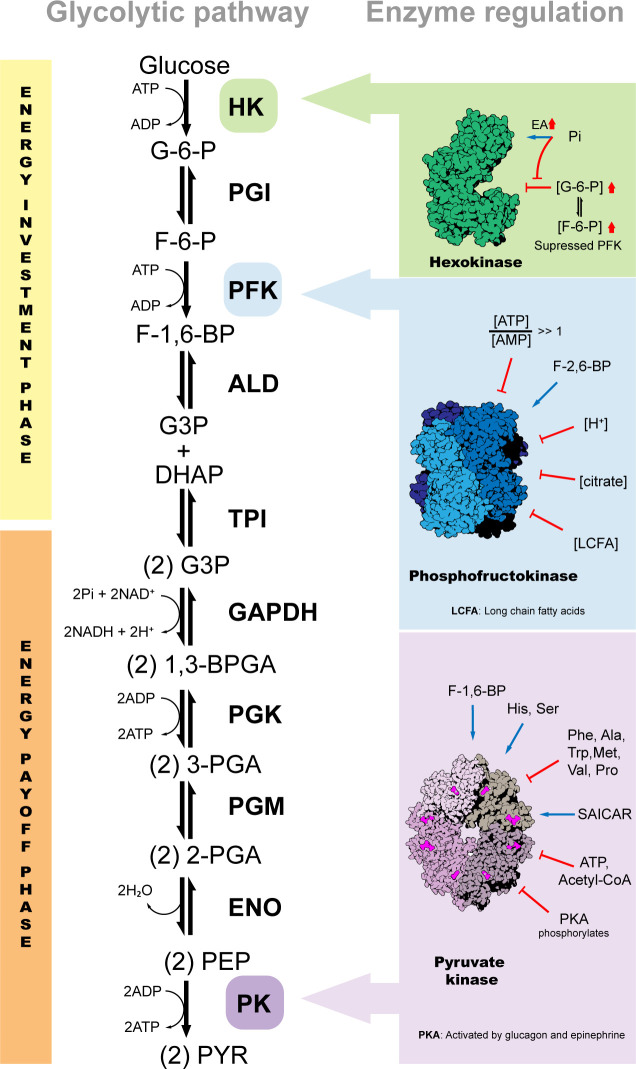
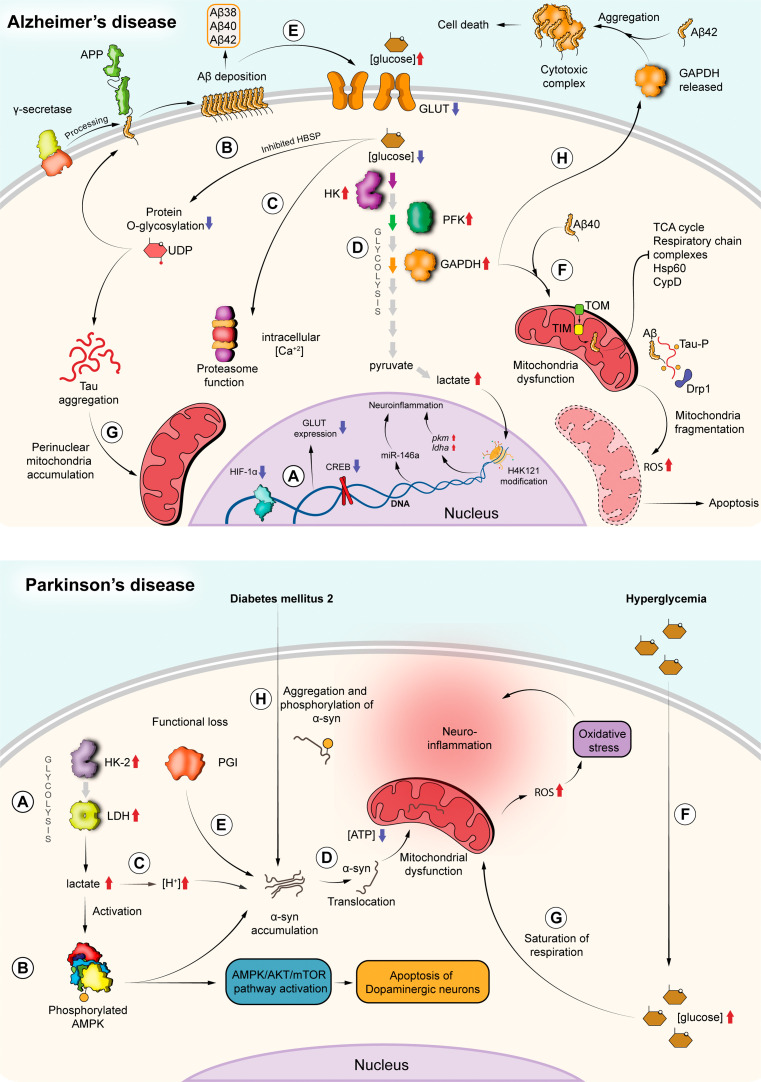
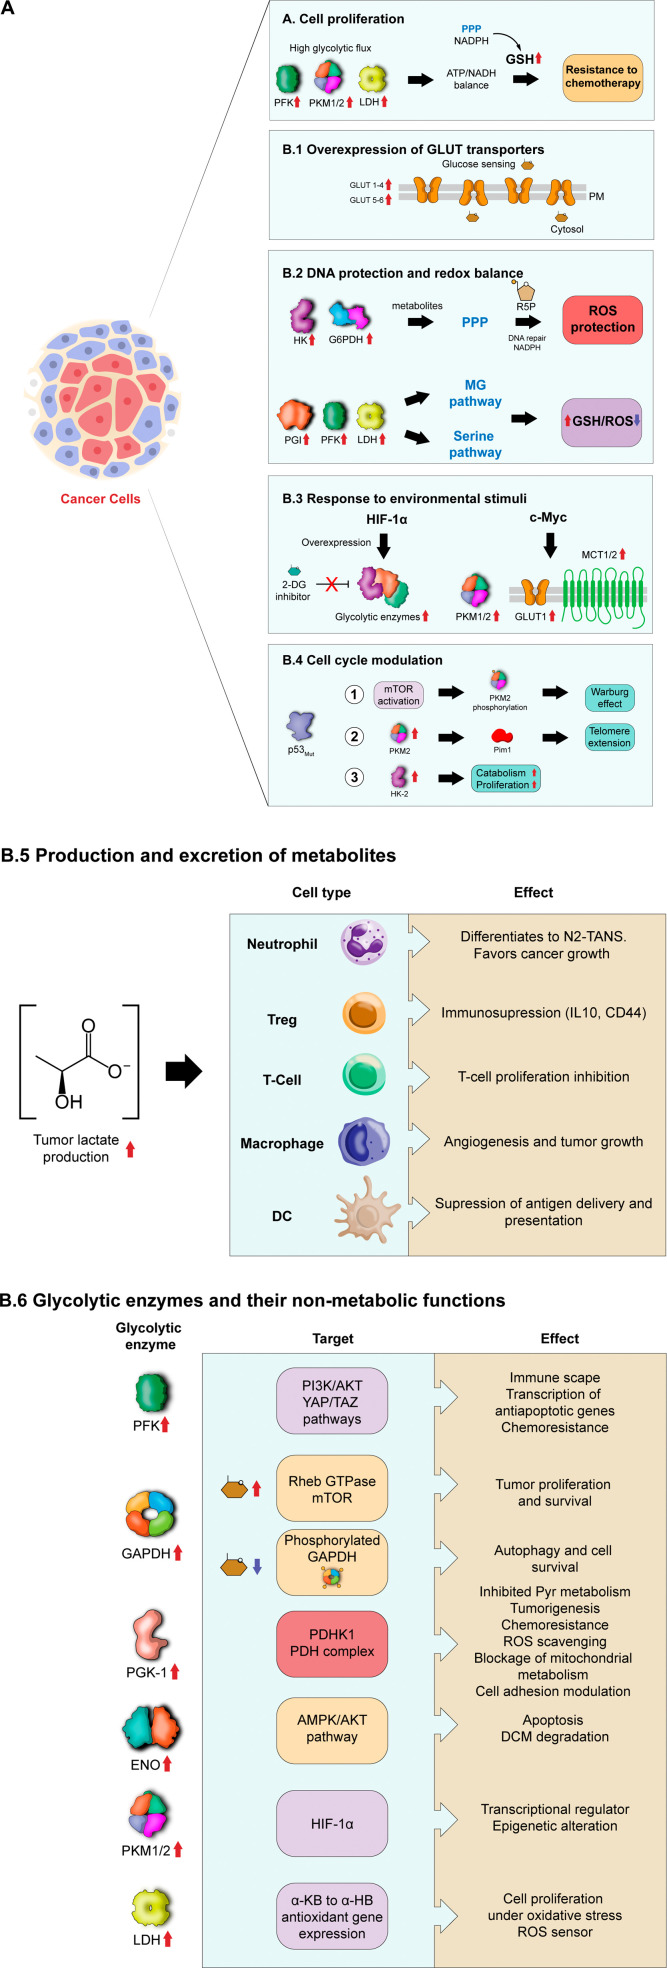
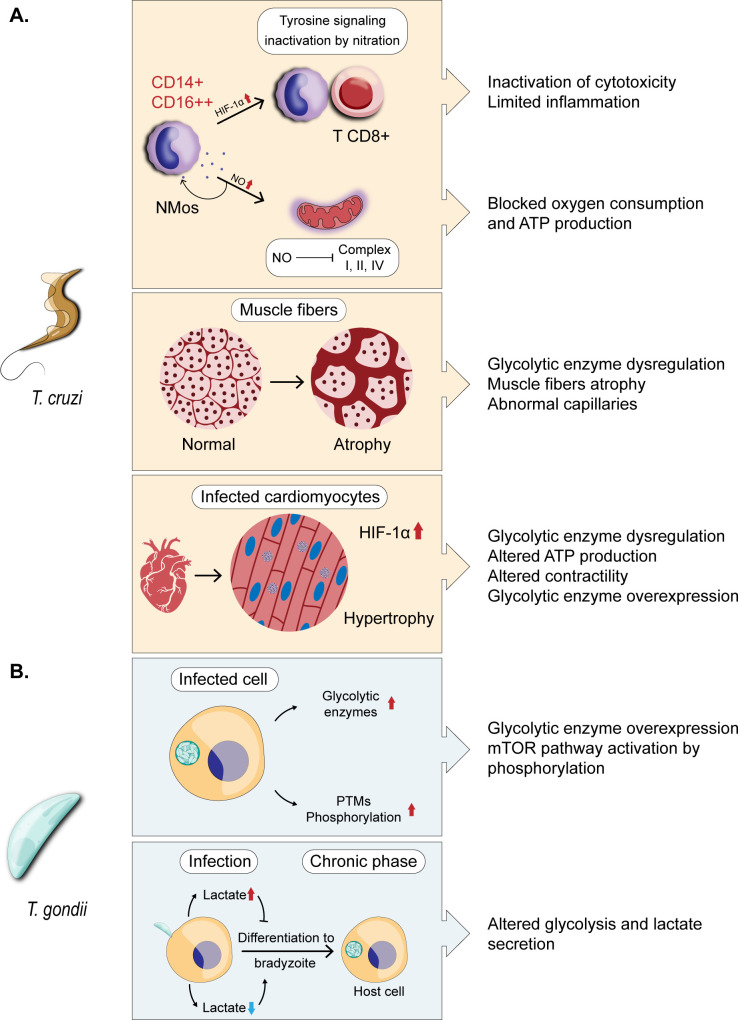
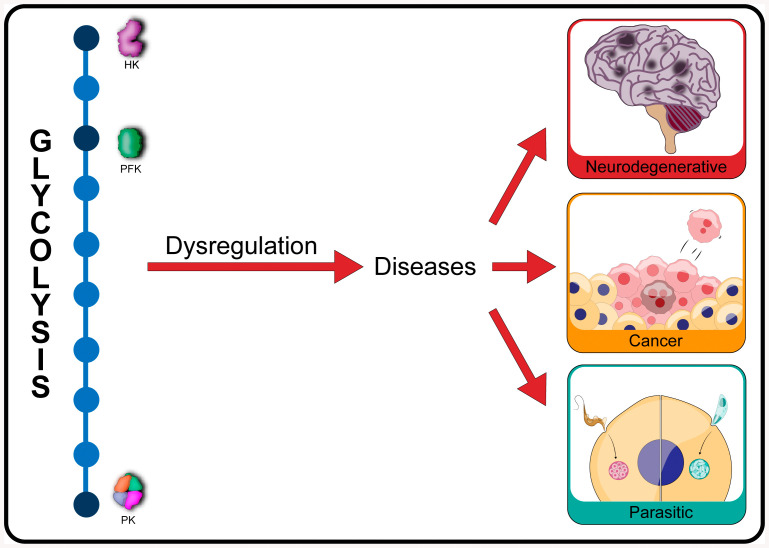
Glycolysis, present in most organisms, is evolutionarily one of the oldest metabolic pathways. It has great relevance at a physiological level because it is responsible for generating ATP in the cell through the conversion of glucose into pyruvate and reducing nicotinamide adenine dinucleotide (NADH) (that may be fed into the electron chain in the mitochondria to produce additional ATP by oxidative phosphorylation), as well as for producing intermediates that can serve as substrates for other metabolic processes. Glycolysis takes place through 10 consecutive chemical reactions, each of which is catalysed by a specific enzyme. Although energy transduction by glucose metabolism is the main function of this pathway, involvement in virulence, growth, pathogen-host interactions, immunomodulation and adaptation to environmental conditions are other functions attributed to this metabolic pathway. In humans, where glycolysis occurs mainly in the cytosol, the mislocalization of some glycolytic enzymes in various other subcellular locations, as well as alterations in their expression and regulation, has been associated with the development and progression of various diseases. In this review, we describe the role of glycolytic enzymes in the pathogenesis of diseases of clinical interest. In addition, the potential role of these enzymes as targets for drug development and their potential for use as diagnostic and prognostic markers of some pathologies are also discussed.

Keywords: diagnostic; glycolysis; pathogenesis of diseases; prognostic; therapeutic.


Conflict of interest statement

We declare we have no competing interests.

Figures

Glycolytic pathway
Figure 1.
Glycolytic pathway. This pathway contains 10 enzymatically catalysed steps and is divided into two phases, the investment phase (in which two molecules of ATP are consumed, in the reactions by HK and PFK) and the energy payment phase (where two molecules of ATP are generated, in the reactions by PGK and PYK), respectively. The pathway is regulated by the three enzymes which catalyse the reactions which, under physiological conditions, are essentially irreversible, HK, PFK and PK, through modulation of their activities by different metabolites. HK is regulated mainly by intermediates of the glycolytic pathway; it is negatively modulated by its product G-6-P and the PFK product F-6-P. Molecules such as orthophosphate (Pi) can also influence HK activity; its binding to the N-terminal part of this enzyme suppresses the inhibitory effect caused by G-6-P. For their part, PFK and PK are regulated by metabolites of different nature. PFK activity is modulated ATP, F-2,6-BP, pH; as well as by molecules such as fatty acids, and carboxylic acids (notably citrate), while PK can be modulated by PFK's product F-1,6BP, amino acids (Phe, Ala, Trp, Met, Val, Pro, His and Ser), non-glycolytic metabolites (e.g. succinyl-5-aminoimidazole-4-carboxamide-1-ribose-5′-phosphate (SAICAR)), ATP, acetyl-CoA and by post-translational modification by PKA.
Molecular processes in neurodegenerative diseases. Alzheimer’s disease (AD)
Figure 2.
Molecular processes in neurodegenerative diseases. Alzheimer’s disease (AD). (a) Expression of the glucose transporters GLUT1 and GLUT3 is compromised in neurons and astrocytes due to downregulation of the transcription factors HIF-1α and CREB. (b) The lower concentration of intracellular d-glucose affects the HSBP pathway, resulting in decreased formation of UDP-GlcNAc, and subsequently reduced O-glycosylation of Tau and APP proteins, which leads to their aggregation and deposition. (c) Additionally, an activation of the inflammatory response and an increase of the Ca2+ concentration are also consequences of HSBP inhibition. (d) The reduction of glucose transport allows the upregulation of glycolytic enzymes. (e) A positive feedback is possible since Aβ depositions affect GLUT expression, allowing more deposition of Aβ plaques. (f) Aβ plaques also affect mitochondrial functionality. Aβ42 passes through the TIM/TOM transporter and inhibits TCA-cycle enzymes and respiratory complexes. Furthermore, phosphorylation of Tau by Aβ42 in the presence of Drp1 leads to mitochondrial fragmentation, the release of ROS and apoptosis. (g) Tau accumulations are also responsible for the perinuclear localization of mitochondria and their absence from the axon. (h) GAPDH is involved in the progression of AD since it is released extracellularly to form complexes with Aβ42 that lead to cytotoxicity and cell death. Intracellularly, this enzyme also interacts with Aβ40 to disrupt mitochondria and finally induces death of the cell. Parkinson’s disease (PD). (a) Upregulation of some glycolytic enzymes, such as HK-2 and LDH-A that induce the overproduction and accumulation of lactate. (b) The activation of AMPK by phosphorylation occurs because of lactate accumulation. This event regulates negatively the mTOR pathway and subsequently induces apoptosis of dopaminergic neurons. Phosphorylated AMPK also contributes to α-syn accumulation. (c) The excess of lactate promotes acidification. (d) As a consequence, α-syn accumulates in the cytosol and migrates to mitochondria where it promotes dysfunction and reduced ATP production. (e) PGI also contributes to α-syn aggregation and neurodegeneration. (f) Hyperglycaemia causes neuroinflammation and (g) saturation of mitochondrial respiration. These changes lead to ROS production and oxidative stress. (h) Another consequence of hyperglycaemia (in this case in type 2 diabetes mellitus) is the accumulation and phosphorylation of α-syn in pancreatic and neuronal cells.
Dysregulation and effects of glycolytic enzymes in cancer
Figure 3.
Dysregulation and effects of glycolytic enzymes in cancer. (a) Cell proliferation. The upregulated PFK, PKM1/2 and LDH sustain a high glycolytic flux. Consequently, the GSH concentration increases to promote resistance to chemotherapy. (B.1) Overexpression of GLUT transporters. This overexpression promotes glucose sensing and the migratory property of cancer cells induced by glucose. (B.2) DNA protection and redox balance. The upregulation of glycolytic enzymes affects other metabolic pathways. Increased expression of HK and G6PDH feeds the PPP with G-6-P to produce key metabolites that protect against ROS. The upregulation of enzymes such as PGI, PFK and LDH contributes to the redox balance (GSH/ROS) that eventually protects the cancer cells. (B.3) Response to environmental stimuli. In cancer cells, transcription factors HIF-1α and c-Myc modulate the expression of glycolytic genes under hypoxic and normoxic conditions, respectively. Resistance to 2-DG is promoted by the increased expression of glycolytic enzymes induced by HIF-1α, while c-Myc induces the expression of GLUT and MCT1 and 2 transporters to regulate lactate concentrations in tumour cells. (B.4) Cell cycle modulation. In cancer cells, mutant p53 favours the translocation of GLUT1 to the membrane. The activation of the mTOR pathway induces the phosphorylation of PKM2 which leads to induction of the Warburg effect in cancer cells. (B.5) Production and excretion of metabolites. The high glycolytic flux of cancer cells leads to increased lactate production and excretion. This lactate modulates the response of several immune cells involving the induction or depletion of metabolites or signalling molecules. In this way, lactate affects the migration and differentiation of neutrophils, becoming cells with reduced phagocytic activity, diminished production of ROS and changes in adhesion molecules that provide a better environment for cancer metastasis. In macrophages, the epigenetic changes caused by lactate lead to cell polarization (M2 macrophages) that promotes angiogenesis and tumour growth. On the other hand, in T-cells, lactate induces the release of immunosuppressive cytokines (e.g. IL-10) in the case of Tregs or even promotes the inhibition of proliferation as occurs with other T-cells, while in dendritic cells (DC), lactate leads to alteration of the metabolic state, migration, differentiation and to the ability to process and present antigens to other immune cells. (B.6) Non-metabolic functions of glycolytic enzymes in cancer cells. The chart summarizes the most important targets and effects of the overexpression of glycolytic enzymes. The moonlighting functions of glycolytic enzymes are focused on the regulation of gene expression as a response to environmental stimuli and the activation and modulation of specific signalling pathways that favour tumorigenesis. Phosphofructokinase (PFK), glyceraldehyde-3-phosphate dehydrogenase (GAPDH), phosphoglycerate kinase (PGK), enolase (ENO), pyruvate kinase M isoforms (PKM), lactate dehydrogenase (LDH) and triose-phosphate isomerase (TPI).
Glycolytic dysregulation effect during Trypanosoma cruzi and Toxoplasma gondii borne diseases
Figure 4.
Glycolytic dysregulation effect during T. cruzi- and T. gondii-borne diseases. (a) Chagas disease (ChD). T. cruzi is responsible for inducing NMos which, among other characteristics, express HIF-1α factor and high levels of nitric oxide (NO). The high concentration of NO is responsible for inactivating tyrosine residues of signalling proteins by nitration leading to inactivation of the cytotoxicity response by CD8+T cells. On the other hand, in NMos mitochondria, NO inhibits complexes I, II and IV, thereby blocking oxygen consumption and ATP production (OXPHOS). In other cells, such as muscle cells, the contractile properties of muscles are significantly diminished during T. cruzi infection. Additionally, atrophy in fibres I and II, along abnormal capillaries, is observed in patients with advanced ChD. These changes are associated with an increased glycolytic flux and reduced oxidative activity. In cardiac tissue, T. cruzi infection induces increased expression of genes related to glycolysis, HIF-1α signalling and innate and adaptive immune responses, as well as a negative regulation of the expression of genes coding for proteins of the contractile apparatus (such as those of the sarcomere and cytoskeleton). All of this contributes to the dysfunction, cell death and progression of chagasic cardiomyopathy. (b) Toxoplasmosis. In T. gondii infection, the overexpression of glycolytic enzymes and their modulation through PTMs contribute to generating the energy requirements for the parasite to continue growing and replicating. During invasion of the host cell, the increasing lactate concentration due to glycolytic activity causes inhibition of the transformation of T. gondii trophozoites to bradyzoites. In this regard, it could be possible that the parasite senses target cells for invasion and chooses those with the lower lactate concentration that allows the bradyzoite differentiation process.
None

Similar articles

Cited by

References

    1. Fernandez-de-Cossio-Diaz J, Vazquez A. 2018. A physical model of cell metabolism. Sci. Rep. 8, 8349. (10.1038/s41598-018-26724-7) - DOI - PMC - PubMed
    1. Evans RD, Heather LC. 2019. Human metabolism: pathways and clinical aspects. Surgery 37, 302–309. (10.1016/j.mpsur.2019.03.006) - DOI
    1. Zhu J, Thompson CB. 2019. Metabolic regulation of cell growth and proliferation. Nat. Rev. Mol. Cell Biol. 20, 436–450. (10.1038/s41580-019-0123-5) - DOI - PMC - PubMed
    1. van der Knaap JA, Verrijzer CP. 2016. Undercover: gene control by metabolites and metabolic enzymes. Genes Dev. 30, 2345–2369. (10.1101/gad.289140.116) - DOI - PMC - PubMed
    1. van Steenwyk G, Jawaid A, Mansuy IM. 2019. Epigenetic inheritance of metabolic signals. In Nutritional epigenomics, pp. 167–190. San Diego, CA: Elsevier. (10.1016/b978-0-12-816843-1.00011-4) - DOI

MeSH terms

LinkOut - more resources