. 2025 Feb 4;8(4):e202503226.
doi: 10.26508/lsa.202503226. Print 2025 Apr.

Unconventional receptor functions and location-biased signaling of the lactate GPCR in the nucleus

Affiliations

Unconventional receptor functions and location-biased signaling of the lactate GPCR in the nucleus

Mohammad Ali Mohammad Nezhady et al. Life Sci Alliance. .

Abstract

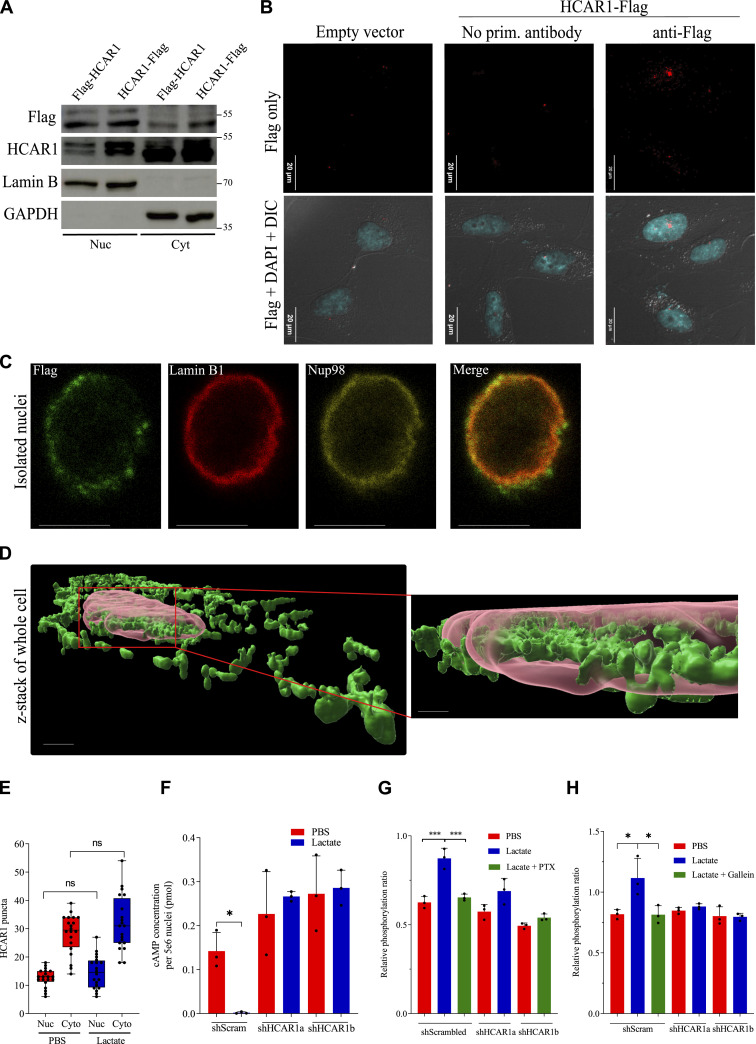
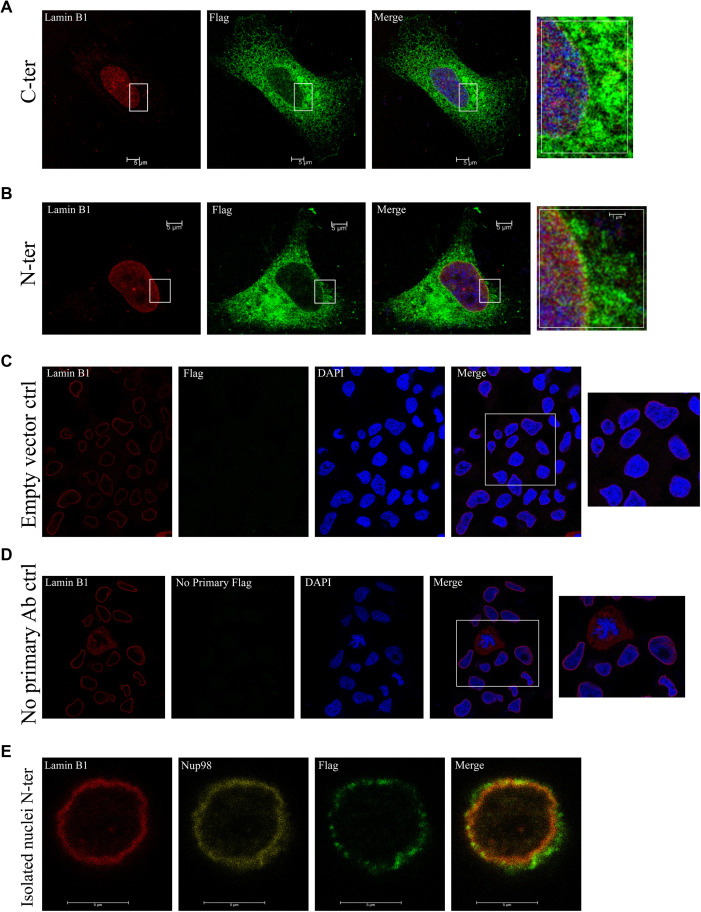
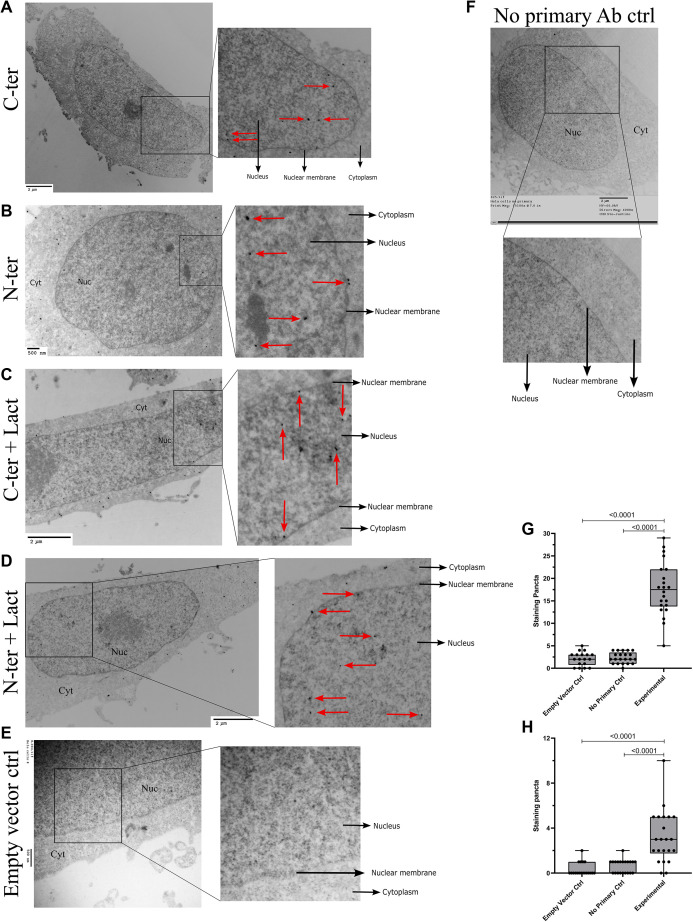
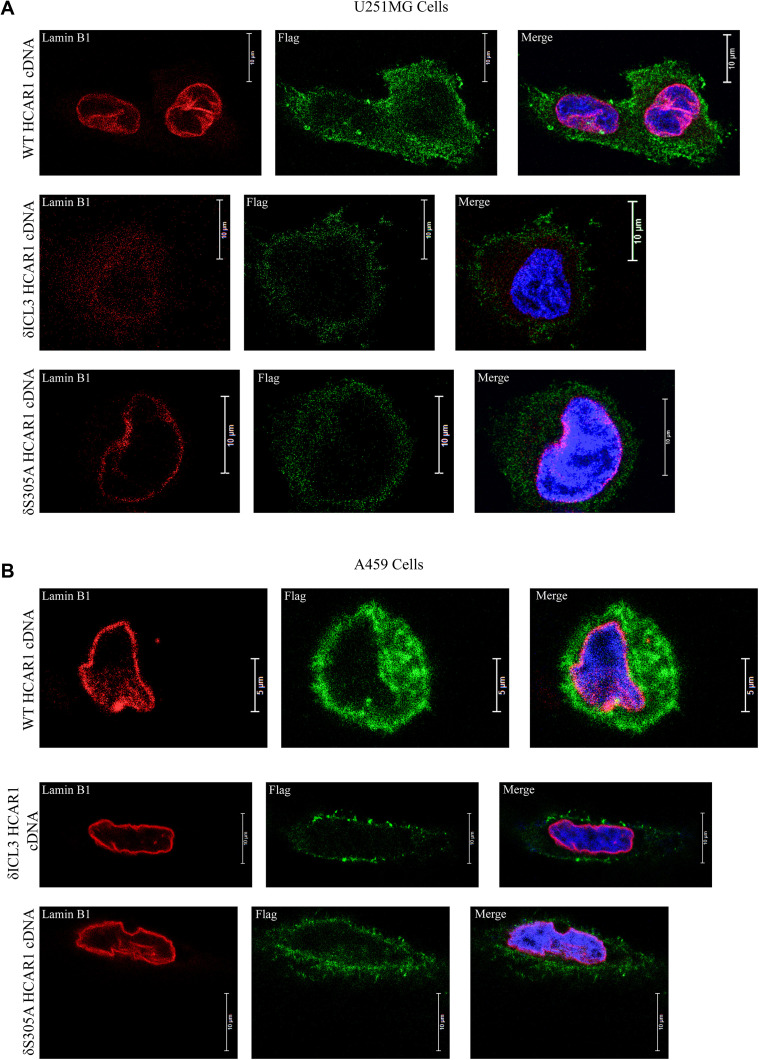
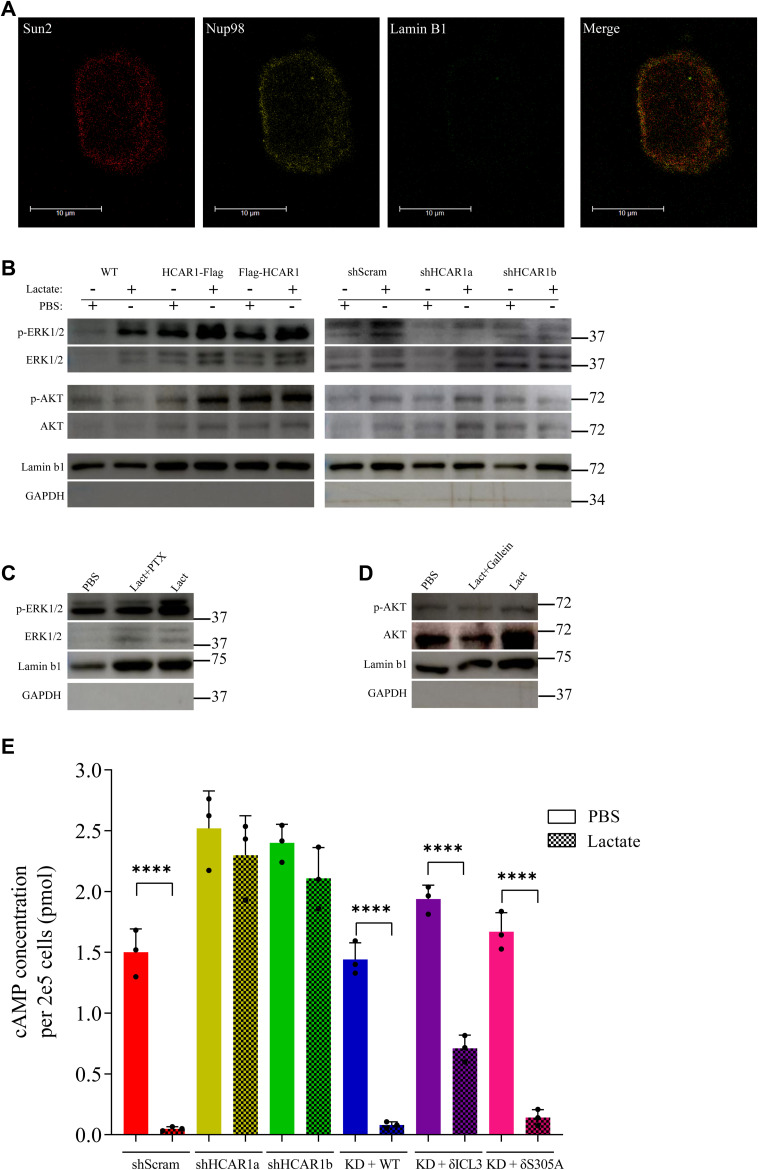
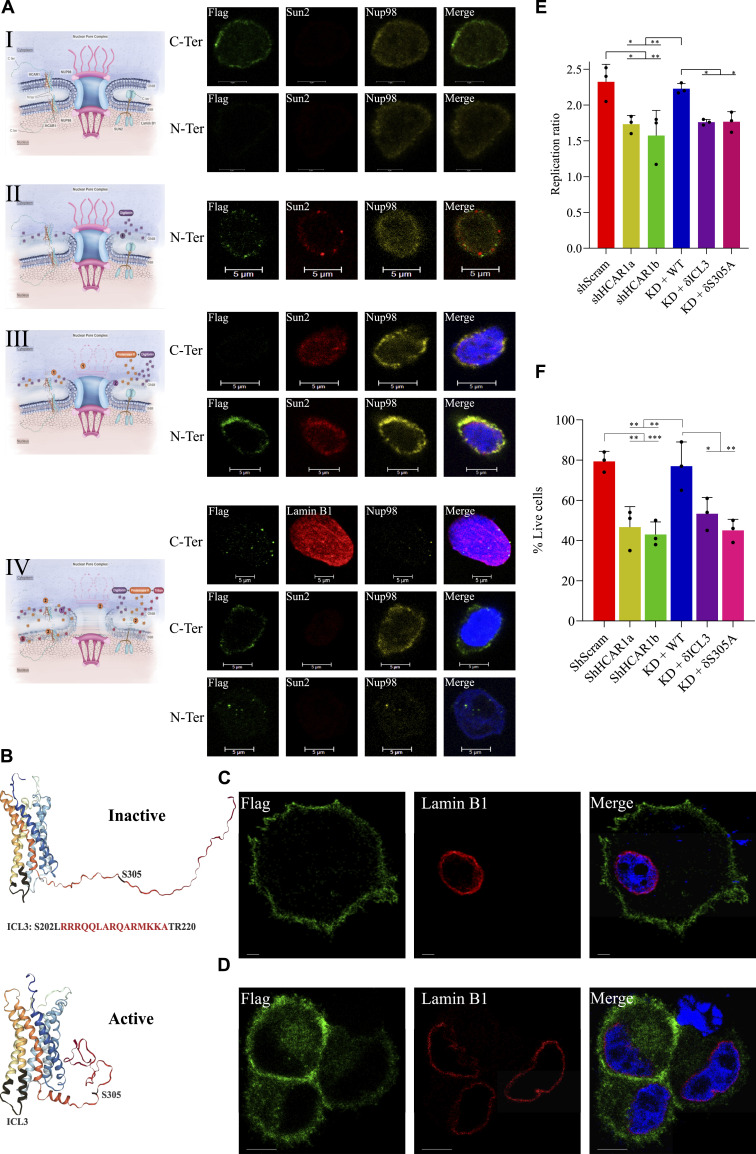
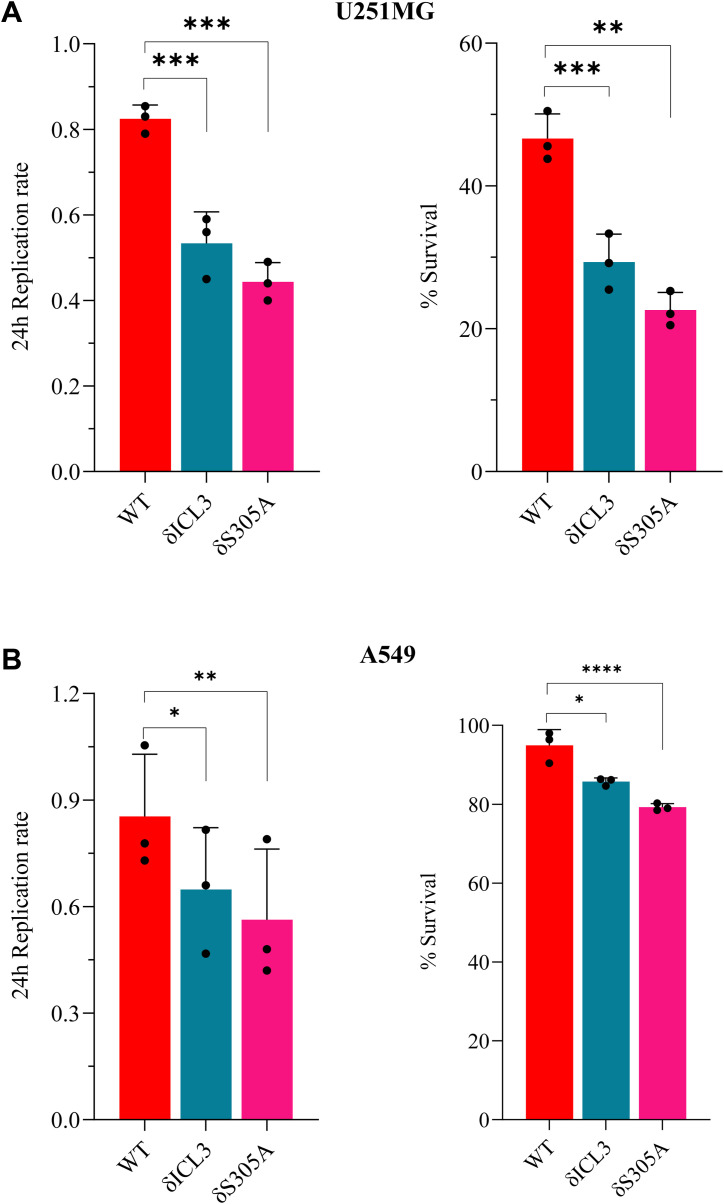
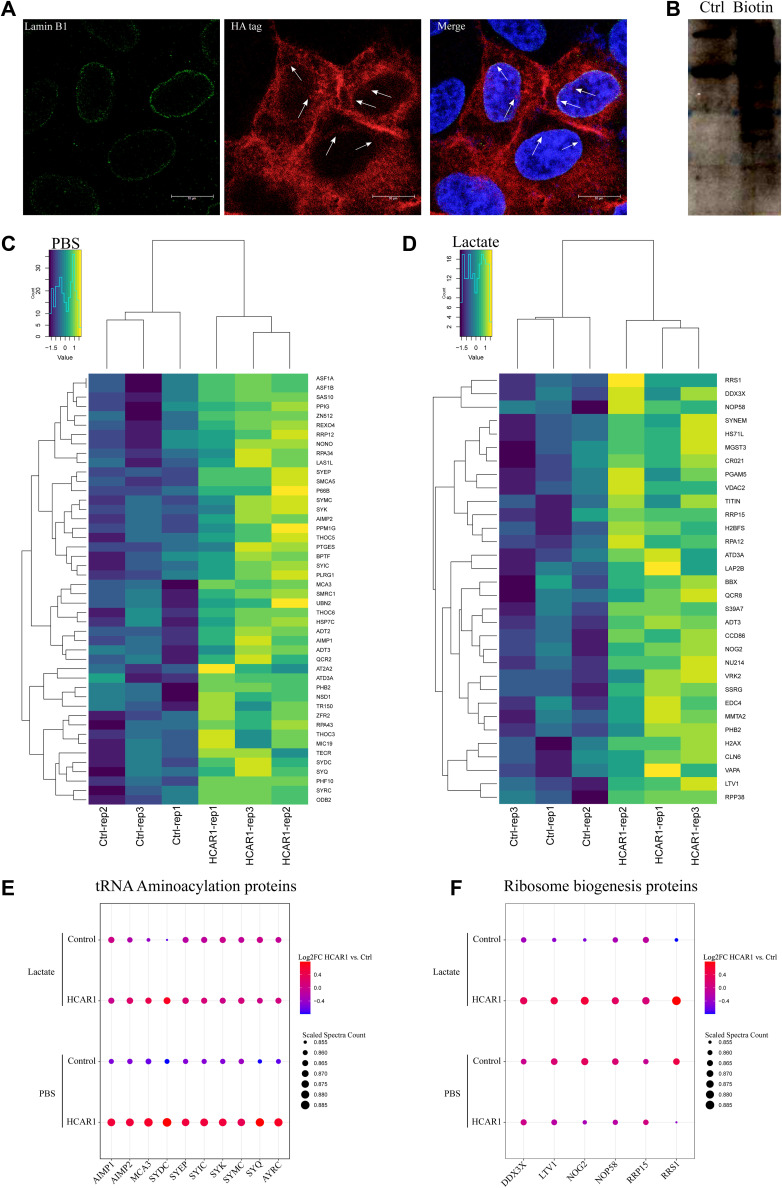
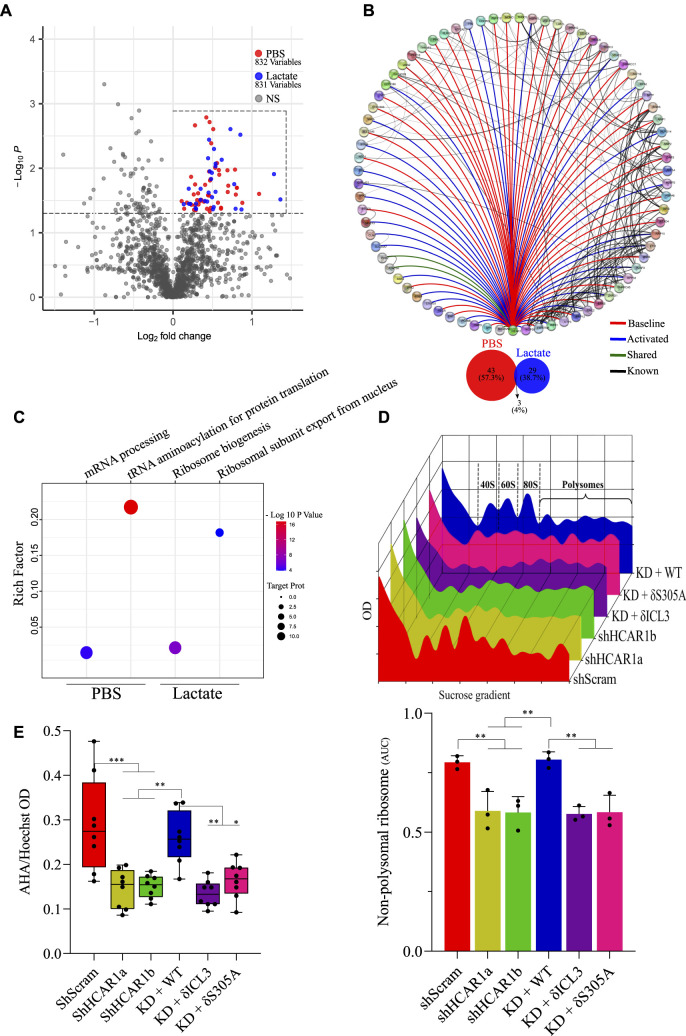
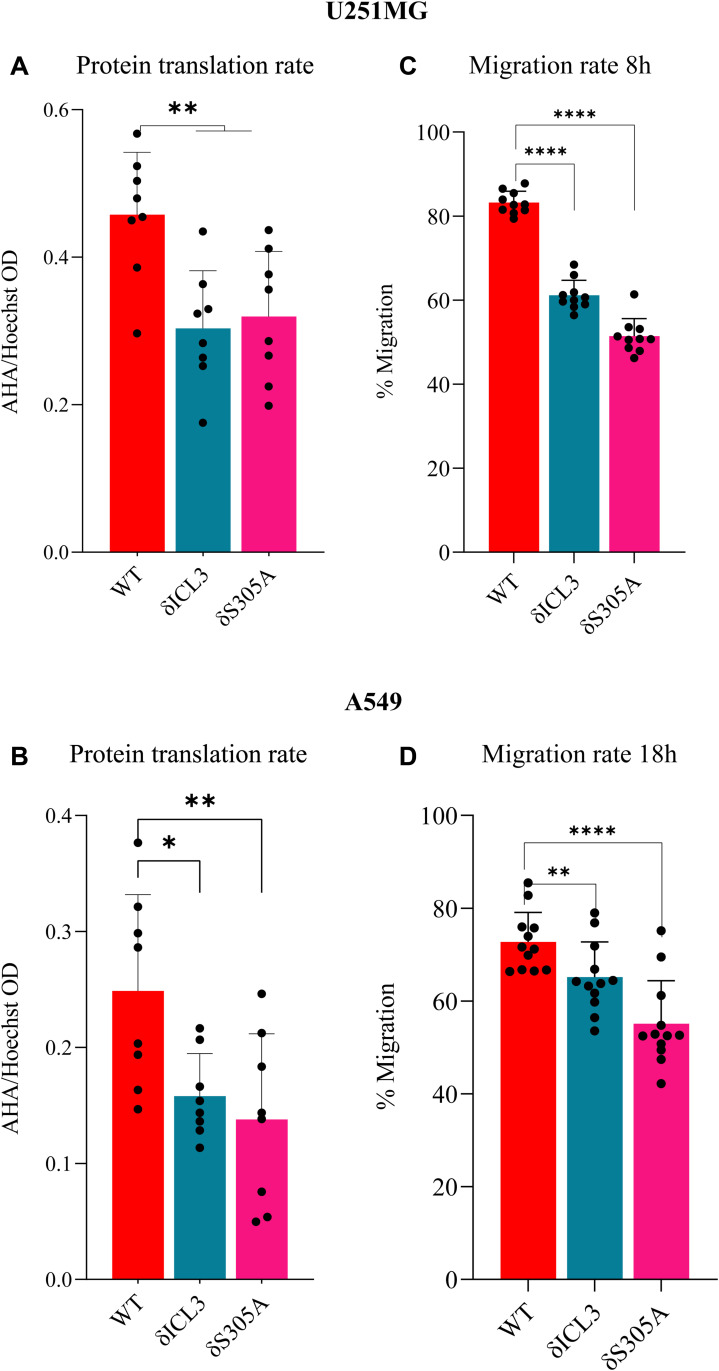
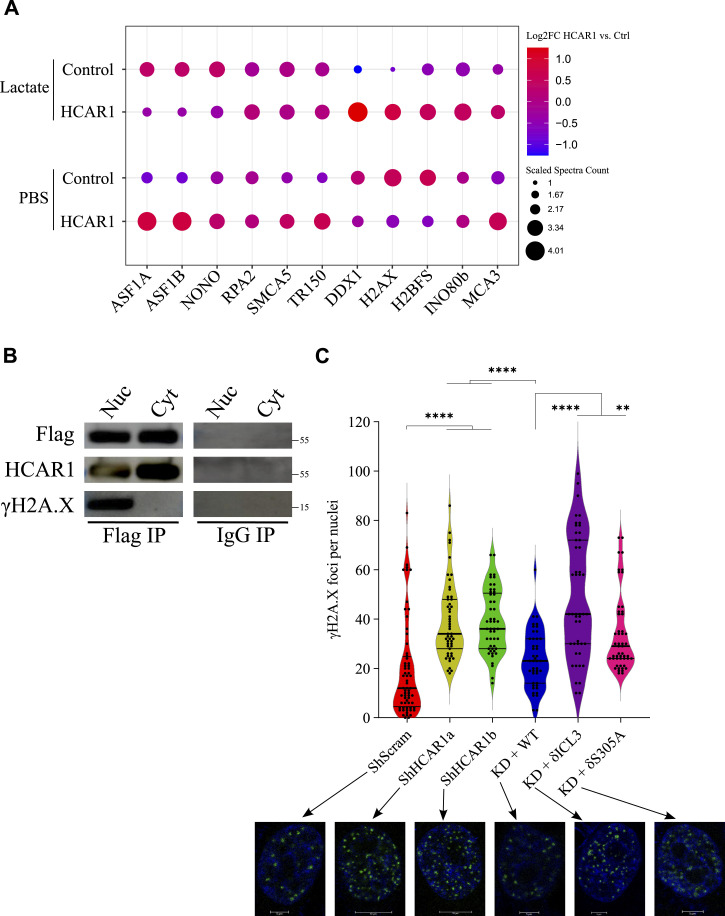
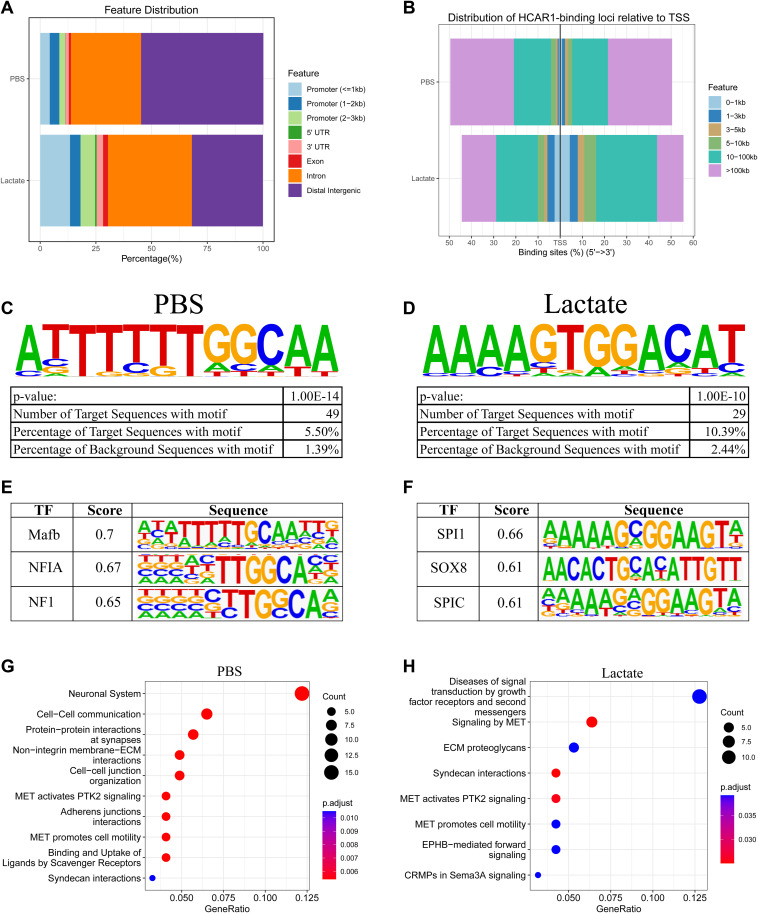
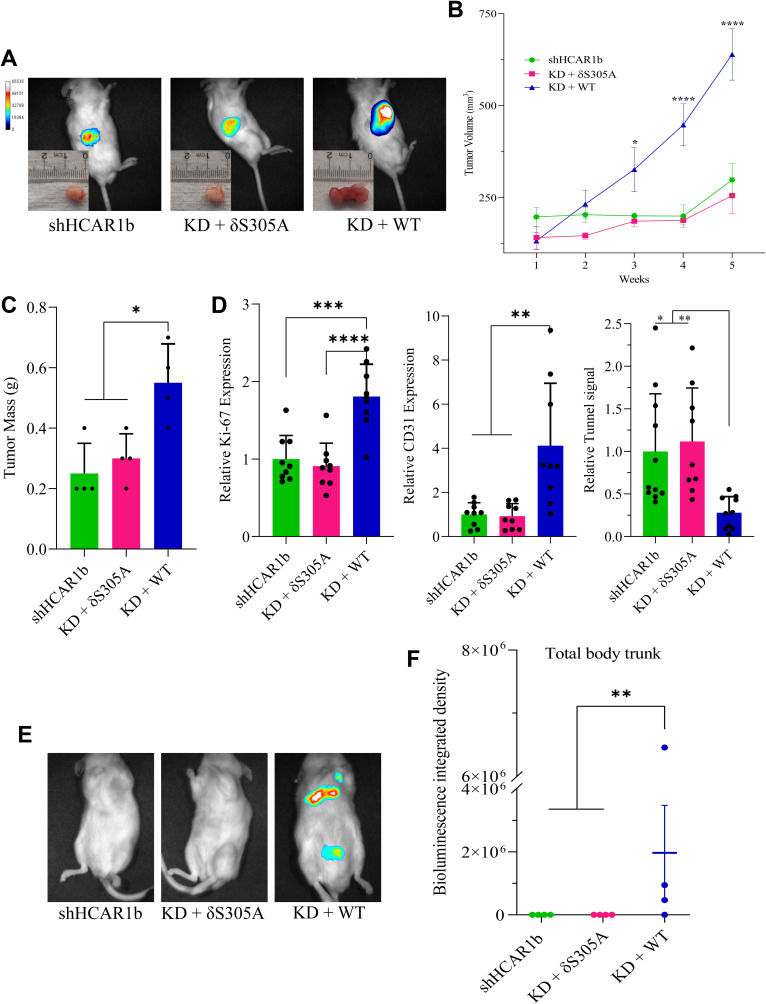
G-protein-coupled receptors (GPCRs) are virtually involved in every physiological process. However, mechanisms for their ability to regulate a vast array of different processes remain elusive. An unconventional functional modality could at least in part account for such diverse involvements but has yet to be explored. We found HCAR1, a multifunctional lactate GPCR, to localize at the nucleus and therein capable of initiating location-biased signaling notably nuclear-ERK and AKT. We discovered that nuclear HCAR1 (N-HCAR1) is directly involved in regulating diverse processes. Specifically, N-HCAR1 binds to protein complexes that are involved in promoting protein translation, ribosomal biogenesis, and DNA-damage repair. N-HCAR1 also interacts with chromatin remodelers to directly regulate gene expression. We show that N-HCAR1 displays a broader transcriptomic signature than its plasma membrane counterpart. Interestingly, exclusion of HCAR1 from the nucleus has the same effect as its complete cellular depletion on tumor growth and metastasis in vivo. These results reveal noncanonical functions for a cell nucleus-localized GPCR that are distinct from traditional receptor modalities and through which HCAR1 can participate in regulating various cellular processes.


Conflict of interest statement

The authors declare that they have no conflict of interest.

Figures

Figure 1.
Figure 1.. HCAR1 is present in the nucleus and induces nuclear location-biased signaling.
(A) Western blot analysis of biochemical fractionation from cells transfected with C & N-terminally flag-tagged HCAR1. Lamin B and GAPDH were used to confirm pure isolation of nuclei. (B) Wide-field immunofluorescence microscopy of C-terminal flagged-tagged HCAR1. The image is 4-planes of z-stacks with a step of 600 nm. (C) Confocal microscopy of C-terminally flag-tagged HCAR1 in isolated nuclei. (D) 3D rendering of z-stacked confocal images of C-terminally flag-tagged HCAR1 whole cells. Transparent red is Lamin B and green is anti-flag. Z-stack are 200 nm layers. (scale bar in the right image is 1.5 μm). (E) Quantification of HCAR1 from TEM images of PBS- and lactate-treated cells (10 mM for 1 h; Fig S2A–F) from 20 cells in two biological replicate experiments. (Nuc = nuclear; Cyto = Cytoplasmic fractions). (F) cAMP level in isolated nuclei from scrambled shRNA (endogenously expressing HCAR1) or two different HCAR1 KD cells with PBS or lactate treatment (10 mM for 10 min). The cAMP concentration is presented in picomole per 5 million nuclei. (G, H) ELISA analysis of ERK (G) and AKT (H) phosphorylation rates in isolated nuclei from scrambled shRNA (endogenously expressing HCAR1) or two different HCAR1 KD cells with PBS or lactate treatment (10 mM for 15 min). PTX or Gallein treatment of cells was performed prior to nuclei isolation. Scale bars are 5 μm, unless otherwise indicated. Source data are available for this figure.
Figure S1.
Figure S1.. Extra validations of HCAR1 nuclear localization and controls.
(A, B) Immunofluorescence confocal microscopy of C and N-terminally flag-tagged HCAR1 in HeLa cells. (C, D) Negative control experiments for HCAR1 localization with empty vector containing flag tag (C), and no primary antibody staining control (D) in immunofluorescence confocal imaging. (E) Immunofluorescence confocal imaging of N-terminally flag-tagged HCAR1 in isolated nuclei.
Figure S2.
Figure S2.. Extra validations of HCAR1 nuclear localization and controls with TEM.
(A, B) TEM graphs from N- and C-terminally flag-tagged HCAR1. (C, D) TEM images of N- and C-terminally flag-tagged HCAR1 with lactate treated (10 mM for 1 h) cells. (E, F) Negative control experiments for HCAR1 localization with empty vector containing flag tag (E), and no primary antibody staining control (F) in TEM images. (G, H) Quantification of intranuclear (G) and nuclear membrane (H) immunosignals in the negative controls (empty vector and no primary control samples) and experimental samples show the specificity of staining both in the intranuclear and on the nuclear membrane. All images are in HeLa cells.
Figure S3.
Figure S3.. HCAR1 localization in other cell lines.
(A) Immunofluorescence confocal microscopy of C-terminally flag-tagged HCAR1 in U251MG cells with WT HCAR1, δICL3 HCAR1, and δS305A HCAR1 cells. (B) Immunofluorescence confocal microscopy of C-terminally flag-tagged HCAR1 in A549 cells with WT HCAR1, δICL3 HCAR1, and δS305A HCAR1 cells.
Figure S4.
Figure S4.. Pulse-chase assay with FAP for HCAR1 shows no translocation from PM.
(A) Confocal imaging of pulse-chase FAP system with HCAR1 in HeLa cells using impermeant green fluorogen followed by lactate treatment (10 mM) for 5, 10, 20, and 40 min. (B) Immunofluorescence confocal imaging pMFAP-β1 FAP construct with C-terminally Myc-tagged HCAR1 in HeLa cells.
Figure S5.
Figure S5.. Validations for Fig 2.
(A) Immunofluorescence confocal imaging of isolated nuclei with selective ONM permeabilization with intact INM. Detection of Sun2 C-terminus indicates INM permeabilization and the absence of Lamin B1 signal indicates intact non-permeabilized INM. (B) Western-blot analysis on isolated nuclei from WT cells, cells overexpressing C- and N-terminally tagged HCAR1, shScrambled or two HCAR1 KD HeLa cells. Isolated nuclei were stimulated with PBS or lactate (10 mM for 15 min). (C, D) Western-blot analysis on isolated nuclei from shScrambled HeLa cells from different treatments. (E) cAMP level in whole cells with PBS or lactate treatment (10 mM for 10 min). The cAMP concentration is presented in picomole per 2 × 10⁵ cells. The decrease in the cAMP level with the mutant rescues show that the signaling activity of the mutant HCAR1 from the plasma membrane is largely intact.
Figure 2.
Figure 2.. Intranuclear signaling of N-HCAR1 promotes cellular proliferation and survival.
(A) Confocal images of nuclei isolated from cells expressing C-ter or N-ter flag-tagged HCAR1. (I) intact nuclei, (II) ONM permeabilized nuclei with intact INM, (III) nuclei with surface protein digestion and then ONM permeabilization with intact INM, (IV) ONM permeabilized nuclei with intact INM was treated with PK to digest proteins on the ONM and nuclear lumen, and after washing PK, nuclei were treated with triton to permeabilize INM. Notice loss of Sun2 indicating digestion of luminal proteins. (B) 3D modeling of HCAR1 in inactive and active conformations by GPCRM. The black highlights indicate the spanning regions for ICL3 (deletion of RRRQQLARQARMKKA) domain and S305. (C, D) Confocal microscopy of C-terminally flag-tagged HCAR1 with ICL3 deletion (C) and S305A substitution mutation (D). (E) Cell proliferation rate in scrambled shRNA, two different HCAR1 KD cells, WT-rescue and nuclear HCAR1 KD cell lines. (F) Cellular survival rate in 5FU-treated cells. Data are mean ± s.d. from n ≥ 3 biological replicates. Analysis of variance (ANOVA) was followed by Bonferroni post hoc correction test with *P < 0.05, **P < 0.01, ***P < 0.0001 significance levels. Scale bars are 5 μm, unless otherwise indicated. Source data are available for this figure.
Figure S6.
Figure S6.. N-HCAR1 promotes proliferation and survival in other cell lines.
(A, B) Homeostatic proliferation rate (left panel) and survival rate in 5FU-treated cells (right panel) in U251MG (A) and A549 (B) cell lines. Both U251MG and A549 cell lines are expressing lower levels of endogenous HCAR1 (see Source Data for Figure 2.1 e), so we generated stable cell lines over-expressing either WT HCAR1, or nuclear-excluded δICL3 HCAR1 and δS305A HCAR1 in these two cell lines.
Figure S7.
Figure S7.. Controls and extra validations of Fig 3.
(A) Immunofluorescence confocal imaging of HA-tagged HCAR1-BirA construct shows same localization pattern (on the nuclear membrane and in inside the nucleus) for HCAR1-BirA fusion protein as the WT HCAR1 in HeLa cells. (B) Western blot analysis with streptavidin-HRP on biotinylated whole cell lysate from PBS or Biotin-treated cells. (C, D) Heatmaps showing enrichment of proteins with HCAR1 based on Log2 fold change and P-value in isolated nuclei of PBS (C) or lactate-treated (D) cells with biotin. Control samples are from stable cell lines expressing empty Bio-ID vector, expressing only BirA. (E) Enrichment dot plot graph showing proteins enriched in tRNA aminoacylation pathway in PBS and lactate-treated cells compared with control cells. (F) Enrichment dot plot graph showing proteins enriched in ribosome biogenesis pathway in PBS and lactate treated cells compared with control cells.
Figure 3.
Figure 3.. N-HCAR1 interactome is enriched for proteins involved in translation processes and N-HCAR1 promotes protein translation rate.
(A) Volcano plot representing proteins significantly interacting with N-HCAR1. Plot shows protein abundance (log2 fold change) versus significance (−log10 P-value) in isolated nuclei of HCAR1-BirA expressing cells relative to BirA alone. Significantly enriched proteins in the upper right quadrant (proteins within the dashed square) in both PBS and lactate treated (10 mM for 24 h) samples are selected for subsequent analysis. (B) Interactome map of N-HCAR1 in both PBS and lactate treated cells. Red lines indicate interactions of enriched proteins with HCAR1 when treated with PBS, blue lines indicate interactions with HCAR1 when treated with lactate, green lines indicate interactions in both cases, and black lines represents already established interactions based on STRING. The bottom Venn diagram shows unique and overlapping significantly enriched proteins in PBS and lactate treated samples. (C) Enrichment dot plot of proteins in panel b based on gene ontology molecular functions (Panther). (D) Upper panel: representative sucrose gradient ribosomal profiling for scrambled shRNA, total and nuclear HCAR1 KD, and WT-rescue cells. Lower panel: normalized measurement of the upper panel for area under the curve (AUC) of the monosomes (40S, 60S, and 80S ribosomal subunits). (E) Protein translation rate with methionine incorporation rate measurement. Methionine incorporation rate (L-azidohomoalanine; AHA) was adjusted to the number of cells (Hoechst). Data are mean ± s.d. from n ≥ 3 biological replicates. ANOVA was followed by Bonferroni post hoc correction test with *P < 0.05, **P < 0.01, ***P < 0.0001 significance levels. Source data are available for this figure.
Figure S8.
Figure S8.. N-HCAR1 promotes protein translation and migration rates in other cell lines.
(A, B) Protein translation rate with methionine incorporation rate measurement in U251MG (A) and A549 (B) cell lines. Methionine incorporation rate (AHA) was adjusted to the number of cells (Hoechst). (C, D) Scratch assay to measure the migration rate in U251MG (C) and A549 (D) cell lines. Migration rate was measured 8 h post-scratch in U251MG cell lines and 18 h post-scratch in A549 cell lines.
Figure 4.
Figure 4.. N-HCAR1 with its interactome promotes DNA damage repair.
(A) Dot plot of enriched proteins interacting with HCAR1 that are involved in DNA damage repair. (B) Validation of BioID mass spectrometry for interaction of HCAR1 with H2AX (from Fig 3B). Co-immunoprecipitation of γH2AX with HCAR1 or IgG in fractionated cells. (Nuc = nuclear; Cyt = Cytoplasmic fractions). (C) Irradiated cells were let to recover for 4 h and the amount of DNA damage was measured with γH2AX foci. Each dot represents the number of γH2AX foci per nucleus, in four separate experiments. Underneath are the representative nuclei of irradiated cells with confocal imaging of γH2AX staining. Data are mean ± SD from n = 4 biological replicates. ANOVA was followed by Bonferroni post hoc correction test with *P < 0.05, **P < 0.01, ***P < 0.0001 significance levels.
Figure 5.
Figure 5.. HCAR1 genome-wide interactions show enrichment for genes promoting migration.
(A, B, C) ChIP-seq of HCAR1 from PBS or lactate-treated (10 mM for 1 h) cells from quadruplicate samples. For controls and validations see Source Data for Figure 5. (A) Venn diagram representing the number of genes associated with HCAR1 in each treatment. (B) Genomic distribution of HCAR1 in each treatment. Genes (exon or intron), proximal (2 kb upstream of TSS), distal (between 2 and 10 kb upstream of TSS), 5d (between 10 and 100 kb upstream of TSS), Gene desert (≥100 kb up or down stream of TSS), others (anything else). (C) Normalized number of HCAR1 peaks around TSS of genes. (D) qRT-PCR for the top 4 genes in each section of the Venn diagram (panel a). Expression levels are presented as Log2 fold changes of lactate treated (10 mM for 6 h) cells over PBS treatment (n = 4). (E) Co-alignment of histone marks from encode project from HeLa cells over HCAR1 peaks. (F) Ontological analysis of HCAR1-bound genes in PBS- and lactate-treated samples. (G) Scratch assay to measure the migration rate of cells (n = 3). Data in panel (D, G) are mean ± SD from biological replicates. Their ANOVA was followed by Bonferroni post hoc correction test with *P < 0.05, **P < 0.01, ***P < 0.0001 significance levels. TSS, Transcription Start Sites. Source data are available for this figure.
Figure S9.
Figure S9.. Extra analysis of ChIP-seq data.
(A) Detailed feature distribution of HCAR1 occupancy on the genome. (B) Distribution of HCAR1 around TSS. (C, D) The most enriched binding motifs for HCAR1 in PBS and lactate-treated conditions. (C, D, E, F) The top three match to known motifs for transcription factors with the binding motifs of HCAR1 in PBS and lactate conditions (C, D). (G, H) The reactome pathway analysis for HCAR1-bound genes with PBS and lactate treatment.
Figure 6.
Figure 6.. N-HCAR1 regulates a larger gene network than its plasma membrane/cytoplasmic counterpart.
(A, B, C) Transcriptome of PBS and lactate treated (10 mM for 6 h) samples from scrambled shRNA, shHCAR1b and shHCAR1b+RNAi resistant δS305A HCAR1 cells. For validation of RNA-seq by qRT-PCR see Fig 5D. (A) Heatmap of significantly Differentially Expressed Genes (DEGs). (B) Venn diagram representing all DEGs in each line compared with shScrambled cell lines with their corresponding treatment. (C) Bar graph representing total number of all DEGs in each line compared with shScrambled with their corresponding treatment. (D) Ontological analysis of genes that were uniquely down-regulated only in HCAR1 nuclear KD cells with PBS or lactate treatments. (E) Waterfall plots representing overall general positive regulatory function of N-HCAR1 on gene transcription in N-HCAR1-bound genes (linking ChIP-seq and RNA-seq data). The expression values are extracted from RNA-seq data of HCAR1 nuclear KD cells with PBS and lactate treatments. The expression values represent WT condition to indicate expression level of genes regulated through N-HCAR1. The gene list is extracted from PBS-treated (left panel) and lactate-treated (right panel) HCAR1 ChIP-seq data. shScrambled PBS (n = 5), shScrambled lactate (n = 3), shHCAR1b PBS (n = 4), shHCAR1b Lacate (n = 4), shHCAR1b+ RNAi δS305A HCAR1 PBS and lactate (n = 3). Source data are available for this figure.
Figure S10.
Figure S10.. N-HCAR1 promotes cancer malignancy in vivo.
(A, B, C, D) Subcutaneous injection of luciferase-expressing shHCAR1b cells, rescued or not with RNAi-resistant constructs δS305A or WT HCAR1, in NSG mice. (A) Representative images of in vivo luciferase signal and corresponding dissected tumors 5 wk after injection. (B) Tumor volume measurement. (C) Weight of dissected tumors 5 wk after injection. (D) Immunohistochemistry staining analysis from dissected tumors indicating expression levels (i.e., intensity) of Ki-67 and CD31 and cell death (TUNEL assay) relative to control samples. (E, F) Tail vein injection of the same cell lines as above in NSG mice. (E) Representative luciferase in vivo images indicating metastasis of the cells. (F) Bioluminescence intensity from body trunk of mice indicating metastasis. Each dot represents one mouse. Data in panel (B, C, F) are mean ± SEM and in panel are mean ± SD, from n = 4 biological replicates. The ANOVA was followed by Bonferroni post hoc correction test with *P < 0.05, **P < 0.01, ***P < 0.0001 significance levels.

References

    1. An YJ, Jo S, Kim J-M, Kim H, Kim HY, Jeon S-M, Han D, Yook JI, Kang KW, Park S (2023) Lactate as a major epigenetic carbon Source for histone acetylation via nuclear LDH metabolism. Exp Mol Med 55: 2238–2247. 10.1038/s12276-023-01095-w - DOI - PMC - PubMed
    1. Bhosle VK, Rivera JC, Zhou TE, Omri S, Sanchez M, Hamel D, Zhu T, Rouget R, Rabea AA, Hou X, et al. (2016) Erratum: Nuclear localization of platelet-activating factor receptor controls retinal neovascularization. Cell Discov 2: 16034. 10.1038/celldisc.2016.34 - DOI - PMC - PubMed
    1. Boleslavska B, Oravetzova A, Shukla K, Nascakova Z, Ibini ON, Hasanova Z, Andrs M, Kanagaraj R, Dobrovolna J, Janscak P (2022) DDX17 helicase promotes resolution of R-loop-mediated transcription–replication conflicts in human cells. Nucleic Acids Res 50: 12274–12290. 10.1093/nar/gkac1116 - DOI - PMC - PubMed
    1. Bourgey M, Dali R, Eveleigh R, Chen KC, Letourneau L, Fillon J, Michaud M, Caron M, Sandoval J, Lefebvre F, et al. (2019) GenPipes: An open-source framework for distributed and scalable genomic analyses. GigaScience 8: giz037. 10.1093/gigascience/giz037 - DOI - PMC - PubMed
    1. Brown TP, Ganapathy V (2020) Lactate/GPR81 signaling and proton motive force in cancer: Role in angiogenesis, immune escape, nutrition, and Warburg phenomenon. Pharmacol Ther 206: 107451. 10.1016/j.pharmthera.2019.107451 - DOI - PubMed

LinkOut - more resources