. 2025 Feb 4;16(1):1317.
doi: 10.1038/s41467-024-55635-7.

Multi-omic spatial effects on high-resolution AI-derived retinal thickness

Affiliations

Multi-omic spatial effects on high-resolution AI-derived retinal thickness

V E Jackson et al. Nat Commun. .

Abstract

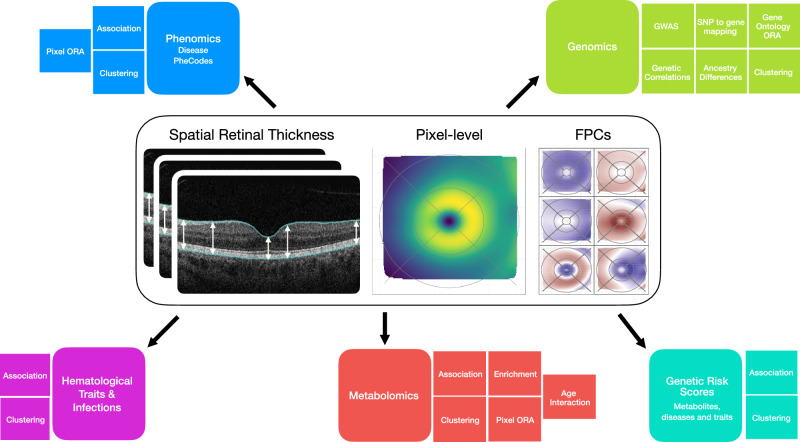
Retinal thickness is a marker of retinal health and more broadly, is seen as a promising biomarker for many systemic diseases. Retinal thickness measurements are procured from optical coherence tomography (OCT) as part of routine clinical eyecare. We processed the UK Biobank OCT images using a convolutional neural network to produce fine-scale retinal thickness measurements across > 29,000 points in the macula, the part of the retina responsible for human central vision. The macula is disproportionately affected by high disease burden retinal disorders such as age-related macular degeneration and diabetic retinopathy, which both involve metabolic dysregulation. Analysis of common genomic variants, metabolomic, blood and immune biomarkers, disease PheCodes and genetic scores across a fine-scale macular thickness grid, reveals multiple novel genetic loci including four on the X chromosome; retinal thinning associated with many systemic disorders including multiple sclerosis; and multiple associations to correlated metabolites that cluster spatially in the retina. We highlight parafoveal thickness to be particularly susceptible to systemic insults. These results demonstrate the gains in discovery power and resolution achievable with AI-leveraged analysis. Results are accessible using a bespoke web interface that gives full control to pursue findings.


Conflict of interest statement

Competing interests: A.Y.L. reports grants from Santen, personal fees from Genentech, personal fees from US FDA, personal fees from Johnson and Johnson, personal fees from Boehringer Ingelheim, non-financial support from iCareWorld, grants from Topcon, grants from Carl Zeiss Meditec, personal fees from Gyroscope, non-financial support from Optomed, non-financial support from Heidelberg, non-financial support from Microsoft, grants from Regeneron, grants from Amazon, grants from Meta, outside the submitted work; This article does not reflect the views of the US FDA. A.T. reports no direct funding conflicts with the content of the paper. Other disclosures not directly related to the content of the paper: Allergan; Annexon; Apellis; Bayer; 4DMT; Genetech; Heidelberg Engineering; Iveric Bio; Novartis; Oxurion; Roche; VisionAI. C.Y.E. reports receiving financial support from the UK Department of Health through an award made by the National Institute for Health Research to Moorfields Eye Hospital NHS Foundation Trust and UCL Institute of Ophthalmology for a Biomedical Research Centre for Ophthalmology. C.Y.E. receives consultant fees from Heidelberg Engineering and Inozyme Pharma unrelated to the scope of the current work. No competing interests reported for M.B., J.O., M.L.G., R.B., B.R.E.A., K.W., V.E.J., L.W.S., S.F., Y.K., Y.W.

Figures

Fig. 1
Fig. 1. Retinal thickness definition and overview of analyses.
Definition of retinal thickness used as the primary outcome measure, based on retinal thickness produced by a deep conovlutional neural network (DCNN). RT captures the thickness between the internal limiting membrane and the retinal pigment epithelium. RT association analyses included disease PheCodes, genomics, hematological traits & infections, metabolomics and genetic risk score associations. ORA over-representation analyses, GWAS genome-wide association studies, FPCs Functional Principal Components. OCT scan image reproduced by kind permission of UK Biobank.
Fig. 2
Fig. 2. Manhattan plots of GWAS for FPCs 1-6.
For each FPC 1-6 (AF), Manhattan plots (right) summarising the GWAS results, with each point representing a SNP, ordered by chromosome and position (x-axis). The y-axis indicates the -log10 p-value (p-values based on a two-sided t-test, for the SNP beta in the linear regression). To the left, FPC representations are shown as the Pearson correlation coefficent between individual FPC scores and each pixel-wise RT value.
Fig. 3
Fig. 3. Prioritized genes from GWAS.
Summary results for loci identified through the pixel-level and FPC GWAS. For each locus, the upper seven rows summarize the strength and direction of the genetic association; cells are coloured based on the direction of the effect estimate (blue, positive beta; red, negative beta) with the scale corresponding to the Bonferroni adjusted -log10 p-value for the sentinel SNP (p-values based on a two-sided t-test, for the SNP beta in the linear regression; Bonferroni adjusted p-values shown to allow comparison across pixel-level and FPC results). The bottom 10 rows summarize locus SNPs to gene mapping evidence, based on proximity to gene boundary ( < 5kB), presence of variants that are exonic; with CADD score > 20; colocalizaition with eQTLs; or overlap chromatin-interacting regions. Implicated genes with retina-associated phenotypes in OMIM and/or in mouse models, are also indicated. For each locus, the gene stated represents the top candidate gene, i.e., the gene with the most lines of evidence for that locus (highest “evidenceScore”, see “methods”). All candidate genes are listed in Supplementary Data 6.
Fig. 4
Fig. 4. RT spatial associations for selected ‘omics signals.
A rs62202906 (MACROD2). B rs61916712 (TSPAN11), C Clinical LDL Cholesterol, D Glucose, E Type 2 Diabetes w/o complications, F Multiple Sclerosis, G High light scatter reticulocyte count, H Platelet to lymphocyte ratio. Blue indicates a positive effect estimate (beta) of the marker on retinal thickness, while red indicates a negative effect. In panels A, B effect size is change for each copy of the effect allele. For Panels EF effect size is for presence of disease vs absence. In all other panels effect size relates to a 1 SD unit increase.
Fig. 5
Fig. 5. Overview of metabolomic results.
A Mean (bar length) and standard deviation (error bars) of effect estimates (betas) for non-derived metabolite variation with RT across all n = 29,041 pixels. Color represents the metabolic group of each metabolite. Cluster numbers are shown in brackets before each metabolite name. B Pixel-wise average effect on RT across all metabolites within each cluster from unsupervised hierarchical clustering. C Pixel-wise metabolic over-representation analysis results. Shown are Benjamini-Hochberg adjusted p-values for over-representation; p-values calculated using a hypergeometric distribution.
Fig. 6
Fig. 6. PheCode associations with RT.
A Volcano plot showing mean effect size (beta) across across all n = 29,041 pixels and median -log10(p-value) for each PheCode (P-values based on a two-sided t-test, for the PheCode beta in the linear regression model). B Barplot showing number of RT pixels showing significant associations with top PheCodes. C Heatmap showing significant association between PheCodes and RT FPCs. Color represents effect estimate direction and magnitude (red = negative, blue = positive). Size represents the magnitude of effect. D 2D smoothed results from Over-Representation analysis (ORA) on main PheCodes results. Shown are Benjamini-Hochberg adjusted p-values for over-representation; p-values calculated using a hypergeometric distribution.

References

    1. Goldman, D. Müller glial cell reprogramming and retina regeneration. Nat. Rev. Neurosci.15, 431–442 (2014). - PMC - PubMed
    1. Wang, S. K. et al. Single-cell multiome of the human retina and deep learning nominate causal variants in complex eye diseases. Cell Genom2, 100164 (2022). - PMC - PubMed
    1. Liang, Q. et al. A multi-omics atlas of the human retina at single-cell resolution. Cell Genom3, 100298 (2023). - PMC - PubMed
    1. Monavarfeshani, A. et al. Transcriptomic analysis of the ocular posterior segment completes a cell atlas of the human eye. Proc. Natl. Acad. Sci. Usa.120, e2306153120 (2023). - PMC - PubMed
    1. Yan, W. et al. Cell atlas of the human fovea and peripheral retina. Sci. Rep.10, 9802 (2020). - PMC - PubMed

LinkOut - more resources