. 2025 Feb 4;16(1):1364.
doi: 10.1038/s41467-025-56268-0.

Mapping naturally presented T cell antigens in medulloblastoma based on integrative multi-omics

Affiliations

Mapping naturally presented T cell antigens in medulloblastoma based on integrative multi-omics

Julia Velz et al. Nat Commun. .

Abstract

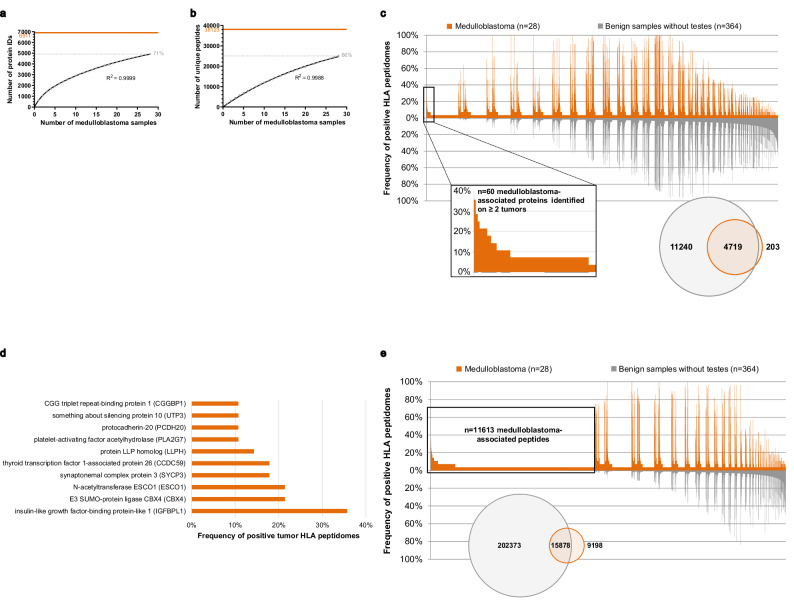
Medulloblastoma is the most frequent malignant primary brain tumor in children. Despite recent advances in integrated genomics, the prognosis in children with high-risk medulloblastoma remains devastating, and new tumor-specific therapeutic approaches are needed. Here, we present an atlas of naturally presented T cell antigens in medulloblastoma. We map the human leukocyte antigen (HLA)-presented peptidomes of 28 tumors and perform comparative immunopeptidome profiling against an in-house benign database. Medulloblastoma is shown to be a rich source of tumor-associated antigens, naturally presented on HLA class I and II molecules. Remarkably, most tumor-associated peptides and proteins are subgroup-specific, whereas shared presentation among all subgroups of medulloblastoma (WNT, SHH, Group 3 and Group 4) is rare. Functional testing of top-ranking novel candidate antigens demonstrates the induction of peptide-specific T cell responses, supporting their potential for T cell immunotherapy. This study is an in-depth mapping of naturally presented T cell antigens in medulloblastoma. Integration of immunopeptidomics, transcriptomics, and epigenetic data leads to the identification of a large set of actionable targets that can be further used for the translation into the clinical setting by facilitating the informed design of immunotherapeutic approaches to children with medulloblastoma.


Conflict of interest statement

Competing interests: L.K.F. and D.J.K. are employees, and H.G.R. is a shareholder of Immatics Biotechnologies GmbH. H.G.R. is also a shareholder of Curevac AG and ViferaXS GmbH. K.K. is currently an employee of Roche Diagnostics International Ltd and holds non-voting equity securities in F. Hoffmann-La Roche Ltd. G.M. is currently an employee of Roche Diagnostics International Ltd. M.M.J. received honoraria from Integra. T.W. has received honoraria for advisory board participation from Philogen and a research grant from Cellis. P.R. has received honoraria for lectures or advisory board participation from Bristol-Myers Squibb, Boehringer Ingelheim, Debiopharm, Merck Sharp and Dohme, Novocure, QED, and Roche and research support from Merck Sharp and Dohme and Novocure. FS received honoraria from Bayer and Illumina. F.S. is Co-founder and shareholder of Heildeberg Epignostix GmbH. Mi.W. has received research grants from Quercis and Versameb, and honoraria for lectures or advisory board participation or consulting from Novartis, Novocure, Orbus, and Philogen. M.C.N. has received a research grant from Novocure, honoraria for consulting, or lectures from WISE and MSD and Osteopore. The other authors declare no competing interests.

Figures

Fig. 1
Fig. 1. Overview of the experimental workflow and patient cohort.
a Workflow outlining the three-phase antigen discovery strategy with an in-depth immunopeptidome analysis, candidate peptide selection, and functional immunogenicity testing of selected candidate peptides. Created in BioRender. Neidert, M. (2021) BioRender.com/e22b172. b A swimmer survivable plot shows each patient’s clinical course and treatment modalities; each patient is represented by one bar. GTR gross total resection, STR subtotal resection, AWD alive with disease, AWND alive with no disease. c t-SNE analysis shows DNA methylation clustering of the patient cohort (n  =  28) with distinct methylation patterns according to the subgroups (WNT, SHH, Group 3, Group 4). (Used data set for the reference cohort:). d Bar plots depict the major chromosomal changes based on DNA methylation profiles for each subgroup. e HLA class I and II protein levels were assessed on medulloblastoma samples by immunohistochemistry, and nuclei were counterstained with hematoxylin; one patient of each subgroup (Pat. 4 / WNT, Pat. 9 / SHH, Pat. 18 / Group 3, Pat. 25 / Group 4) is shown exemplarily. The IHC staining was performed once. Source data are provided as a Source Data file.
Fig. 2
Fig. 2. Definition of medulloblastoma-associated proteins and peptides based on class I immunopeptidome analyses.
a HLA class I and II peptide yield of all 28 samples. Calculated purities refer to the proportion of HLA class I peptides annotated to an HLA allotype of the respective patient in silico by peptide binding prediction. b Length distribution of HLA class I and II peptides (each line represents one sample) shows that 71% of HLA class I peptides were 9-mers, whereas 67% of HLA class II-presented peptides had a length between 13 and 18 AA (c). Saturation analysis for identifying HLA class I proteins (d) and peptides (e) identified 91% and 75% of the estimated maximum attainable amount of distinct source proteins and peptides, respectively. f Comparative profiling of medulloblastoma’s HLA class I proteins versus an in-house benign database. Each bar in this waterfall plot (x-axis) represents a single source protein. In contrast, the frequency of positive HLA peptidomes is shown on the y-axis, separately for medulloblastoma (n = 28) and benign samples without testes (n = 418 covering 29 different human tissues). Source proteins detected on a maximum of one non-CNS-related tissue were designated as medulloblastoma-associated, whereby n = 77 were identified on at least two tumors (enlarged view on the left). The number of all source proteins detected is shown on the right. g Bar plot showing the set of 15 medulloblastoma-associated proteins naturally presented on 11–29% of tumors. h Comparative profiling of HLA class I peptides presented on medulloblastoma versus an in-house benign database. Peptides were designated as medulloblastoma-associated when detected on a maximum of one non-CNS-related tissue, whereby n = 1963 were identified on at least two tumors (enlarged view on the left). The number of all distinct HLA class I peptides is illustrated by the Venn diagram on the right. i The entirety of identified candidate peptides covers 98.64% of the world population. The percentage of individuals with a specific number of matching peptides is indicated by bar charts (left y-axis). The line diagram (associated with the right y-axis) shows the cumulative percentage of population coverage. Waterfall plots (F and H) were generated in three steps, 1. descending sorting by detection frequency (multiplied with −1) on normal samples, whereby a single detection on non-CNS tissues is treated equally to 0 detections, 2. descending sorting by detection frequency on tumors, 3. descending sorting by ratio of absolute detection numbers on tumors/absolute detection numbers on tumors + normal samples. As in the step before, a single detection on non-CNS tissues is treated equally to 0 detections. Source data are provided as a Source Data file.
Fig. 3
Fig. 3. Definition of medulloblastoma-associated proteins and peptides based on class II immunopeptidome analyses.
Saturation analysis showed that 71% and 66% of the estimated maximum attainable amount of distinct HLA class II-presented proteins (a) and peptides (b) had been identified, respectively. c Comparative profiling of the HLA class II peptidome of medulloblastoma versus an in-house benign database revealed medulloblastoma-associated source proteins (n = 60), which were identified on at least two neoplasms (enlarged view on the left). Each bar in this waterfall plot (x-axis) represents a single source protein. In contrast, the y-axis depicts the frequency of positive immunopeptidomes for medulloblastoma (n = 28) and benign samples without testes (n = 364 covering 30 different human tissues). The Venn diagram on the right compares the overlap of HLA class II peptides between tumors and benign samples (d). A set of 10 tumor-associated proteins naturally presented on 11–36% of medulloblastomas was defined and is depicted in the bar plot. e Comparative profiling of HLA class II peptides on medulloblastoma identified n = 11,613 medulloblastoma-associated peptides, whose source proteins were subjected to hotspot analysis. The Venn diagram on the left illustrates the total number of HLA class II-restricted peptides. Waterfall plots (c,e) were generated in three steps, 1. descending sorting by detection frequency (multiplied with −1) on normal samples, whereby a single detection on non-CNS tissues is treated equally to 0 detections, 2. descending sorting by detection frequency on tumors, 3. descending sorting by ratio of absolute detection numbers on tumors/absolute detection numbers on tumors + normal samples. As in the step before, a single detection on non-CNS tissues is treated equally to 0 detections. Source data are provided as a Source Data file.
Fig. 4
Fig. 4. Gene set enrichment and cancer testis antigens.
a Bar plot of the enriched gene set (The Network of Cancer Genes) based on the gene list of all HLA class I peptides. The y-axis contains the identified gene sets that were available in the Network of Cancer Genes catalog (https://genomebiology.biomedcentral.com/articles/10.1186/s13059-018-1612-0). The counts on the x-axis show the number of genes that are overlapping with the identified gene sets from the catalog. The colors are used to annotate the significance of each gene set, ranging from blue to red (p-value 0.025–0.005, respectively). The p-adjusted method of Benjamini-Hochberg was used to correct for multiple comparison with a p-value cut-off of 0.05 to determine the enriched gene set. b CNET plot of enriched genes based on the same list, however, shows the top 5 enriched gene sets (indicated with a yellow dot), genes are indicated in gray and the lines represent the presence within a gene set. c Identification of established TAAs, CTAs, and medulloblastoma-associated proteins across the present immunopeptidome dataset. (Left column) HLA class I peptides derived from 116 naturally presented TAAs and CTAs were identified, and 16 were represented by medulloblastoma-associated peptides on at least two tumors (highlighted with orange diamonds). The frequency of positive immunopeptidomes was assessed based on HLA class I peptides for tumor samples, whereby benign hits were reported independent of HLA binding probabilities of the underlying peptide identifications. (Right column) HLA class II peptides derived from 85 naturally presented TAAs and CTAs were identified, of which eight yielded tumor-associated peptides attaining a presentation frequency of ≥7% (highlighted with orange diamonds). While peptides mapping to multiple source proteins were considered to calculate the frequency of positive immunopeptidomes, these were excluded from reporting the representation by medulloblastoma-associated peptides. CTAs and TAAs exclusively identified on benign samples were not listed. Source data are provided as a Source Data file.
Fig. 5
Fig. 5. Transcriptomic profiling reveals tumor antigen gene expression and immune composition.
a Principal component analysis of bulk RNA sequencing data sets. Supervised heatmap using HLA peptide (b) and protein (c) information as input. Protein symbols were converted to gene symbols to match the gene symbols in the transcriptomics data. Transcript abundance (normalized) is indicated in the heatmap using the blue-red scale (blue for low and red for high abundance). Metadata if the samples (subgroup and sex) can be distinguished using different colors. Furthermore, the significance column indicates whether a gene symbol was found during the differentially expression analysis of the transcriptomics data in subgroup comparisons (see Supplementary Fig. 9). Relative frequencies of lymphocytes and myeloid cells (d), as well as a dedicated lymphoid (e) and myeloid (f) panel, are based on deconvolution of transcriptomics data. The deconvolution is performed with published data, which shows an accurate observation of the identified cell types in the dataset,. Source data are provided as a Source Data file.
Fig. 6
Fig. 6. Functional testing of medulloblastoma-associated candidate peptides revealed immune recognition by non-autologous CD8 + T cells.
a Workflow of non-autologous CD8 + T cell priming with artificial antigen-presenting cells. T cell responses were defined via tetramer staining and were considered positive when a 3-fold increase compared to the negative control and >1% of tetramer-positive cells among CD8 + T cells was observed. Created in BioRender. Neidert, M. (2021) BioRender.com/w57d406. b Left column (negative control): medulloblastoma-specific tetramer staining of CD8 + T cells primed with an unrelated, HLA-matched peptide. Right column: Positive tetramer staining of CD8 + T cells primed with DCLK1/287-96, WNT5A20-28, and CMKKLR181-90 demonstrating a significant antigen-specific response. Source data are provided as a Source Data file.

References

    1. Pui, C. H., Gajjar, A. J., Kane, J. R., Qaddoumi, I. A. & Pappo, A. S. Challenging issues in pediatric oncology. Nat. Rev. Clin. Oncol.8, 540–549 (2011). - PMC - PubMed
    1. Salloum, R. et al. Late morbidity and mortality among medulloblastoma survivors diagnosed across three decades: A report from the Childhood Cancer Survivor Study. J. Clin. Oncol. 37. 10.1200/JCO.18.00969 (2019). - PMC - PubMed
    1. Siegel, R. L., Miller K. D., Jemal A. Cancer statistics, 2019. CA Cancer J. Clin. 69. 10.3322/caac.21551 (2019).
    1. Northcott, P. et al. Medulloblastomics: the end of the beginning. Nat. Rev. 12, 818–834 (2012). - PMC - PubMed
    1. Kool, M. et al. Molecular subgroups of medulloblastoma: an international meta-analysis of transcriptome, genetic aberrations, and clinical data of WNT, SHH, Group 3, and Group 4 medulloblastomas. Acta Neuropathol.123, 473–484 (2012). - PMC - PubMed

LinkOut - more resources