Observational Study
. 2025 Feb 4;16(1):1342.
doi: 10.1038/s41467-025-56524-3.

Fucosylated haptoglobin promotes inflammation via Mincle in sepsis: an observational study

Affiliations
Observational Study

Fucosylated haptoglobin promotes inflammation via Mincle in sepsis: an observational study

Taylor Roh et al. Nat Commun. .

Abstract

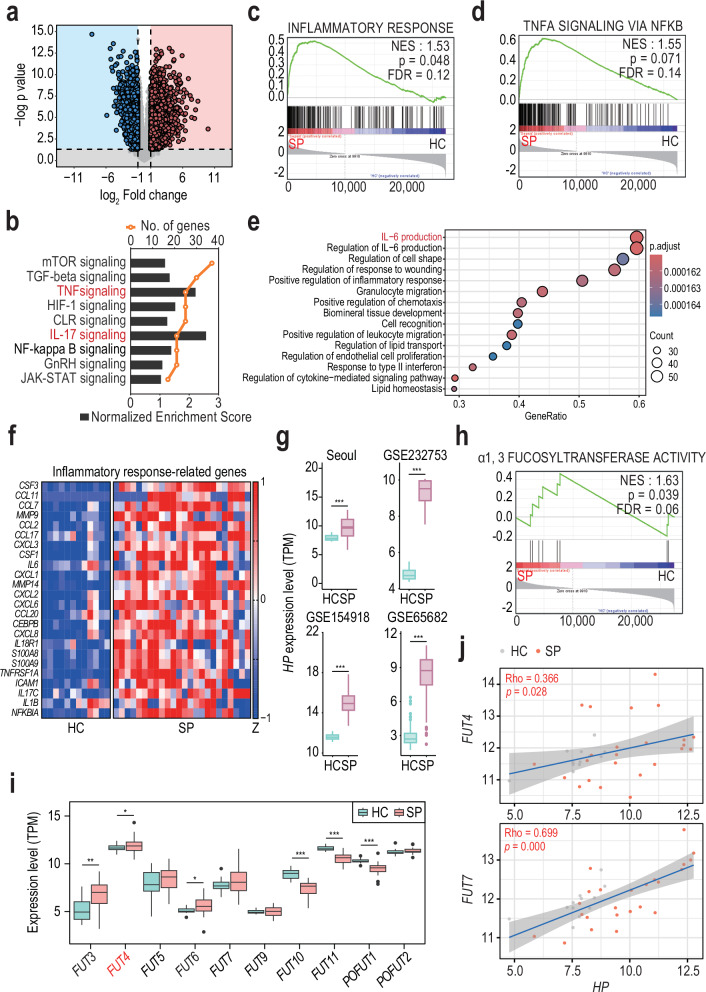
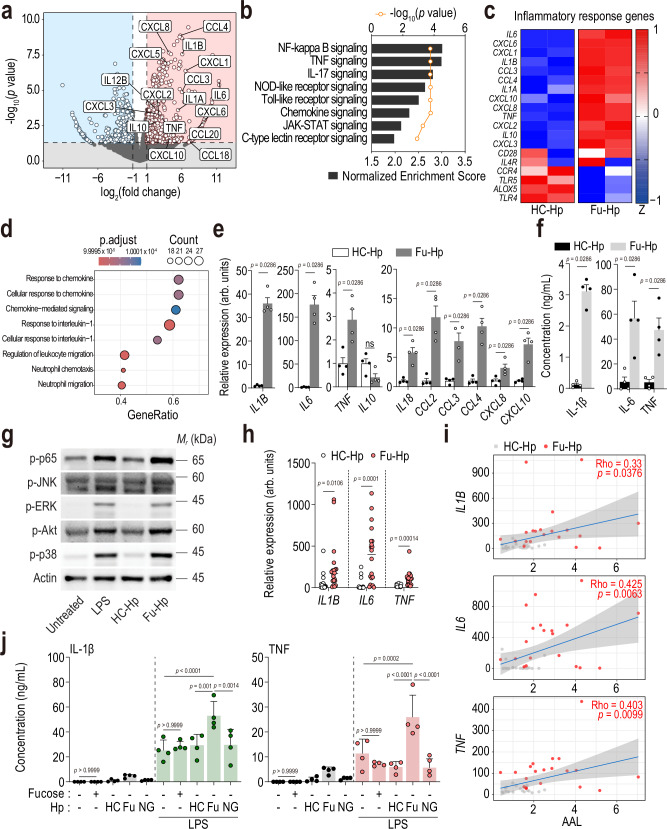
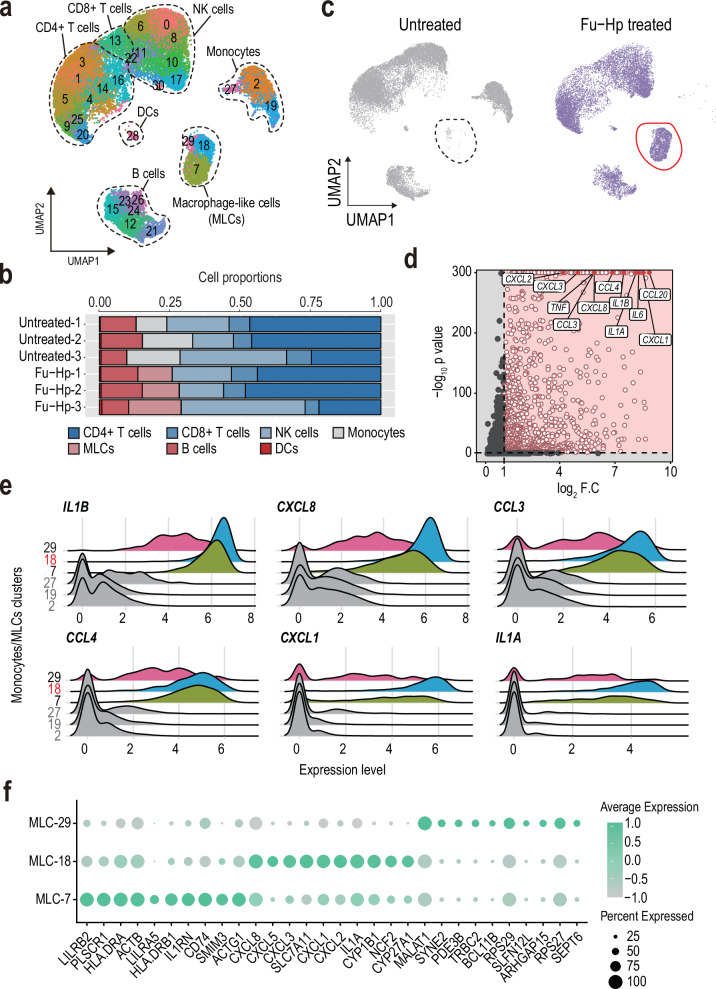
Haptoglobin (Hp) scavenges cell-free hemoglobin and correlates with the prognosis of human sepsis, a life-threatening systemic inflammatory condition. Despite extensive research on Hp glycosylation as a glyco-biomarker for cancers, understanding glycosylated modifications of Hp in sepsis patients (SPs) remains limited. Our study reveals elevated levels of terminal fucosylation at Asn207 and Asn211 of Hp in SP plasma, along with heightened inflammatory responses, compared to healthy controls (trial registration NCT05911711). Fucosylated (Fu)-Hp purified from SPs upregulates inflammatory cytokines and chemokines, along with NLRP3 inflammasome activation. Single-cell RNA sequencing identifies a distinct macrophage-like cell population with increased expressions of inflammatory mediators and FUT4 in response to Fu-Hp. Additionally, Mincle, a C-type lectin receptor, interacts with Fu-Hp to amplify the inflammatory responses and signaling. Moreover, the Hp fucosylation (AAL) level significantly correlates with the levels of inflammatory cytokines in sepsis patients, suggesting that Fu-Hp is clinically relevant. Finally, Fu-Hp treatment significantly enhances the levels of inflammatory cytokines in the plasma and various tissues of mice. Together, our findings reveal a role of Fu-Hp, derived from sepsis patients, in driving inflammation, and suggest that targeting Fu-Hp could serve as a promising intervention for combating sepsis. Trial registration NCT05911711.


Conflict of interest statement

Competing interests: The authors declare no competing interests.

Figures

Fig. 1
Fig. 1. Comparison of glycosylation status in Hp between SPs and HCs.
a AAL blotting of the sera from sepsis patients (n = 121) and healthy donors (n = 73). Statistical significance was calculated with an two-sided unpaired t-test and presented as means ± SD. b,c Lectin blotting for Hp purified from human sera with AAL and PHAL. The membrane was reblotting for β-Hp using anti-Hp antibody. Statistical significance was calculated with an two-sided unpaired t-test and presented as means ± SD. d The top panels show base peak chromatogram (BPC) with structures of major N-glycans observed in this analysis using LC(GC)-ESI MS. The middle panels show extracted ion chromatogram (EIC) of mono-fucosylated tri-antennary N-glycan labeled with aTMT (m/z 818.678 ± 6 ppm) of Hp samples (these are representative data for HC-Hp (HC2) and SP-Hp (SP32)). The bottom panels show average mass spectra (Ave. MS) during 46.0-53.0 min in BPC of the top panels. Structures, abbreviations and theoretical mass for N-glycans labeled with aTMT are shown in Supplementary Fig. 1d. e Relative abundances (%) of non-fucosylated and fucosylated N-glycans labeled with aTMT obtained from LC(GC)-ESI MS analyses of Hp samples (n = 3 for HC-Hp and n = 6 for SP-Hp). Statistical significance was calculated with a two-sided unpaired t-test and presented as means ± SD. f, Relative abundances (%) of bi-, tri- and tetra-antennary N-glycans labeled with aTMT after categorizing terminal- and core-fucosylation obtained from LC(GC)-ESI MS analyses of Hp samples (n = 3 for HC-Hp and n = 6 for SP-Hp). Statistical significance was calculated with a two-sided unpaired t-test and presented as means ± SD. g The top panels show BPC of LC(ODS)-ESI MS analysis. The middle two panels show EIC of peptide (amino acid sequence is NATAK for site 3) containing non- and mono-fucosylated tri-antennary N-glycan (m/z 831.336 and 880.021 ± 6 ppm for 3-0 and 3-F1, respectively) of Hp samples (these are representative data for HC-Hp (HC2) and SP-Hp (SP32)). The bottom panels show average mass spectra (Ave. MS) during 2.6–3.3 min in BPC of the top panels. Structures, abbreviations and theoretical mass for desialo-glycopeptides on each site are shown in Supplementary Fig. 2a. h Relative abundances (%) of non-fucosylated and fucosylated N-glycans on glycopeptide at each site obtained from LC(ODS)-ESI MS analyses of Hp samples (n = 3 for HC-Hp and n = 6 for SP-Hp). Statistical significance was calculated with a two-sided unpaired t-test and presented as means ± SD. i, Relative abundances (%) of bi-, tri- and tetra-antennary N-glycans on glycopeptide at each site obtained from LC(ODS)-ESI MS analyses of Hp samples (n = 3 for HC-Hp and n = 6 for SP-Hp). Statistical analysis was performed using the two-tailed Student’s t-test (*p < 0.05; **p < 0.01; ***p < 0.001; ****p < 0.0001). ns, not significant.
Fig. 2
Fig. 2. Transcriptome profiling comparing PBMCs between SPs and HCs.
a Volcano plots showing DEGs between 24 SP and 12 HC in Seoul cohort. DEGs with significant (p < 0.05; |log2(fold change)| > 1) changes were marked with colored dots. The blue dots represent the statistically significant downregulated genes, and the red dots represent the statistically significant upregulated genes. Statistical significance is observed for signatures above the dashed line. Two-sided p-values were calculated using the likelihood ratio test and adjusted for multiple comparisons using the Benjamini-Hochberg method to control the false discovery rate (FDR). b 9 inflammation-related KEGG pathways comparing PBMCs from SP and HC. The pathways that were significantly upregulated (q value < 0.05; normalized enrichment score > 2) were indicated as red color. Category names were shortened. Q values were calculated using the gseKEGG function of clusterProfiler package. c,d GSEA plot for inflammatory signatures comparing PBMCs from SP and HC. P values were determined by permutation test, and adjusted for multiple comparisons using the Benjamini-Hochberg method to control the false discovery rate (FDR). FDR < 0.25; NES, normalized enrichment score. e Dot plot showing the top 15 most significantly enriched GO biological process (BP) in PBMCs of SP vs HC; color indicates adjusted p values, while the dot size represents the gene count associated with each pathway. The p values were calculated using the hypergeometric test and adjusted for multiple comparisons using the two-sided Benjamini–Hochberg method. f Heatmap depicting TPM values of inflammatory response-related genes from IL-17 signaling, TNF signaling (KEGG) and Inflammatory response (HALLMARK) geneset in PBMCs of SP (n = 24) versus HC (n = 12). Z-score (Z). g Box-and-whisker plot illustrating the expression of the HP gene across four cohorts: Seoul, GSE232753, GSE154918, and GSE65682. The lower and upper hinges of the box represent the 25th and 75th percentiles, and the whiskers extend to the minimum and maximum values within 1.5 times the interquartile range. The median value is depicted by the line within the box. Statistical significance was calculated with a two-tailed t-test without adjustment (***p < 0.001). h GSEA plot for ‘α1,3 FUCOSYLTRANSFERASE ACTIVITY’ GO molecular function (MF) gene set in PBMCs of SP vs HC. P values were determined by permutation test, and adjusted for multiple comparisons using the Benjamini-Hochberg method to control the false discovery rate (FDR). i, Box-and-whisker plot illustrating the expression of the indicated genes. The lower and upper hinges of the box represent the 25th and 75th percentiles, and the whiskers extend to the minimum and maximum values within 1.5 times the interquartile range. The median value is depicted by the line within the box. Statistical significance was calculated with a two-tailed t-test without adjustment (*p < 0.05; **p < 0.01; ***p < 0.001). j Correlation between the expression of the HP gene (x-axis) and the expression of either the FUT4 or FUT7 gene (y-axis) with the best linear fit plotted. Pearson correlation coefficients were calculated to assess the linear association. The shaded area represents the 95 % confidence interval. P values were calculated using a t-distribution with [n-2] degrees of freedom. Pearson’s correlation coefficient and the p value are displayed in the top-left corner.
Fig. 3
Fig. 3. Fu-Hp induces inflammatory responses in human primary PBMCs.
a Volcano plots showing DEGs in PBMCs after Fu-Hp (n = 2) or HC-Hp (n = 2) treatment (20 μg/mL for 6 h). DEGs with significant (p < 0.05; |log2(fold change)| > 1) changes were marked with colored dots. Significantly increased cytokine/chemokine genes were labeled. Statistical significance is observed for signatures above the dashed line. Two-sided p-values were calculated using the likelihood ratio test and adjusted for multiple comparisons using the Benjamini-Hochberg method to control the false discovery rate (FDR). b Top 8 inflammation-related KEGG pathways comparing Fu-Hp-treated PBMCs and HC-Hp-treated PBMCs. Category names were shortened. P values were calculated using the cumulative hypergeometric distribution. c Heatmap depicting TPM values of inflammatory response genes (HALLMARK) in HC-Hp or Fu-Hp-treated PBMCs. Z-score (Z). d Dot plot depicting the eight most significantly enriched GO BP, comparing PBMCs treated with Fu-Hp to untreated controls. Color indicates adjusted p values, while the dot size represents the gene count associated with each pathway. The p values were calculated using the hypergeometric test and adjusted for multiple comparisons using the two-sided Benjamini–Hochberg method. e The relative expression of inflammatory genes, including IL1B, IL6, TNF, IL10, IL18, CCL2, CCL3, CCL4, CXCL8, and CXCL10 in PBMCs after treatment with HC-Hp or Fu-Hp using qRT-PCR (n = 4 per group). Statistical significance was calculated with a two-sided unpaired t-test with Mann-Whitney test and presented as means ± SEM. arb. units, arbitrary unit; ns, not significant. f, The concentrations of IL-1β, IL-6, and TNF in the supernatants of HC-Hp or Fu-Hp treated-PBMCs (20 μg/mL for 18 h) measured by ELISA (n = 4 per group). Statistical significance was calculated with an unpaired t-test with Mann-Whitney test and presented as means ± SEM. g Western blotting for phosphorylated NF-κB (p-p65), phosphorylated ERK (p-ERK), phosphorylated JNK (p-JNK), phosphorylated Akt (p-Akt), and phosphorylated p38 (p-p38) in HC-Hp or Fu-Hp-treated PBMCs (n = 1; 20 μg/mL for 30 min). h The relative expression of IL1B, IL6, and TNF in PBMCs from a healthy donor after treatment with HC-Hp or Fu-Hp derived from different 20 people (20 μg/mL for 6 h) using qRT-PCR. Statistical significance was calculated with a two-tailed unpaired t-test and presented as means ± SD. arb. units, arbitrary unit. i, Correlation between the expression of the AAL level (x-axis) and the expression of either the relative expression of indicated genes (IL1B, IL6, and TNF) (y-axis) with the best linear fit plotted (n = 20 per each group). The shaded area represents the 95 % confidence interval. P values were calculated using a t-distribution with [n-2] degrees of freedom. Pearson’s correlation coefficient and the p value are displayed in the top-right corner. j The concentrations of IL-1β and TNF in the supernatants of PBMCs measured by ELISA (n = 4 per group). PBMCs were treated L-fucose and Hp. Statistical significance was calculated with a one-way ANOVA test with Bonferroni’s multiple correction and presented as means ± SEM.
Fig. 4
Fig. 4. ScRNA-seq analysis of Fu-Hp-treated PBMCs reveals a distinct macrophage-like cell cluster associated with inflammatory responses.
a Unsupervised UMAP analysis on PBMCs pooled from three untreated and three Fu-Hp treated persons (16961 cells untreated, 14063 cells Fu-treated). Cell populations were mapped onto the UMAP landscape to visualize the distribution of cells across clusters using the RunUMAP and Dimplot function in seurat package. b Bar plot of the proportion of cell types shown in a, separated by 3 untreated samples and 3 Fu-Hp-treated samples. c The UMAP plot illustrating the alterations in cell proportions induced by Fu-Hp treatment. d Volcano plot depicting increased DEGs in Fu-Hp-treated PBMCs. Significantly increased cytokine/chemokine genes were labeled (adjusted p values < 0.06-301). P values were calculated by the FindMarkers function in Seurat 5.0.1 package using the default two-sided Wilcoxon Rank Sum test. e Ridge plots displaying the expression patterns of indicated genes in subpopulations of monocytes (2, 19, and 27) and macrophages (7, 18, and 29). f Expression of selected markers for sub-clusters (7, 18, and 29) of MLC populations.
Fig. 5
Fig. 5. Fu-Hp induces inflammatory responses and NLRP3 inflammasome activation in monocytes and macrophages.
a The relative expression of IL1B, IL6, TNF, IL10, IL12B, CCL2, and CXCL2 in monocytes from a HC after treatment with HC-Hp or Fu-Hp (20 μg/mL for 6 h) using qRT-PCR (n = 3 per each group). Statistical significance was calculated with a two-tailed unpaired t-test and presented as means ± SD. arb. units, arbitrary unit. ns, not significant. b, The relative expression of Il1b, Il6, and Tnf in mouse BMDMs after treatment with HC-Hp or Fu-Hp (100 μg/mL for 6 h) using qRT-PCR (n = 4 per each group). Statistical significance was calculated with an unpaired t-test with Mann-Whitney test and presented as means ± SEM. arb. units, arbitrary unit. c,d The concentrations of IL-1β, IL-6, and TNF in the supernatants of HC-Hp or Fu-Hp-treated cells measured by ELISA (n = 4 per group). Statistical significance was calculated with an unpaired t-test with Mann-Whitney test and presented as means ± SEM. e, The relative expression of Il1b, Il6, Tnf, Il10, and Ccl2 in RAW264.7 cells after treatment with HC-Hp or Fu-Hp (20 μg/mL for 6 h) using qRT-PCR (n = 2 per each group). f,g Western blotting for phosphorylated NF-κB (p-p65), phosphorylated ERK (p-ERK), phosphorylated JNK (p-JNK), phosphorylated Akt (p-Akt), and phosphorylated p38 (p-p38) in human primary monocytes (f) or mouse BMDMs (g). h Western blotting for mature IL-1β, mature caspase1, pro-IL-1β, and pro-caspase1 in human primary monocytes treated for 18 h with Fu-Hp after LPS priming. i The concentrations of IL-1β and TNF in the supernatants of human primary monocytes with Fu-Hp treatment after shNS or shNLRP3 virus knockdown measured by ELISA (n = 4 per group). Statistical significance was calculated with a two-sided unpaired t-test with Mann-Whitney test and presented as means ± SD. j The concentrations of IL-1β in the supernatants of human primary monocytes with Fu-Hp treatment after mitoTEMPO pre-treatment or not measured by ELISA (n = 4 per group). Statistical significance was calculated with a one-way ANOVA with Bonferroni test and presented as means ± SD (k) The concentrations of IL-1β in the supernatants of human primary monocytes with Fu-Hp treatment after potassium chloride (KCl) pre-treatment or not measured by ELISA (n = 4 per group). Statistical significance was calculated with a one-way ANOVA with Bonferroni test and presented as means ± SD.
Fig. 6
Fig. 6. Mincle receptor is increased and interacts with Fu-Hp.
a The Venn diagram illustrating the number of genes with significantly increased expression (p value < 0.05) involved in the innate immune response pathway, across three cohorts (Seoul, GSE232753, and GSE65682) and increased genes in the macrophage population of scRNA-seq data. Two-sided p-values were calculated using the likelihood ratio test and adjusted for multiple comparisons using the Benjamini-Hochberg method to control the false discovery rate (FDR). b, Box-and-whisker plot showing the expression of the CLEC4E gene across three cohorts: Seoul (HCs = 12; SPs = 24), GSE232753 (HCs = 8; SPs = 20), and GSE65682 (HCs = 42; SPs = 479). The lower and upper hinges of the box represent the 25th and 75th percentiles, and the whiskers extend to the minimum and maximum values within 1.5 times the interquartile range. The median value is depicted by the line within the box. Statistical significance was calculated with a two-tailed t-test without adjustment (*p < 0.05; ***p < 0.001). c The violin plot depicting expression levels of CLEC4E gene in macrophage and monocyte population from PBMCs with or without Fu-Hp treatment. P values were calculated by the FindMarkers function in Seurat 5.0.1 package using the default two-sided Wilcoxon Rank Sum test (****p < 0.0001). d The violin plot displaying the expression levels of CLEC4E gene in subpopulations of monocytes (2, 19, and 27) and macrophages (7, 18, and 29). e The relative expression of CLEC4E gene in human primary monocytes after treatment with HC-Hp or Fu-Hp for indicated time point using qRT-PCR (n = 4 per group). Statistical significance was calculated with a two-sided unpaired t-test with Sidak-Bonferroni test and presented as means ± SD. arb. units, arbitrary unit. f, Immunoprecipitation assessing the interaction between HA-tagged Mincle and Hp purified from HCs and SPs (n = 4 per group). g Quantification of β-Hp pulldown by HA-Mincle (n = 4 per group). The graph showing the relative intensity of β-Hp bands normalized to HA-Mincle bands. Statistical significance was calculated with an unpaired t-test with Mann-Whitney test and presented as means ± SEM (*p < 0.05; **p < 0.01). h Schematic illustration of examining the interaction using TIRF microscopy. i, TIRF microscopy images of SNAP-Mincle and ATTO488-Hp. HeLa cells expressing SNAP-Mincle were labeled with a membrane-impermeable SNAP dye (red) and incubated with ATTO488-labeled HC-Hp or Fu-Hp (green). White arrowheads indicate colocalization of Mincle and Hp. Scale bars, 10 μm (right) or 0.1 μm (left). j, The bar plot showing the quantitation of colocalization of β-Hp with Mincle (n = 5). Statistical significance was calculated with a two-tailed unpaired t-test and presented as means ± SD (****p < 0.0001). k,l MST analysis assessing the interaction between HA-tagged Mincle and Hp purified from different cohorts. MST (left) traces and (right) dose response curves were shown. The left panel shows the representative MST trace corresponding to the titration of Hp, and the right panel indicates changes in thermophoresis fitted to yield a KD of 22.9 ± 5.15 μM (k) and a KD 5.7 ± 1.01 μM (l). Data are presented as mean ± standard deviation.
Fig. 7
Fig. 7. Mincle is required for Fu-Hp-induced proinflammatory cytokine expression and NLRP3 inflammasome activation.
a The relative expression of indicated genes after Fu-Hp treatment in nonspecific (shNS) or CLEC4E knockdown (shCLEC4E) monocytes using qRT-PCR (n = 4 per group). Statistical significance was calculated with a one-way ANOVA with Bonferroni test and presented as means ± SD. arb. units, arbitrary unit. b Western blotting for mature IL-1β, mature caspase1, pro-IL-1β, and pro-caspase1 in human primary monocytes treated for 18 h with Fu-Hp. NM, Human Mincle neutralizing antibody; IgG, Mouse Control IgG2b. c, The concentrations of IL-1β in the supernatants of human primary monocytes with Fu-Hp treatment after indicated antibodies (NM or IgG) pretreatment measured by ELISA (n = 4 per group). Statistical significance was calculated with a two-sided unpaired t-test with Mann-Whitney test and presented as means ± SD. d, The relative expression of indicated genes after Fu-Hp treatment in mouse BMDM from Clec4eWT or Clec4eKO using qRT-PCR (n = 4 per group). Statistical significance was calculated with a two-sided unpaired t-test with Mann-Whitney test and presented as means ± SD. arb. units, arbitrary unit. ns, not significant. e Western blotting for mature IL-1β, mature caspase1, pro- IL-1β, IL-6, and pro-caspase1 in mouse BMDM from Clec4eWT or Clec4eKO treated for 18 h with Fu-Hp. f The concentrations of IL-1β, IL-6, and TNF in the supernatants of Fu-Hp-treated Clec4eWT or Clec4eKO BMDM (100 μg/mL for 18 h) measured by ELISA (n = 4 per group). ns, not significant. Statistical significance was calculated with a two-sided unpaired t-test with Mann-Whitney test and presented as means ± SEM. g Firefly luciferase reporter vector (NFAT-RE) were stimulated with HC-Hp or Fu-Hp, and reporter assay was performed in HeLa cells transfected with a HA-Mincle expression vector (left; n = 4 per group). HA-Mincle transfection was confirmed by WB using an HA antibody (right). Statistical significance was calculated with a two-sided Kruskal-Wallis test and presented as means ± SD. RLU/s, Relative Light Units per second.
Fig. 8
Fig. 8. Fu-Hp-associated of gene signatures are associated with prognosis of SP.
a Bar plot of the proportion of cell types in scRNA-seq data of HCs and SPs, separated by two HC samples and two SP samples. HC, Healthy control; S-SP, Surviving patients; NS-SP, Non-surviving patients. b The UMAP plot illustrating the alterations in cell proportions between SP and HC. c, Bar plot of the proportion of indicated cell types shown in a and b, separated by groups. HC, Healthy control; SP, Sepsis patients; MLC-NS, Macrophage-like cell population from non-surviving patient; MLC-S, Macrophage-like cell population from surviving patient. d The violin plot depicting expression levels of indicated genes in MLC-S and MLC-NS (log2(fold change) > 0.5). P values were calculated by the FindMarkers function in Seurat 5.0.1 package using the default two-sided Wilcoxon Rank Sum test (****p < 0.0001). ns, not significant; MLC-NS, Macrophage-like cell population from non-surviving patient; MLC-S, Macrophage-like cell population from surviving patient. e Unsupervised UMAP analysis on PBMCs pooled from 2 HC and 10 SP (6 surviving patients and 4 deceased patients) in public sepsis cohort (GSE167363). Cell populations were mapped onto the UMAP landscape to visualize the distribution of cells across clusters. f Bar plot of the proportion of indicated cell types shown in e, separated by samples. HC, Healthy control; S, Surviving patients; NS, Non-surviving patients. g Bar plot depicting of the cell count of cluster 3 shown in f, separated by patient groups. S-SP, Surviving sepsis patients; NS-SP, Non-surviving sepsis patients (n = 6 for S; n = 4 for NS). Statistical significance was calculated with a two-tailed unpaired t-test with Mann-Whitney test and presented as means ± SD (*p < 0.05). h Volcano plot depicting DEGs between cluster 3 and other clusters in GSE167363. Gene signatures were labeled (adjusted p values < 0.04-301). P values were calculated by the FindMarkers function in Seurat 5.0.1 package using the default two-tailed Wilcoxon Rank Sum test. i,j Box-and-whisker plot illustrating the expression of the indicated genes in Seoul cohort (n = 12 for HC; n = 19 for S; n = 5 for NS). The lower and upper hinges of the box represent the 25th and 75th percentiles, and the whiskers extend to the minimum and maximum values within 1.5 times the interquartile range. The median value is depicted by the line within the box. Statistical significance was calculated with a two-tailed t-test without adjustment (**p < 0.01; ***p < 0.001; ****p < 0.0001). ns, not significant; HC, Healthy control; S, Surviving patients; NS, Non-surviving patients. k Correlation between the expression of the AAL level (x-axis) and the expression of either the relative expression of indicated genes (IL1B and IL6) (y-axis) with the best linear fit plotted in our cohort (n = 23 for HC; n = 24 for S; n = 12 for NS). Pearson’s correlation coefficient and the p value are displayed in the bottom-right corner. The shaded area represents the 95 % confidence interval. P values were calculated using a t-distribution with [n-2] degrees of freedom. HC, Healthy control; S, Surviving patients; NS, Non-surviving patients. l Correlation between the expression of the AAL level (x-axis) and the level of lactate-1 (y-axis) with the best linear fit plotted in our cohort (n = 84 for S; n = 33 for NS). Pearson’s correlation coefficient and the p value are displayed in the top-right corner. The shaded area represents the 95 % confidence interval. P values were calculated using a t-distribution with [n-2] degrees of freedom. S, Surviving patients; NS, Non-surviving patients.
Fig. 9
Fig. 9. Administration of Fu-Hp in mice leads to the upregulation of pro-inflammatory cytokine expression in vivo.
a The concentrations of IL-1β, IL-6, and TNF were measured by ELISA in plasma of female 8-week-old C57BL/6 mice following Fu-Hp administration (n = 6 per group). Statistical significance was calculated with a Kruskal-Wallis test with Dunn’s test and presented as means ± SEM. ns, not significant. b The concentrations of IL-1β, IL-6, and TNF were measured by ELISA in indicated organ of female 8-week-old C57BL/6 mice following Fu-Hp administration (n = 6 per group). Statistical significance was calculated with a two-sided unpaired t-test with Mann-Whitney test and presented as means ± SEM. ns, not significant. c The relative expression of indicated genes in indicated organ of female 8-week-old C57BL/6 mice following Fu-Hp administration (n = 6 per group). Statistical significance was calculated with a two-way ANOVA with Bonferroni’s test and presented as means ± SEM.

References

    1. Kristiansen, M. et al. Identification of the haemoglobin scavenger receptor. Nature409, 198–201 (2001). - PubMed
    1. Tamara, S., Franc, V. & Heck, A. J. R. A wealth of genotype-specific proteoforms fine-tunes hemoglobin scavenging by haptoglobin. Proc. Natl Acad. Sci. USA117, 15554–15564 (2020). - PMC - PubMed
    1. Van Vlierberghe, H., Langlois, M. & Delanghe, J. Haptoglobin polymorphisms and iron homeostasis in health and in disease. Clin. Chim. Acta345, 35–42 (2004). - PubMed
    1. Reinhart, K. et al. Recognizing Sepsis as a Global Health Priority - A WHO Resolution. N. Engl. J. Med377, 414–417 (2017). - PubMed
    1. Harris, E. CDC Introduces Hospital Sepsis Program Guidelines. JAMA330, 1128 (2023). - PubMed

Publication types

MeSH terms

Associated data