. 2025 Feb 5;10(1):40.
doi: 10.1038/s41392-025-02136-8.

Single-cell transcriptomics reveals novel chondrocyte and osteoblast subtypes and their role in knee osteoarthritis pathogenesis

Affiliations

Single-cell transcriptomics reveals novel chondrocyte and osteoblast subtypes and their role in knee osteoarthritis pathogenesis

Yuan Liu et al. Signal Transduct Target Ther. .

Abstract

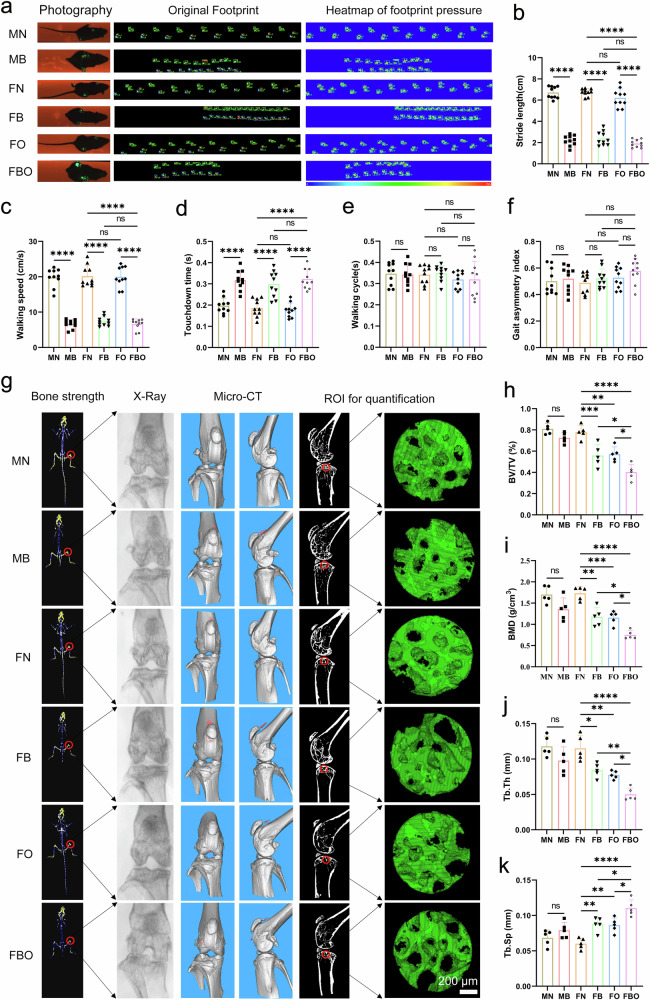
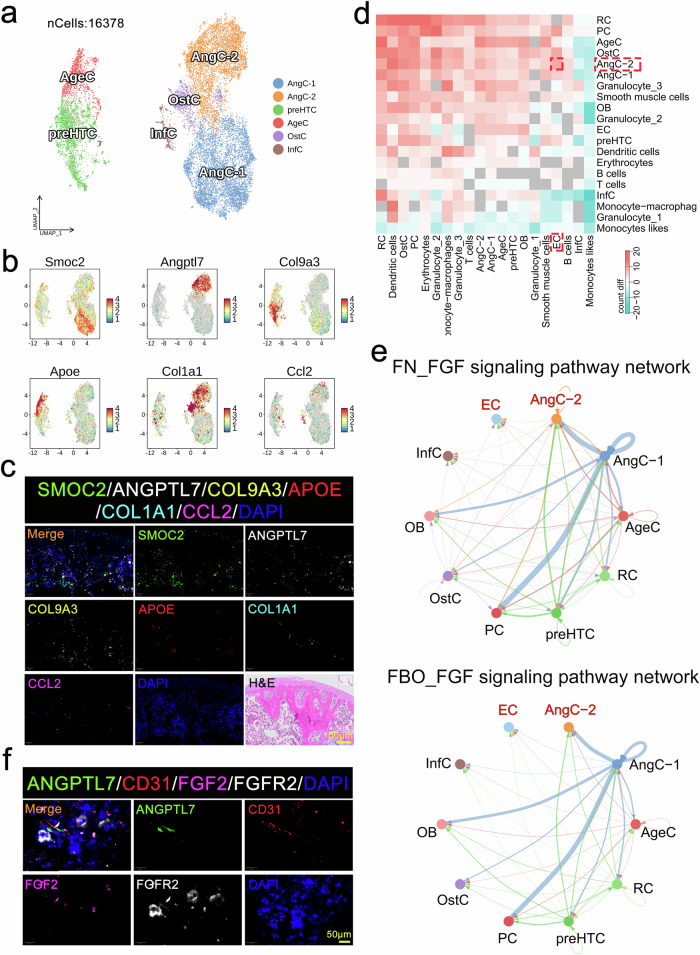
Research on treating knee osteoarthritis (KOA) is becoming more challenging due to a growing number of younger patients being affected. The pathogenesis of KOA is complex for being a multifactorial disease affecting the entire joint, with remodeling of subchondral bone playing a key role in the degeneration of the overlying cartilage. Therefore, this study constructed a bipedal postmenopausal KOA mouse model to better understand how the interplay between subchondral bone remodeling and cartilage degeneration contributes to KOA development. A single-cell atlas of the osteochondral composite tissue was established. Furthermore, three novel subtypes of chondrocytes, including Smoc2+ angiogenic chondrocytes, Angptl7+ angiogenic chondrocytes, and Col1a1+ osteogenic chondrocytes, were identified in femoral condyles of KOA mice. In addition, the Angptl7+ chondrocytes promoted angiogenesis in the subchondral bone of KOA mice by interacting with endothelial cells via the FGF2-FGFR2 signaling pathway. The number of H-type vessels was increased in the subchondral bone, recruiting osteoprogenitor cells and facilitating osteogenesis in KOA mice. Sparc+ osteoblasts have negatively regulated bone mineralization and osteoblastic differentiation, aggravated the pathological remodeling of subchondral bone, and promoted the progression of KOA. The above findings have offered new targets and opened up an avenue for the therapeutic intervention of KOA.


Conflict of interest statement

Competing interests: The authors declare no competing interests.

Figures

Fig. 1
Fig. 1
Pathological remodeling of subchondral bone in patients with KOA. a Tissue samples were isolated from tibial plateaus with KOA. b, c Representative sagittal micrographs of H&E (b) and SO&FG (c) staining for the samples of tibial plateaus with KOA, injured cartilage and subchondral bone lesions were marked. Scale bars = 1 mm, 200 μm. d Micro-CT measurement and heatmap of Tb.Th for the samples of tibial plateaus with the KOA. The color scale changes from green to red. The darker the color, the greater the Tb.Th. e Quantitative analysis of BV/TV, BMD, Tb.N, Tb.Th, Tb.Sp and SMI (n = 5 per group). The BMD of trabeculae on the medial tibial plateau is significantly lower than that on the lateral side. And the parameters measured in the lateral side appeared to be more concentrated compared with the medial side. f Representative sagittal micrographs of pathological alterations of tibial plateaus at early and late stage of KOA. Articular cartilage (AC), tidemark (TM), and subchondral bone (SB) are marked. Scale bars = 2 mm, 500 μm, 100 μm. g Representative micrographs of vascular invasion from the subchondral bone into articular cartilage. Scale bars = 250 μm, 100 μm. Black arrow indicates the vascular invasion into cartilage. h Quantitative analysis of invaded vessels crossing tidemarks in the medial and lateral tibial plateaus (n = 8 per group). i Representative micrographs of vascular rich granulation tissue infiltrated the subchondral bone with KOA. Scale bars = 250 μm, 100 μm. Scale bars = 100 μm, 50 μm. Blue arrow suggests the granulation tissue deposited in subchondral bone. j Quantitative analysis of the number of infiltrated granulation tissue in the medial and lateral subchondral bone (n = 8 per group). k Representative micrographs of cartilage-like tissue, positively stained with safranin O, deposited in the subchondral bone with KOA. Scale bars = 250 μm, 100 μm. Blue arrow suggests the cartilage-like tissue deposited in subchondral bone. l Quantitative analysis of the number of deposited cartilage-like tissue in the medial and lateral subchondral bone (n = 8 per group). m Representative micrographs of type H vessels (CD31hiEMCNhi) immune-positively stained with CD31 and EMCN in subchondral bone with KOA. White arrow indicates the type H vessels grown in subchondral bone with KOA. The white dashed line marked the boundary of the subchondral bone in the normal tibial plateau, while that was disrupted and unclear in the KOA group. n Quantitative analysis of the density of vessels in the normal and osteoarthritic tibial plateaus (n = 8 per group). Data are shown as mean ± SD. P-values were determined by paired, two-tailed t-test for (e, h, j, l) and unpaired, two-tailed t-test for (n)
Fig. 2
Fig. 2
Postmenopausal KOA model was successfully constructed in bipedal mice. a A schematic of mice experimental design. This study has included six groups of mice: MN (male normal mice), MB (male bipedal mice), FN (female normal mice), FB (female bipedal mice), FO (female mice with bilateral ovariectomy), and FBO (female bipedal mice with bilateral ovariectomy). The forelimbs and tail of 3-week-old C57 mice were cut off in a sterile environment, and exercise for the bipedal activities was performed on a treadmill with a slow speed. Half of female mice were bilaterally ovariectomized at 10 weeks of age. The phenotype of KOA was evaluated monthly from 10 to 22 weeks of age. b Representative micrographs of H&E and SO&FG staining in sagittal sections of the medial sides of knee joints of experimental mice at 10, 14, 18, and 22 weeks of age. Articular cartilage (AC), calcified cartilage (CC), subchondral bone (SB) and meniscus (ME) are marked. Scale bar = 200 μm. c Measurement and quantitative analysis of femoral cartilage thickness (n = 5 per group). d The Osteoarthritis Research Society International score for different animal models (n = 5 per group). e, f Representative micrographs of immunohistochemical staining of Collagen II (e) and Aggrecan (f) in sagittal sections of the medial sides of the knee joints in the six groups at 22 weeks of age, Scale bar = 200 μm. g, h Semi-quantitative analysis of immune-positive percentage of Collagen II (g) and Aggrecan (h) (n = 5 per group). i Representative TEM images of the chondrocytes in cartilage tissues of knees at 22 weeks of age, Scale bars = 2 μm, 500 nm. Red, orange, cyan and blue arrows indicated the mitochondrial, rough endoplasmic reticulum, perinuclear space, and cell protrusions, respectively. Data are shown as mean ± SD. P-values were determined by one-way ANOVA with a Tukey post hoc test for (c, d, g, h)
Fig. 3
Fig. 3
Gait analysis and micro-CT measurement of KOA mice. a Results of gait analysis of mice at 22 weeks of age, including the original footprint and heatmap of footprint pressure. b Quantitative analysis of stride length (n = 5 per group). c Quantitative analysis of walking speed (n = 5 per group). d Quantitative analysis of touchdown time (n = 5 per group). e Quantitative analysis of walking cycle (n = 5 per group). f Quantitative analysis of gait asymmetry index (n = 5 per group). g Representative images of bone strength heatmap and micro-CT images for the 3-dimensional (3D) reconstruction of knee joints at 22 weeks of age. Scale bar = 200 μm. h Quantitative analysis of BV/TV (n = 5 per group). i Quantitative analysis of BMD (n = 5 per group). j Quantitative analysis of Tb.Th (n = 5 per group). k Quantitative analysis of Tb.Sp (n = 5 per group). Data are shown as mean ± SD. P-values were determined by one-way ANOVA with a Tukey post hoc test for (bf and hk)
Fig. 4
Fig. 4
Pathological remodeling of the subchondral bone in the KOA mice. a The BMD and body composition (bone mineral content, fat mass, and lean mass) of the mice were measured by Inalyzer (left), and the corresponding X-ray photograph of mice (right). Red box indicated the selected region of interest of knee joints for analysis. Scale bar = 20 mm. b Changing trend and quantitative analysis of weights of mice in six groups from 14 to 22 weeks of age (n = 5 per group). c Representative images of body composition heatmap and microstructure of trabecular bone of mice in six groups at 22 weeks of age. The bone is white, fat is red, blue & green are mixed lean and liquid. Scale bar = 500 μm. d, e Quantitative analysis of percentage of fat (d) and BMD (e) of mice in six groups at 22 weeks of age (n = 5 per group). f Quantitative analysis of the BMD of the knee joints of mice in six groups at 22 weeks of age (n = 5 per group). g, h Representative sagittal micrographs of TRAP staining (g) and related semi-quantitative analysis (h) in subchondral bone of femoral condyles (FC) and tibial plateaus (TP) of mice in the six groups at 22 weeks of age (n = 5 per group). Scale bar = 50 μm. Black arrows indicated the TRAP+ osteoclasts. i, j Representative sagittal micrographs of IHC staining of osteocalcin (i) and related semi-quantitative analysis (j) in subchondral bone of mice in the six groups at 22 weeks of age (n = 5 per group). Scale bar = 50 μm. Black arrows indicated the TRAP+ osteoclasts or osteocalcin+ osteoblasts. k Representative TEM images of osteoblasts in subchondral bone of femoral condyles of mice in the six groups at 22 weeks of age. Scale bars = 2 μm, 500 nm. Red, orange and blue arrows indicated the mitochondrial, rough endoplasmic reticulum, and cell protrusions, respectively. l Representative sagittal micrographs of SO&FG staining of femoral condyle (FC) of mice in the six groups at 22 weeks of age, indicating the cartilage degeneration and pathological remodeling of subchondral bones. Articular cartilage (AC), subchondral bone (SB) and bone marrow cavity (BM) were marked. Scale bar = 50 μm. Black arrow indicated the cartilage-like tissue deposited in the subchondral bone. Data are shown as mean ± SD. P-values were determined by one-way ANOVA with a Tukey post hoc test for (b, d, e, f, h, and j)
Fig. 5
Fig. 5
The single-cell landscape of femoral condyles in six groups at 22 weeks of age. a Schematic workflow for transcriptomic profiling of the mice femoral condyles with KOA using scRNA-seq. The scRNA-seq data (one sample per group, six groups) were assayed by following the SeekOne protocol, including 5 pairs of knees in each sample. The CD45+ cells were selected by flow cytometric sorting, and the CD45+ and CD45 cells were mixed in a ratio of 1:1 before the examination. b Process of isolation for femoral condyle from femur for scRNA-seq, and representative images of isolated femoral condyles stained with H&E and SO-FG, Scale bar = 200 μm. c UMAP plot of single cells profiled in the presenting work colored by cell types. A total of 65,491 cells were isolated from six groups of femoral condyles and divided into 15 cell types. d Feature plots showing the expression of key markers in various clusters projected on the UMAP plot. Red indicates high expression and blue indicates low or no expression. e Heatmap revealing the scaled expression of the top 3 discriminative genes in each cell cluster defined in (c), the color scheme is based on z-scores
Fig. 6
Fig. 6
Enhanced mechanical stress accelerated cartilage degeneration. a, b The box plot represents the scores of chondrocytes (a) and osteoblasts (b) in each group for “response to mechanical stimulus” pathway in the GO database, scores come from the R package “AUcell”. c, d The box plot represents the Piezo1 gene expression of chondrocytes (c), and representative images of immunohistochemistry staining of indicated Piezo1 gene in cartilage tissue (d) in each group, Scale bar = 20 μm. e, f The box plot represents the Piezo1 gene expression of osteoblasts (e), and representative images of immunohistochemistry staining of indicated Piezo1 gene in subchondral bone (f) in each group, Scale bar = 20 μm. g Schematic representation of the workflow followed for Finite Element Analysis (FEA) of the models reconstructed from DICOM data of knees measured by micro-CT. h, i Heatmap of stress distribution (MPa) on cartilage surface and subchondral bone of knee joints in six groups at 18 (h) and 22 (i) weeks of age. The stress distribution is mainly concentrated on the medial side of the knee joints, and the stress intensity in bipedal mice was significantly higher than that in normal and FO mice. j Representative images of chondrocytes in bright field or staining with phalloidin (red) to present the cytoskeleton changes of chondrocytes before and after stretching for 24 h, Scale bars = 100 μm, 50 μm. k Expression level of genes related to mechanical stress and cartilage degeneration, including PIEZO1, ADAMTS5, MMP13, COL2A1, ACAN and SOX9, of chondrocytes before and after stretching for 24 h. Data are shown as mean ± SD, n = 3 per group. P-values were determined by unpaired, two-tailed t-test
Fig. 7
Fig. 7
Chondrocyte damage, vessel invasion and subchondral bone remodeling was aggravated in the KOA mice. ac The circle enrichment plot shows the GO database results of group FBO compared with group FN in chondrocytes (a), endothelial cells (b) and osteoblasts (c). The deeper the color or the bigger the size is, the −log10(p-value) is greater, indicating a more significant difference. Red (YlOrRd) circle plot indicated the up-regulation function of group FBO relative to group FN (left), and the blue (PuBu) circle plot indicated the down-regulation function (right). df Dot plots indicated differentially expressed genes of chondrocytes (d), endothelial cells (e) and osteoblasts (f) between the FBO and FN groups. Presented genes are derived from the results of interest in the enrichment analysis and mostly refer to degeneration of chondrocytes, angiogenesis and remodeling of subchondral bone. g The box plot represents the Rpl11 gene expression of chondrocytes related to the “senescence” pathway in (d). h The box plot represents the Thbs1 gene expression of chondrocytes related to the “ECM regulation” pathway in (d). i The box plot represents the Ccn1 gene expression of chondrocytes related to the “angiogenesis” pathway in (d). j The box plot represents the Col1a1 gene expression of osteoblasts related to the “osteoblast development” pathway in (f). k The box plot represents the Timp2 gene expression of osteoblasts related to the “ECM regulation” pathway in (f). All referred genes were confirmed in vivo by IHC staining, Scale bar = 20 μm. l Representative images of multi-immunofluorescence staining for type H vessels (CD31hiEMCNhi) grown in femoral condyles (FC) and tibial plateaus (TP) of FN and FBO mice. Articular cartilage (AC), subchondral bone (SB), growth plate (GP), and metaphysis (MP) were marked. Osterix+ progenitor cells (white) distributed a lot in the growth plate of FN mice, while it significantly decreased in FBO mice. And vessels highly expressed CD31 (red) and EMCN (green), even osterix+ progenitor cells (white) appeal around it, grown more in the subchondral bone of FBO mice than FN. Scale bar = 200 μm. m Quantitative analysis of the density of vessels in the subchondral bone of knees from the FN and FBO mice. Data are shown as mean ± SD, n = 5 per group. P-values were determined by unpaired, two-tailed t-test. n Representative images of multi-immunofluorescence and H&E staining for CD31hiEMCNhi vessels (white arrow indicated) invaded into articular cartilage of FBO mice. Scale bar = 40 μm. o Representative images of multi-immunofluorescence staining for type H vessels grown in SB of FBO mice. Scale bar = 40 μm. And representative TEM images of osteoblast grown around the vessel. Scale bars = 2 μm, 500 nm
Fig. 8
Fig. 8
Angptl7+ chondrocytes promoted angiogenesis through the FGF2-FGFR2 signaling pathway in the KOA mice. a Six sub cell types of 16,378 chondrocytes were visualized by a UMAP plot, including angiogenic chondrocytes-1 (AngC-1, 6263), angiogenic chondrocytes-2 (AngC-2, 4800), prehypertrophic chondrocytes (preHTC, 2651), aging chondrocytes (AgeC, 1362), osteogenic chondrocytes (OstC, 939), inflammatory chondrocytes (InfC, 363). b Expression patterns of selected markers projected on the UMAP plot. Red color indicated high expression and blue color indicated low or no expression, one marker for each sub cell type of chondrocytes was shown. c Representative images of immunofluorescence and H&E staining for marking the location and expression of six subtypes of chondrocytes in a FBO sample. Scale bar = 50 μm. d The heatmap shows the number of interactions in FBO group and FN group among each cell sub cell types. Red indicates a higher number of interactions in group FBO; blue indicates a higher number of interactions in group FN. e Circle plot showing the inferred FGF signaling networks in FN and FBO datasets. Edge line thickness indicated the interaction strength of FGF signaling between different cell types. The interaction between AngC-2 and EC was significantly improved through FGF signaling pathway in FBO sample. f Representative images of multi-immunofluorescence staining for the interaction between AngC-2 and EC through the FGF2-FGFR2 signaling pathway in the FBO sample. Scale bar = 50 μm
Fig. 9
Fig. 9
Sparc+ OBs negatively regulated bone mineralization and osteoblastic differentiation in KOA mice. ac Developmental pseudotime for cells present along the trajectory inferred by Monocle 2. The trajectory plot shows the pseudotime, cell state, and cell subtypes of each cell, and choose PC cells as the start of time. d Increased Sparc, Ecm1, Mgp, and Srgn gene expression levels of all cells along cell trajectory in FBO sample compared with FN sample, which was highly related with the limited mineralization of trabecular bone. e Decreased Runx2, Ibsp, Alpl, and Bmp2 gene expression levels of OB and OstC along cell trajectory in FBO sample compared with FN sample, which was highly related with the osteoblast development. All referred genes were confirmed in vivo by IHC staining, Scale bar = 20 μm. f Heatmap shows the differential expressed genes of state5 osteoblasts (OB5) and state2 osteoblasts (OB2) in FBO group. g The circle enrichment plot shows the GO database results of group FBO compared with group FN in OB5. The deeper the color is, or the bigger the size is, the −log10(p-value) is greater, indicating a more significant difference. Red (YlOrRd) circle plot indicates the up-regulation function of group FBO relative to group FN, and the blue (PuBu) circle plot indicates the down-regulation function

References

    1. Weng, Q. et al. Global burden of early-onset osteoarthritis, 1990–2019: results from the Global Burden of Disease Study 2019. Ann. Rheum. Dis.83, 915–925 (2024). - PubMed
    1. Leifer, V. P., Katz, J. N. & Losina, E. The burden of OA-health services and economics. Osteoarthr. Cartil.30, 10–16 (2022). - PMC - PubMed
    1. Constantino de Campos, G. et al. Osteoarthritis, mobility-related comorbidities and mortality: an overview of meta-analyses. Ther. Adv. Musculoskelet. Dis.12, 1759720X20981219 (2020). - PMC - PubMed
    1. Roelofs, A. J. & De Bari, C. Osteoarthritis year in review 2023: biology. Osteoarthr. Cartil.32, 148–158 (2024). - PubMed
    1. Hu, W., Chen, Y., Dou, C. & Dong, S. Microenvironment in subchondral bone: predominant regulator for the treatment of osteoarthritis. Ann. Rheum. Dis.80, 413–422 (2021). - PMC - PubMed

LinkOut - more resources