. 2025 Feb 5;11(1):46.
doi: 10.1038/s41420-025-02337-8.

High-altitude hypoxia aggravated neurological deficits in mice induced by traumatic brain injury via BACH1 mediating astrocytic ferroptosis

Affiliations

High-altitude hypoxia aggravated neurological deficits in mice induced by traumatic brain injury via BACH1 mediating astrocytic ferroptosis

Peng Zou et al. Cell Death Discov. .

Abstract

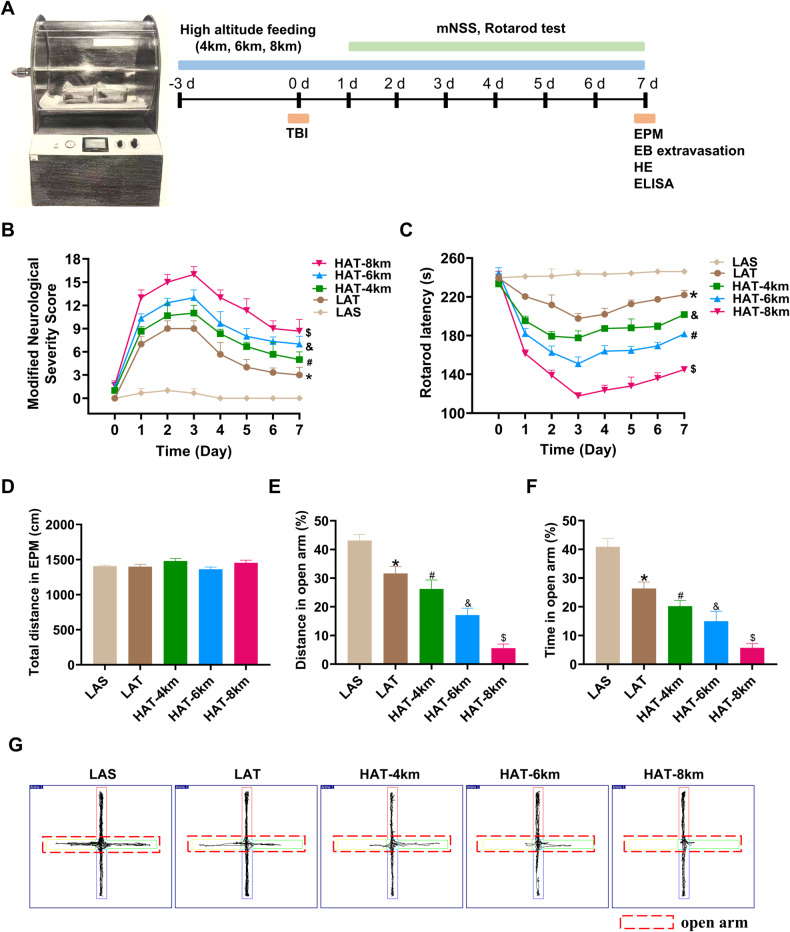
Traumatic brain injury (TBI) is one of the leading causes of disability and mortality, which was classified as low-altitude TBI and high-altitude TBI. A large amount of literature shows that high-altitude TBI is associated with more severe neurological impairments and higher mortality rates compared to low-altitude TBI, due to the special environment of high-altitude hypoxia. However, the role of high-altitude hypoxia in the pathogenesis of TBI remains unclear. In order to deeply investigate this scientific issue, we constructed a high-altitude hypoxic TBI model at different altitudes and used animal behavioral assessments (Modified neurological severity score, rotarod test, elevated plus maze test) as well as histopathological analyses (brain gross specimens, brain water content, Evans blue content, hypoxia inducible factor-1α, Hematoxylin-Eosin staining and ROS detection) to reveal its underlying principles and characteristics. We found that with higher altitude, TBI-induced neurological deficits were more severe and the associated histopathological changes were more significant. Single-nuclear RNA sequencing was subsequently employed to further reveal differential gene expression profiles in high-altitude TBI. We found a significant increase in ferroptosis of astrocytes in cases of high-altitude TBI compared to those at low-altitude TBI. Analyzing transcription factors in depth, we found that Bach1 plays a crucial role in regulating key molecules that induce ferroptosis in astrocytes following high-altitude TBI. Down-regulation of Bach1 can effectively alleviate high-altitude TBI-induced neurological deficits and histopathological changes in mice. In conclusion, high-altitude hypoxia may significantly enhance the ferroptosis of astrocytes and aggravate TBI by up-regulating Bach1 expression. Our study provides a theoretical foundation for further understanding of the mechanism of high-altitude hypoxic TBI and targeted intervention therapy.


Conflict of interest statement

Competing interests: The authors declare no competing interests. Ethics approval and consent to participate: All animal procedures were reviewed and approved by the Institutional Animal Care and Use Committee of the Air Force Medical University (approval No. 20210419) on April 19, 2021, and conducted following the instructions of Declaration of Helsinki of the World Medical Association. Informed consent was obtained from all participants.

Figures

Fig. 1
Fig. 1. High-altitude hypoxia exacerbated neurological damage in mice induced by TBI.
A The experimental protocol for establishment and evaluation of high-altitude hypoxic TBI model. B Effects of different altitudes on modified Neurological Severity Score (mNSS) in mice induced by TBI (two-way ANOVA, F = 478.9, LAT vs LAS: *P < 0.0001; HAT-4 km vs LAT: #P < 0.0001; HAT-6 km vs HAT-4 km: &P < 0.0001; HAT-8 km vs HAT-6 km: $P < 0.0001) (n = 6). C Effects of different altitudes on rotarod latency in mice induced by TBI (two-way ANOVA, F = 1216, LAT vs LAS: *P < 0.0001; HAT-4 km vs LAT: #P < 0.0001; HAT-6 km vs HAT-4 km: &P < 0.0001; HAT-8 km vs HAT-6 km: $P < 0.0001) (n = 6). DF Effects of different altitudes on elevated plus-maze (EPM) test in mice induced by TBI. total distance in EPM test (D), the percentage of total distance spent in the open arms (E) (one-way ANOVA, F = 291.2, LAT vs LAS: *P < 0.0001; HAT-4 km vs LAT: #P = 0.0006; HAT-6 km vs HAT-4 km: &P < 0.0001; HAT-8 km vs HAT-6 km: $P < 0.0001) (n = 6), and the percentage of total time spent in the open arms (F) (one-way ANOVA, F = 218.1, LAT vs LAS: *P < 0.0001; HAT-4 km vs LAT: #P = 0.0002; HAT-6 km vs HAT-4 km: &P = 0.0017; HAT-8 km vs HAT-6 km: $P < 0.0001) (n = 6). G Typical trajectory plots of EPM test. Data were shown as mean ± SD.
Fig. 2
Fig. 2. High-altitude hypoxia exacerbated histopathological injury in mice induced by TBI.
A The brain gross specimens following different-altitude TBI. B Evans blue (EB) extravasation test. The brain gross specimens through tail vein injection of Evans blue. C The brain water content of different-altitude TBI (one-way ANOVA, F = 257.5, LAT vs LAS: *P < 0.0001; HAT-4 km vs LAT: #P < 0.0001; HAT-6 km vs HAT-4 km: &P < 0.0001; HAT-8 km vs HAT-6 km: $P < 0.0001) (n = 6). D The EB content of different-altitude TBI (one-way ANOVA, F = 408.2, LAT vs LAS: *P < 0.0001; HAT-4 km vs LAT: #P < 0.0001; HAT-6 km vs HAT-4 km: &P < 0.0001; HAT-8 km vs HAT-6 km: $P < 0.0001) (n = 6). E The content of HIF-1α of different-altitude TBI (one-way ANOVA, F = 541.6, LAT vs LAS: *P < 0.0001; HAT-4 km vs LAT: #P < 0.0001; HAT-6 km vs HAT-4 km: &P < 0.0001; HAT-8 km vs HAT-6 km: $P < 0.0001) (n = 6). F HE staining of the right side of hippocampus and cortex in different groups, scale = 50 μm. Data were shown as mean ± SD.
Fig. 3
Fig. 3. SnRNA-seq analysis revealed alterations of neuron in cortex after high-altitude TBI.
A, B UMAP plot of 17,002 high-quality cells to show 10 main cell-types based on the expression of known marker genes, colored by cell type and cell origin respectively. C Expression of representative marker genes for each cell type. Gene expression violin plots are shown in log-scale Unique Molecular Identifiers (UMI). D The ratio of each cell type in LA-TBI and HA-TBI groups. E UMAP plot of neurons to show excitatory-neurons and inhibitory-neurons. F The ratio of two types neurons in LA-TBI and HA-TBI groups. G Expression of representative marker genes for excitatory-neurons and inhibitory-neurons. H The heatmap of DEGs in excitatory-neurons between two groups. I The KEGG pathways of up-regulated DEGs in excitatory-neurons. J, K The top 10 GO enrichments in BP, CC, MF in up-regulated (J) and down-regulated (K) DEGs. Each node signaled a GO term, and its size represented the gene number.
Fig. 4
Fig. 4. SnRNA-seq analysis revealed that Bach1 might be a key molecule participating ferroptosis in astrocytes after high-altitude TBI.
A UMAP showing the clustering of astrocytes subsets based on the expression of marker genes. B UMAP showing the astrocytes from LA-TBI and HA-TBI groups. Each dot corresponds to one single cell colored according to cell cluster. C Demonstration of the ratio of the 3 astrocytes subpopulations in LA-TBI and HA-TBI groups. D Representative molecular signatures for astrocytes subsets. E Heatmap plots showing representative differentially expressed genes between the LA-TBI and HA-TBI groups. Per group n = 3. F The top 10 GO enrichments in BP, CC, MF. Each node signaled a GO term, and its size represented the gene number. The color indicates the P-value. G KEGG enrichment analysis on astrocytic population, showing upregulated pathways. H GSEA showing ferroptosis pathway enriched in astrocytes induced by HA-TBI and LA-TBI. NES, normalized enrichment score. I Violin plots for selected genes: Fth1, Acsl3, Slc3a. J SCENIC analyses in the LA-TBI and HA-TBI groups (***P < 0.001, ****P < 0.0001 between LA-TBI and HA-TBI. K Volcano plot of upregulated and downregulated genes in the LA-TBI and HA-TBI groups. Data were shown as mean ± SD.
Fig. 5
Fig. 5. Alteration of Bach1 expression and ferroptosis in astrocytes after high-altitude TBI.
AC Western blotting detection of the protein level of Bach1 (one-way ANOVA, F = 17.16, LAT vs LAS: *P = 0.0407; HAT vs HAS: #P = 0.0041; HAT vs LAT: &P = 0.0309), Fth1 (one-way ANOVA, F = 24.24, LAT vs LAS: *P = 0.0310; HAT vs HAS: #P = 0.0004; HAT vs LAT: &P = 0.0207) in the LAS, LAT, HAS and HAT groups (per group n = 3). DF Representative images in astrocytes of different groups demonstrated Bach1 (one-way ANOVA, F = 124.3, LAT vs LAS: *P < 0.0001; HAT vs HAS: #P < 0.0001; HAT vs LAT: &P < 0.0001) was significantly increased and the ferroptosis marker Fth1 (one-way ANOVA, F = 159.7, LAT vs LAS: *P < 0.0001; HAT vs HAS: #P < 0.0001; HAT vs LAT: &P < 0.0001) was significantly decreased in high-altitude TBI (per group n = 3). G Tissue ROS intensity (one-way ANOVA, F = 15.62, LAT vs LAS: *P < 0.0260; HAT vs HAS: #P < 0.0036; HAT vs LAT: &P < 0.0253) in the LAS, LAT, HAS and HAT groups (per group n = 4). Scale bar: 20 μm. Data were shown as mean ± SD.
Fig. 6
Fig. 6. Knockdown of Bach1 could inhibit ferroptosis of astrocytes and improve neurological deficits induced by high-altitude TBI in mice.
A Experimental design. B, C Western blot was used to verify knockdown efficiency (n = 3) (unpaired t-test, t = 8.725, P = 0.0010). D Bach1 konckdown could alleviate the neurological deficit caused by high-altitude TBI (n = 6) (two-way ANOVA, F = 539.4, HAT vs HAS: *P < 0.0001; HAT-sh-ctrl vs the HAT: nsP = 0.6116; HAT-sh-Bach1 vs HAT-sh-ctrl: #P < 0.0001). E Bach1 knockdown could alleviate motor dysfunction caused by high-altitude TBI (n = 6) (two-way ANOVA, F = 782.6, HAT vs HAS: *P < 0.0001; HAT-sh-ctrl vs the HAT: nsP = 0.3790; HAT-sh-Bach1 vs HAT-sh-ctrl: #P < 0.0001). FH Bach1 knockdown could alleviate anxiety-like behavior caused by high-altitude TBI. total distance in EPM test (F), the percentage of total distance spent in the open arms (G) (one-way ANOVA, F = 101.2, HAT vs HAS: *P < 0.0001; HAT vs HAT-sh-ctrl: P = 0.6182; HAT-sh-ctrl vs HAT-sh-Bach1: #P < 0.0001), and the percentage of total time spent in the open arms (H) (one-way ANOVA, F = 68.17, HAT vs HAS: *P < 0.0001; HAT vs HAT-sh-ctrl: P = 0.9143; HAT-sh-ctrl vs HAT-sh-Bach1: #P < 0.0001). I Typical trajectory plots of EPM test. JL Western blotting detection of the protein level of Bach1 (one-way ANOVA, F = 17.62, HAT vs HAS: *P = 0.0064; HAT vs HAT-sh-ctrl: P = 0.6134; HAT-sh-ctrl vs HAT-sh-Bach1: #P = 0.0031), Fth1 (one-way ANOVA, F = 58.84, HAT vs HAS: *P < 0.0001; HAT vs HAT-sh-ctrl: P = 0.9719; HAT-sh-ctrl vs HAT-sh-Bach1: #P < 0.0001) in the HAS, HAT, HAT+sh-ctrl and HAT+sh-Bach1 groups (per group n = 3). M Tissue ROS intensity (one-way ANOVA, F = 324.5, HAT vs HAS: *P < 0.0001; HAT vs HAT-sh-ctrl: P = 0.4469; HAT-sh-ctrl vs HAT-sh-Bach1: #P < 0.0001) in the HAS, HAT, HAT+sh-ctrl and HAT+sh-Bach1 groups (per group n = 4). Data were shown as mean ± SD.

References

    1. Liu Y, Zhao Z, Guo J, Ma Y, Li J, Ji H, et al. Anacardic acid improves neurological deficits in traumatic brain injury by anti-ferroptosis and anti-inflammation. Exp Neurol. 2023;370:114568. - PubMed
    1. Meng S, Cao H, Huang Y, Shi Z, Li J, Wang Y, et al. ASK1-K716R reduces neuroinflammation and white matter injury via preserving blood-brain barrier integrity after traumatic brain injury. J Neuroinflammation. 2023;20:244. - PMC - PubMed
    1. Tang Y, Liu Y, Zhou H, Lu H, Zhang Y, Hua J, et al. Esketamine is neuroprotective against traumatic brain injury through its modulation of autophagy and oxidative stress via AMPK/mTOR-dependent TFEB nuclear translocation. Exp Neurol. 2023;366:114436. - PubMed
    1. Wei L, Zhang J, Zhang B, Geng J, Tan Q, Wang L, et al. Complement C3 participates in the function and mechanism of traumatic brain injury at simulated high altitude. Brain Res. 2020;1726:146423. - PubMed
    1. Ma SQ, Xu XX, He ZZ, Li XH, Luo JM. Dynamic changes in peripheral blood-targeted miRNA expression profiles in patients with severe traumatic brain injury at high altitude. Mil Med Res. 2019;6:12. - PMC - PubMed

LinkOut - more resources