

Development of an mPBPK machine learning framework for early target pharmacology assessment of biotherapeutics
- PMID: 39905178
- PMCID: PMC11794604
- DOI: 10.1038/s41598-025-87316-w
Development of an mPBPK machine learning framework for early target pharmacology assessment of biotherapeutics
Abstract
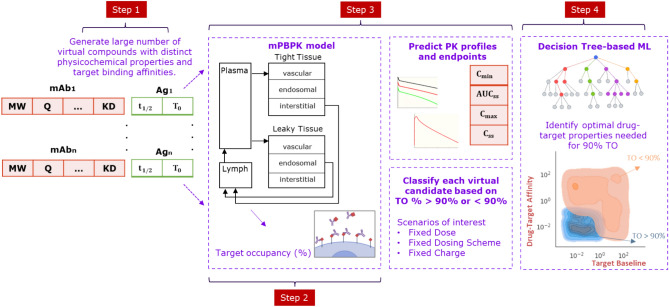
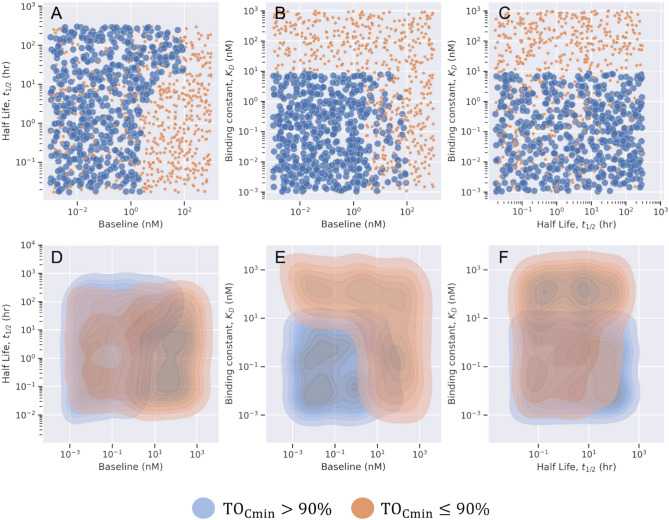
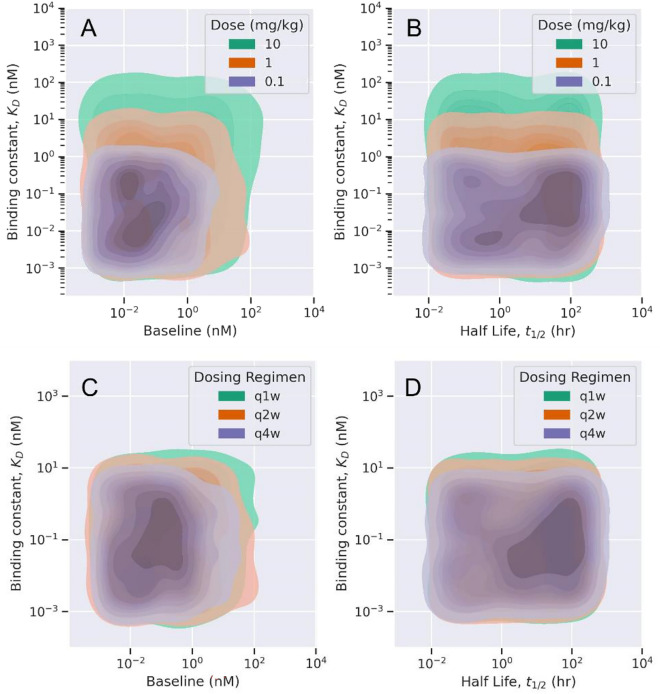
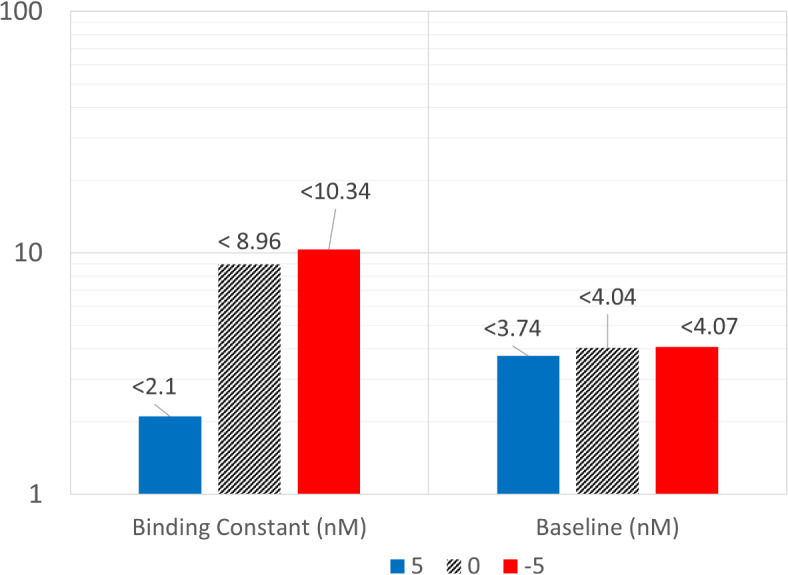
Development of antibodies often begins with the assessment and optimization of their physicochemical properties, and their efficient engagement with the target of interest. Decisions at the early optimization stage are critical for the success of the drug candidate but are constrained due to the limited knowledge of the antibody and target pharmacology. In the present work, we propose a machine learning-based target pharmacology assessment framework that utilizes minimal physiologically based pharmacokinetic (mPBPK) modeling and machine learning (ML) to infer optimal physicochemical properties of antibodies and their targets. We use a mPBPK model previously developed by our group that incorporates a multivariate quantitative relationship between antibodies' physicochemical properties such as molecular weight (MW), size, charge, and in silico + in vitro derived descriptors with their PK properties. In this study, we perform a high-throughput exploration of virtual antibody drug candidates with varying physicochemical properties (binding affinity, charge, etc.), and virtual target candidates with varying characteristics (baseline expression, half-life, etc.) to unravel rules for antibody drug candidate selection that achieve favorable drug-target interaction, which is defined by target occupancy (TO) percentage. We identified that variations in the antibody dose and dosing scheme, target form (soluble or membrane-bound), antibody charge, and site of action had a significant effect on the TO and selection criteria for antibody drug candidates. By unraveling new design rules for antibody drug properties that are dependent on ML-based TO assessment, we deliver a first-in-class ML-based target pharmacology assessment framework toward better understanding of the biology-specific PK and ADME processes of antibody drug candidate proteins and reduce the overall time for drug development.
Keywords: Target pharmacology, Antibodies, Pharmacokinetics, High-throughput ML, Decision tree classification..
© 2025. This is a U.S. Government work and not under copyright protection in the US; foreign copyright protection may apply.
Conflict of interest statement
Declarations. Competing interests: All authors were employed by Sanofi while the manuscript was written.
Figures
Similar articles
-
A minimal physiologically based pharmacokinetic model to study the combined effect of antibody size, charge, and binding affinity to FcRn/antigen on antibody pharmacokinetics.J Pharmacokinet Pharmacodyn. 2024 Oct;51(5):477-492. doi: 10.1007/s10928-023-09899-z. Epub 2024 Feb 24. J Pharmacokinet Pharmacodyn. 2024. PMID: 38400996 Free PMC article.
-
Model-based Target Pharmacology Assessment (mTPA): An Approach Using PBPK/PD Modeling and Machine Learning to Design Medicinal Chemistry and DMPK Strategies in Early Drug Discovery.J Med Chem. 2021 Mar 25;64(6):3185-3196. doi: 10.1021/acs.jmedchem.0c02033. Epub 2021 Mar 15. J Med Chem. 2021. PMID: 33719432
-
Minimal Physiologically-based Pharmacokinetic Model to Investigate the Effect of Charge on the Pharmacokinetics of Humanized anti-HCV-E2 IgG Antibodies in Sprague-Dawley Rats.Pharm Res. 2022 Mar;39(3):481-496. doi: 10.1007/s11095-022-03204-2. Epub 2022 Mar 4. Pharm Res. 2022. PMID: 35246757
-
At the bench: the key role of PK-PD modelling in enabling the early discovery of biologic therapies.Br J Clin Pharmacol. 2014 May;77(5):740-5. doi: 10.1111/bcp.12225. Br J Clin Pharmacol. 2014. PMID: 23962236 Free PMC article. Review.
-
Impact of Physiologically Based Pharmacokinetics, Population Pharmacokinetics and Pharmacokinetics/Pharmacodynamics in the Development of Antibody-Drug Conjugates.J Clin Pharmacol. 2020 Oct;60 Suppl 1(Suppl 1):S105-S119. doi: 10.1002/jcph.1720. J Clin Pharmacol. 2020. PMID: 33205423 Free PMC article. Review.
References
-
- M. H. Linaraju, "Target Assessment in Drug Discovery and Development," June 2020. [Online]. Available: https://www.linkedin.com/pulse/target-assessment-drug-discovery-developm...-
-
- T. P. Kenakin, 2017 Pharmacology in Drug Discovery and Development in Chapter 1 - Pharmacology: The Chemical Control of Physiology Second Edition, 1-27(Academic Press)
MeSH terms
Substances
LinkOut - more resources
Full Text Sources
