. 2025 Feb 4:10.1038/s41587-024-02551-2.
doi: 10.1038/s41587-024-02551-2. Online ahead of print.

Implantation of engineered adipocytes suppresses tumor progression in cancer models

Affiliations

Implantation of engineered adipocytes suppresses tumor progression in cancer models

Hai P Nguyen et al. Nat Biotechnol. .

Abstract

Tumors exhibit an increased ability to obtain and metabolize nutrients. Here, we implant engineered adipocytes that outcompete tumors for nutrients and show that they can substantially reduce cancer progression, a technology termed adipose manipulation transplantation (AMT). Adipocytes engineered to use increased amounts of glucose and fatty acids by upregulating UCP1 were placed alongside cancer cells or xenografts, leading to significant cancer suppression. Transplanting modulated adipose organoids in pancreatic or breast cancer genetic mouse models suppressed their growth and decreased angiogenesis and hypoxia. Co-culturing patient-derived engineered adipocytes with tumor organoids from dissected human breast cancers significantly suppressed cancer progression and proliferation. In addition, cancer growth was impaired by inducing engineered adipose organoids to outcompete tumors using tetracycline or placing them in an integrated cell-scaffold delivery platform and implanting them next to the tumor. Finally, we show that upregulating UPP1 in adipose organoids can outcompete a uridine-dependent pancreatic ductal adenocarcinoma for uridine and suppress its growth, demonstrating the potential customization of AMT.


Conflict of interest statement

Competing interests: N.A. is a cofounder and on the scientific advisory board of Regel Therapeutics. N.A. receives funding from BioMarin Pharmaceutical Incorporate. H.P.N. and N.A. have filed a patent application covering embodiments and concepts disclosed in the paper. The other authors declare no competing interests.

Figures
Extended Data Fig. 1 |
Extended Data Fig. 1 |. CRISPRa upregulation of UCP1, PPARGC1A, and PRDM16 in human adipocytes suppresses cancer progression in various cancer types.
a, qRT-PCR of UCP1, PPARGC1A, and PRDM16 in white adipocytes transfected with CRISPRa using five different gRNAs per gene (n = 2 biological replicates). b, qRT-PCR of UCP1, PPARGC1A, and PRDM16 in human adipocytes transduced by AAV9-CRISPRa with the top two gRNAs per gene (n = 4 biological replicates). c, qRT-PCR of UCP1, PPARGC1A, and PRDM16 in human white adipocytes transduced with CRISPRa targeting UCP1, PPARGC1A, and PRDM16 (n = 8–10 biological replicates). d, qRT-PCR of TFAM, DIO2, CPT1b, and NRF1 in CRISPRa-modulated adipocytes (n = 8–10 biological replicates). e, Oxygen consumption rate (OCR) of CRISPRa-modulated adipocytes measured by the seahorse assay (n = 6 biological replicates). Uncoupled OCR was measured under oligomycin treatment, while maximal OCR was measured under FCCP. f, Glucose uptake of CRISPRa-modulated adipocytes with or without insulin (n = 3 biological replicates). g, OCR of CRISPRa-modulated cells measured by the seahorse assay in BSA- or BSA-Palmitate-medium (n = 5 biological replicates). h, Exogenous fatty acid oxidation of CRISPRa-modulated adipocytes calculated by the difference of area under the curve of OCR between BSA- and BSA-Palmitate media upon FCCP treatment (n = 4–5 biological replicates). i, Fatty acid (FA) uptake of control and UCP1-CRISPRa-modulated adipocytes (n = 4 biological replicates). j, BrdU incorporation of five cancers cell lines co-cultured with CRISPRa-modulated adipocytes (n = 4–5 biological replicates). k, OCR under FCCP of cancer cells co-cultured with CRISPRa-modulated cells measured by the seahorse assay in BSA-medium (n = 4–5 biological replicates). l, qRT-PCR (n= 3 biological replicates) and immunoblotting (n = 2 biological replicates; uncropped images in Source Data Extended Data Fig. 1) for UCP1 in primary adipocytes transduced with UCP1-CRISPRa. m, Cell numbers of various cancer cells co-cultured with CRISPRa-modulated primary adipocytes (n = 5–6 biological replicates). n, Cell viability assay on MCF-7 cells treated with CRISPRa-UCP1-AAV adipocytes (AMT), 6-aminonicotinamide (6-AN; purple bars) at 50 μM, 100 μM and DMSO as negative control and Etomoxir (ETO; yellow bars) at100 μM, 200 μM and DMSO as negative control (n = 4 biological replicates). All statistical tests in d,e,f,j,k were carried out using a one-way ANOVA and the rest using a two tailed t-test. Data are represented as mean ± standard deviation (SD) *≤0.05, **≤0.01, ***≤0.001.
Extended Data Fig. 2 |
Extended Data Fig. 2 |. CRISPRa upregulation of UCP1, PPARGC1A, and PRDM16 in human adipose organoids and proliferation and metabolic gene expression in tumors co-transplanted with CRISPRa-modulated adipose organoids.
a, Representative images of human adipose organoids transduced with UCP1, PPARGC1A, and PRDM16 AAV9 CRISPRa showing mCherry expression. White scale bar on lower left depicts 176.6μm. b, qRT-PCR of FABP4, PLIN1, and ADIPOQ in adipose organoids (n = 4 biological replicates). c, qRT-PCR of UCP1, PPARGC1A, and PRDM16 in human adipose organoids transduced by AAV9 CRISPRa (n = 5–7 biological replicates). d, Body weight of mice co-transplanted with UCP1-modulated adipose organoids and cancer cells (n = 8 mice). e, Immunofluorescence of LipidTox-stained-adipose organoids after implantation near MCF-7 xenografts. White scale bar on lower right bar depicts 100μm. f, qRT-PCR of UCP1, GLUT4, PPARGC1A, TFAM, DIO2, and CPT1B of adipose organoids after implantation near MCF-7 xenografts (n = 8 biological replicates). g, qRT-PCR of MKI67 in xenograft tumors derived from MCF-7, MDA-MB-436, Panc 10.05, and DU-145 cancer cells co-transplanted with UCP1-CRISPRa modulated adipose organoids (n = 6–8 biological replicates). h, qRT-PCR of GLUT4, GCK, CD36, and CPT1B in xenograft tumors (n = 6–8 biological replicates). i, Representative images and quantification of immunofluorescence staining for Caspase 3 in tumors co-implanted with UCP1-CRISPRa adipose organoids (n = 6 cryosections). White scale bar on lower right bar depicts 10μm. j, Representative images, volume, qRT-PCR of proliferation maker, MKI67 and metabolic genes, including GLUT4, GCK, CD36, and CPT1b of MCF tumors co-implanted with primary adipose organoids (N = 3 mice). All statistical tests were carried out using a two tailed t-test and data are represented as mean ± standard deviation (SD) *≤0.05, **≤0.01, ***≤0.001.
Extended Data Fig. 3 |
Extended Data Fig. 3 |. UCP1-CRISPRa human adipose organoids increased whole-body energy expenditure, glucose tolerance, and insulin sensitivity.
a, Whole-body oxygen consumption at 30 °C, 16 °C, and 4 °C during day and night time of mice implanted with UCP1-CRISPRa modulated adipose organoids (n = 4 mice). b, Glucose tolerance test and insulin tolerance test (n = 4 mice). c, Plasma insulin levels of wild type SCID mice (WT) and mice that were co-transplanted with dCas9-VP64 (control) and UCP1-CRISPRa adipose organoids and xenografts (n = 6–8 mice). d, tumor size of MCF7 tumor xenograft and UCP1-CRISPRa treated human adipose organoids in immune-deficient SCID mice fed with standard chow, high-fat diet (HFD), and 15% glucose containing water during 9 weeks (n = 4–5 mice). e, Immunofluorescence images from cryosections of xenograft tumors (n = 5 sections per treatment) of Ki67, CA9, and CD31. White scale bar on lower right bar depicts 20μm. f, Principle component analysis (PCA) of MCF7 tumors that were co-implanted with UCP1-CRISPRa treated human adipose organoids in mice fed with standard chow (left) high-fat diet (middle) or 15% glucose (right); (N = 3). g, Volcano plots showing p-value versus fold change of MCF-7 tumors that were co-implanted with UCP1-CRISPRa treated human adipose organoids in mice fed with high-fat diet or 15% glucose. No differentially expressed genes were identified, defined as those exhibiting at least a +/− 4.0 fold change, with their expression being significantly different from the basal level (false discovery rate (FDR) adjusted, p < 0.01). All statistical tests in a-d were carried out using a two tailed t-test and data are represented as mean ± standard deviation (SD) *≤0.05, **≤0.01, ***≤0.001.
Extended Data Fig. 4 |
Extended Data Fig. 4 |. CRISPRa upregulation of Ucp1 in mouse white adipocytes and phenotypic analysis of mouse genetic cancer models.
a, qRT-PCR of Ucp1, in white adipocytes transfected with CRISPRa using five different gRNAs (n = 4–6 biological replicates). b, qRT-PCR of Ucp1 in mouse adipocytes transduced by AAV9-CRISPRa with two gRNAs (n = 5–6 biological replicates). c, qRT-PCR of mCherry and Ucp1 in mouse adipose organoids (n = 5 biological replicates). d, Body weight of pancreatic cancer KPC mice implanted with control (dCas9-VP64) or Ucp1-upregulated mouse adipose organoids (n = 5–6 mice). e, Immunofluorescence staining of CK19, Ki67, CA9, and CD31 in cryosections of pancreatic tumors (N = 6 sections). White scale bar on lower right bar depicts 20μm. f, Representative images and quantification of Caspase3 in cryosections of pancreatic tumors (N = 6 sections). White scale bar on lower right bar depicts 10μm. g, Plasma insulin levels of pancreatic cancer genetic mice implanted with either Ucp1-CRISPRa adipose organoids or control organoids (n = 4 mice). h, Body weight of breast cancer (MMTV-PyMT) mice implanted with control (dCas9-VP64) or Ucp1-CRISPRa mouse adipose organoids nearby mammary gland (MG) or distal (DOR)(n = 4 mice). i, Plasma insulin levels of breast cancer genetic mice implanted with either Ucp1-CRISPRa adipose organoids or control organoids nearby mammary gland (MG) or distal (DOR)(n = 4 mice). All statistical tests were carried out using a two tailed t-test and data are represented as mean ± standard deviation (SD) *≤0.05, **≤0.01, ***≤0.001.
Extended Data Fig. 5 |
Extended Data Fig. 5 |. CRISPRa upregulation of UCP1 in human mammary gland adipocytes.
a, Representative images of adipocytes isolated from mammary glands that were transduced with UCP1-CRISPRa AAV9. Scale bar on lower left depicts 265.2μm. b, qRT-PCR of mcherry and UCP1 in CRISPRa-modulated mammary gland adipocytes (n = 5 biological replicates). c, Glucose uptake and fatty acid uptake of UCP1-CRISPRa adipocytes of sample TOR40 (n = 3 biological replicates). d, Bright-field images of adipose organoids that were co-cultured with UCP1-CRISPRa modulated mammary gland adipocytes. Scale bars at bottom left depicts 265.2μm (TOR40, TOR120, TOR127) and 530.4μm (TOR41, TOR124). All statistical tests were carried out using a two tailed t-test and data are represented as mean ± standard deviation (SD) **≤0.01, ***≤0.001.
Extended Data Fig. 6 |
Extended Data Fig. 6 |. Inducible CRISPRa-modulated adipose organoids and CRISPRa-upregulation of UPP1 in adipocytes to suppress cancer growth of pancreatic ductal adenocarcinoma.
a, qRT-PCR of Cas9 and UCP1 in adipocytes transduced with inducible CRISPRa AAV and treated with either DMSO or doxycycline (Dox) (n = 3 biological replicates). b, Electron microscopy image of adipose organoids implanted in a microwell scaffold showing the organoid attached to the scaffold with filopodia and lamellipodia (1.0 kV, 1500x, and 7.861 mm lens). c, qRT-PCR of UPP1 in white adipocytes transfected with CRISPRa using five different gRNAs (left) and AAV transduced (right) with two gRNAs targeting the UPP1 promoter (n = 3 biological replicates). d, Uridine uptake after 1 or 12 hours measured with incubating UPP1-CRISPRa modulated adipocytes with 3H-uridine (n = 3 biological replicates). e, Lactate levels of UPP1-CRISPRa modulated adipocytes (n = 4 biological replicates). f, Representative images, cell numbers/view, and ATP levels of PANC-1 cells that were co-cultured with UPP1-modulated adipocytes or control (dCas9-VP64 only) adipocytes in high-glucose media (n = 5 biological replicates). White scale bar on lower right bar depicts 100μm. All statistical tests were carried out using a two tailed t-test and data are represented as mean ± standard deviation (SD) *≤0.05, **≤0.01, ***≤0.001.
Fig. 1 |
Fig. 1 |. CRISPRa-modulated adipocytes inhibit cancer cell growth in vitro.
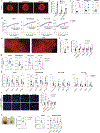
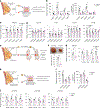
a, Schematic of the co-culturing model of cancer cells and CRISPRa-treated adipocytes using Transwell plates and their subsequent phenotyping (created with BioRender.com). b, Representative images of cancer cells, including breast (MCF-7, MDA-MB-436), colon (SW-1417), pancreatic (Panc 10.05) and prostate cancer (DU-145), that were co-cultured with CRISPRa-upregulating UCP1, PPARGC1a and PRDM16 or control (dCas9–VP64 only) adipocytes. Scale bars, 530.4 μm. c, Cancer cell number per view of image (four images or replicates per condition). d, RT–qPCR of the proliferation marker gene MKI67 for cancer cells co-cultured with CRISPRa-modulated adipocytes (n = 4 biological replicates). e, Basal glycolysis measured by calculating the area under the curve of ECAR upon glucose treatment (n = 4–5 biological replicates). f, Maximal glycolysis measured by calculating the area under the curve of ECAR upon oligomycin treatment (n = 4–5 biological replicates). g,h, Glucose uptake of cancer cells co-cultured with CRISPRa-modulated adipocytes without (g) or with (h) insulin (n = 3 biological replicates). i, RT–qPCR of glucose transporter GLUT4 and glycolytic enzyme GCK in cancer cells (n = 3–4 biological replicates). j, Exogenous FAO of cancer cells calculated by the difference of area under the curve of OCR of BSA-palmitate media upon FCCP treatment (n = 4 biological replicates). k, RT–qPCR of fatty acid transporter CD36 and fatty acid regulatory transporter CPT1b in cancer cells that were co-cultured with CRISPRa-treated adipocytes (n = 3–4 biological replicates). All statistical tests were carried out using a one-way ANOVA and data are represented as mean ± s.d. *P ≤ 0.05; **P ≤ 0.01; ***P ≤ 0.001; ****P ≤ 0.0001.
Fig. 2 |
Fig. 2 |. Co-transplantation of xenografts with UCP1-CRISPRa-modulated human adipose organoids suppresses tumor growth.
a, Schematic of the co-transplantation model for xenografts and UCP1-CRISPRa-treated human adipose organoids in immune-deficient SCID mice and their subsequent phenotyping (created with BioRender.com). b, Representative images of xenograft tumors from various cancer cell lines, including breast (MCF-7 and MDA-MB-436), pancreatic (Panc 10.05) and prostate cancer (DU-145), that were co-transplanted with UCP1-CRISPRa human adipose organoids or control (dCas9–VP64 only) adipose organoids (n = 8 mice per treatment). TN, triple negative. The bar chart to the right of the images shows the volume of xenograft tumors that were co-transplanted with UCP1-CRISPRa human adipose organoids compared to control (dCas9–VP64 only) (n = 6–8 mice). ce, Immunofluorescence staining and quantification of Ki67 (c), CA9 (d) and CD31 (e) in cryosections of xenograft tumors (n = 4–5 sections per treatment). Scale bars, 10 μm. All statistical tests were carried out using a two-tailed t-test and data are represented as mean ± s.d. ***P ≤ 0.001.
Fig. 3 |
Fig. 3 |. Increasing nutrients reduces UCP1-CRISPRa human adipose organoid cancer suppression.
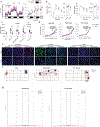
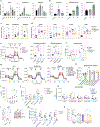
a, Glucose levels measured from adipose organoids co-transplanted with MCF-7 xenograft tumors using a glucose uptake assay (n = 5–6 biological replicates). b,c, Metabolomics analysis of glucose and glycolysis intermediates, including glucose-6-phosphate (G6P), fructose-6-phosphate (F6P), 3-phosphoglycerate (3-PG) and phosphoenolpyruvate (PEP) (b), and fatty acids, including oleic acid and palmitoleic acid (n = 5 biological replicates) (c). Data are represented as mean ± s.d. d, Schematic of the co-transplantation model for MCF-7 tumor xenograft and UCP1-CRISPRa-treated human adipose organoids in immune-deficient SCID mice fed with standard chow, HFD or 15% glucose containing water and their subsequent phenotyping (created with BioRender.com). e, Representative images and tumor volume of MCF-7 xenografts that were co-transplanted with UCP1-CRISPRa human adipose organoids or control (dCas9–VP64 only) from mice on different diets (n = 4–5 mice per treatment). f, RT–qPCR of proliferation marker gene MKI67 and metabolic genes (GLUT4, GCK, CD36, CPT1b) from MCF-7 xenograft tumors co-transplanted with UCP1-CRISPRa or control (dCas9–VP64 only) human adipose organoids in mice fed with various diets (n = 4–5 biological replicates). gi, Immunofluorescence quantification from cryosections of xenograft tumors (n = 5 sections per treatment) of Ki67 (g), CA9 (h) and CD31 (i). j, Volcano plot showing P value versus fold change of MCF-7 tumors co-implanted with UCP1-CRISPRa compared to negative-control-treated human adipose organoids in mice on standard chow diet. Differentially expressed genes are those exhibiting at least a ±fourfold change, with their expression being significantly different from basal level (false discovery rate (FDR)-adjusted P < 0.01). k, Gene ontology enrichment of significantly downregulated and upregulated genes in MCF-7 tumors from mice on standard chow, using Geneontology.org (https://geneontology.org), with an FDR-adjusted Fisher’s Exact test P value of <0.0001. Cell cycle is represented by the term ‘Cell cycle: positive regulation of G2/M transition of mitotic cell cycle’, and cell division by the term ‘Cell division: cytokinesis’. All statistical tests in ai were carried out using a two-tailed t-test and data are represented as mean ± s.d. *P ≤ 0.05; **P ≤ 0.01; ***P ≤ 0.001.
Fig. 4 |
Fig. 4 |. Implantation of Ucp1-CRISPRa adipose organoids in pancreatic and breast cancer genetic mouse models suppresses cancer development.
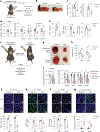
a, Schematic of the transplantation model for Ucp1-CRISPRa-treated mouse adipose organoids in KPC pancreatic cancer mice and their subsequent phenotyping (created with BioRender.com). b, Representative images of the pancreas implanted with Ucp1-CRISPRa or control (dCas9–VP64 only) mouse adipose organoids (n = 5–6 mice per treatment). c, Mass and immunofluorescence staining of Ck19 (μm2 per section) of the pancreas transplanted with Ucp1-CRISPRa-modulated mouse adipose organoids compared to control (dCas9–VP64 only) (n = 5–6 mice). d, RT–qPCR of the proliferation marker gene Mki67 and metabolic genes Glut2, Gck, Cd36 and Cpt1b from pancreatic tumors co-transplanted with Ucp1-CRISPRa-modulated adipocytes (n = 5–6 biological replicates). e, Immunofluorescence quantification of Ki67, CA9 and CD31 in cryosections of tumors (n = 5–6 sections per treatment). f, Schematic of the transplantation model for Ucp1-CRISPRa-treated mouse adipose organoids in the mammary gland or on the back of MMTV-PyMT breast cancer mice and their subsequent phenotyping (created with BioRender.com). g, Representative images of the breast tumors that were implanted with Ucp1-CRISPRa or control (dCas9–VP64 only) adipose organoids in the mammary gland or on the back of the mice (dorsal) (n = 4 mice per treatment). h, Volume of the tumors transplanted with Ucp1-CRISPRa adipose organoids compared to control (dCas9–VP64 only) (n = 4 mice). i, RT–qPCR of the proliferation marker gene Mki67 and metabolic genes Glut4, Gck, Cd36 and Cpt1b from breast tumors co-transplanted with Ucp1-CRISPRa-modulated adipocytes (n = 3–4 biological replicates). jm, Immunofluorescence staining and quantification of Ki67 (j), CA9 (k), CD31 (l) and caspase-3 (m) in tumor cryosections (n = 4–5 sections per treatment). White scale bars on the bottom right represent 10 μm (CA9, CD31, caspase 3) or 20 μm (Ki67 and CA9 DOR-Ucp1). All statistical tests were carried out using a two-tailed t-test and data are represented as mean ± s.d. *P ≤ 0.05; **P ≤ 0.01; ***P ≤ 0.001.
Fig. 5 |
Fig. 5 |. Cancer organoids co-cultured with UCP1-CRISPRa adipocytes, both from dissected breast tissue, lead to tumor suppression and prevent cancer development.
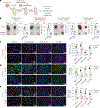
a, Schematic of the co-culturing model of UCP1-CRISPRa-modulated human mammary adipocytes and breast cancer organoids from dissected breast tumors (created with BioRender.com). b, Cancer organoid size and numbers of breast tumor organoids from five dissected breast tumors that were co-cultured with UCP1-CRISPRa adipocytes or control (dCas9–VP64 only) adipocytes (n = 4 biological replicates). c,d, RT–qPCR of the proliferation marker gene MKI67 (c) and metabolic genes GLUT4, GCK, CD36 and CPT1b (d) of breast cancer organoids that were co-cultured with CRISPRa-modulated adipocytes (n = 4 biological replicates). e, Schematic of the co-transplantation model for breast cancer organoids and UCP1-CRISPRa-treated breast adipocytes in immune-deficient SCID mice and their subsequent phenotyping (created with BioRender.com). f, Representative images and tumor size of breast cancer organoids co-implanted with UCP1-CRISPRa or control (dCas9–VP64 only) breast adipocytes (n = 3 biological replicates). g, RT–qPCR of the proliferation marker gene MKI67 and metabolic genes GLUT4, GCK, CD36 and CPT1b of breast cancer organoids that were co-cultured with UCP1-CRISPRa or dCas9–VP64-treated breast adipocytes (n = 3 biological replicates). h, Schematic of the co-culturing model of UCP1-CRISPRa-modulated human mammary adipocytes and breast organoids cultured from breast tissues of BRCA1/BRCA2/RAD51D mutation carrier donors (created with BioRender.com). i, Organoid size and numbers of breast organoids from three resected breast tissues that were co-cultured with UCP1-CRISPRa adipocytes or control (dCas9–VP64 only) adipocytes (n = 3 biological replicates). j, RT–qPCR of the proliferation marker genes MKI67 and MTOR and CK5 and CK17 of breast organoids that were co-cultured with CRISPRa-modulated adipocytes (n = 3 biological replicates). All statistical tests were carried out using a two-tailed t-test and data are represented as mean ± s.d. *P ≤ 0.05; **P ≤ 0.01; ***P ≤ 0.001.
Fig. 6 |
Fig. 6 |. Development of inducible AMT systems and the use of AMT to upregulate UPP1 to suppress PDA.
a, Schematic of the inducible CRISPRa-AAV system (created with BioRender.com). Upon tetracycline treatment, rtTA binds to TRE and induces dCas9–VP64 expression. b, Representative image and tumor size of MCF-7 tumors that were co-implanted with UCP1-CRISPRa or control (dCas9–VP64 only) human adipose organoids (n = 4 biological replicates). c, RT–qPCR of proliferation marker gene MKI67 and metabolic genes (GLUT4, GCK, CD36 and CPT1b) of tumors co-implanted with CRISPRa-modulated adipocytes (n = 4–5 biological replicates). d, Schematic of co-transplantation of MCF-7 tumors and cell scaffolds containing UCP1-CRISPRa or control (dCas9–VP64 only) human adipose organoids and tumor phenotyping (lower panel created with BioRender.com). e, Representative images of cell scaffolds in plate (left), electron microscopy image (1.0 kV, ×500 and 7.895 mm lens) of scaffold containing an adipose organoid (middle) and the scaffold implanted in mice (right). f, Representative image and tumor size of MCF-7 tumors co-implanted with cell scaffold containing UCP1-CRISPRa or control (dCas9–VP64 only) human adipose organoids (n = 4–5 biological replicates). g, RT–qPCR of the proliferation marker gene MKI67 and metabolic genes (GLUT4, GCK, CD36, and CPT1b) of tumors co-implanted with CRISPRa-modulated adipocytes (n = 4–5 biological replicates). h, Cell number per view of PANC-1 pancreatic cancer cells that were co-cultured with UPP1-CRISPRa or control (dCas9–VP64 only) human adipocytes in media without (−) or with (+) 1 mM uridine (n = 5 biological replicates). i, ATP levels measured in PANC-1 pancreatic cancer cells co-cultured with UPP1-CRISPRa-modulated adipocytes without (−) or with (+) excess uridine (n = 5 biological replicates). j, NADH and lactate levels in PANC-1 pancreatic cancer cells that were co-cultured with UPP1-CRISPRa-modulated adipocytes without the addition of uridine (n = 5 biological replicates). k, Schematic of the co-transplantation of PANC-1 tumors with UPP1-CRISPRa-modulated adipose organoid in SCID mice. l, Representative image and size of PANC-1 xenograft tumor co-implanted with dCas9–VP64 or UPP1-CRISPRa-modulated adipose organoids (n = 5 biological replicates). m, RT–qPCR of MKI67. n, NADH and lactate levels in PANC-1 tumors that were co-implanted with dCas9–VP64 or UPP1-CRISPRa-modulated adipose organoids (n = 5 biological replicates). All statistical tests were carried out using a two-tailed t-test and data are represented as mean ± s.d. *P ≤ 0.05; **P ≤ 0.01; ***P ≤ 0.001.

References

    1. Lin X, Xiao Z, Chen T, Liang SH & Guo H Glucose metabolism on tumor plasticity, diagnosis, and treatment. Front. Oncol. 10, 317 (2020). - PMC - PubMed
    1. Hay N Reprogramming glucose metabolism in cancer: Can it be exploited for cancer therapy? Nat. Rev. Cancer 16, 635–649 (2016). - PMC - PubMed
    1. Liberti MV & Locasale JW The Warburg effect: How does it benefit cancer cells? Trends Biochem. Sci. 41, 211–218 (2016). - PMC - PubMed
    1. Nagarajan SR, Butler LM & Hoy AJ The diversity and breadth of cancer cell fatty acid metabolism. Cancer Metab. 9, 2 (2021). - PMC - PubMed
    1. Palm W & Thompson CB Nutrient acquisition strategies of mammalian cells. Nature 546, 234–242 (2017). - PMC - PubMed

LinkOut - more resources