

The transcriptional response to yellow and wilt disease, caused by race 6 of Fusarium oxysporum f. sp. Ciceris in two contrasting chickpea cultivars
- PMID: 39905311
- PMCID: PMC11792444
- DOI: 10.1186/s12864-025-11308-3
The transcriptional response to yellow and wilt disease, caused by race 6 of Fusarium oxysporum f. sp. Ciceris in two contrasting chickpea cultivars
Abstract
Background: Chickpea (Cicer arietinum L.) ranks as the third most crucial grain legume worldwide. Fusarium wilt (Fusarium oxysporum f. sp. ciceri (Foc)) is a devastating fungal disease that prevents the maximum potential for chickpea production.
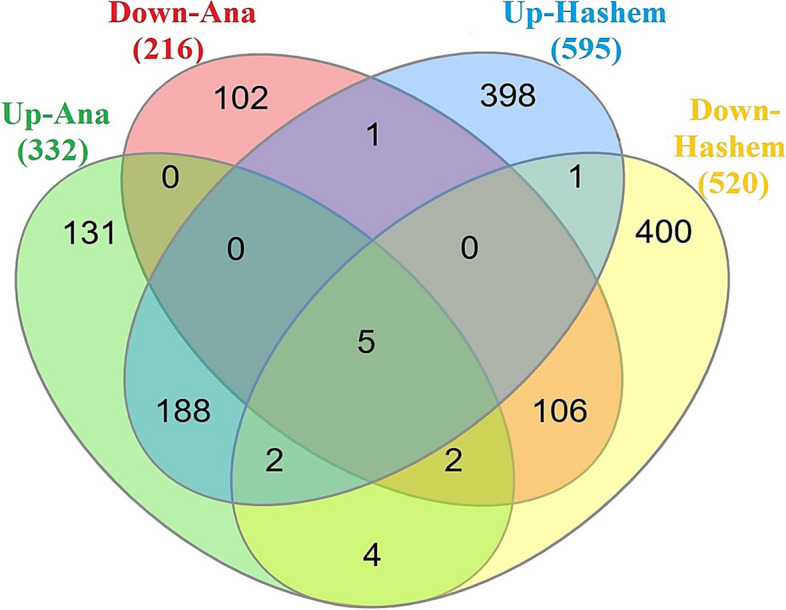
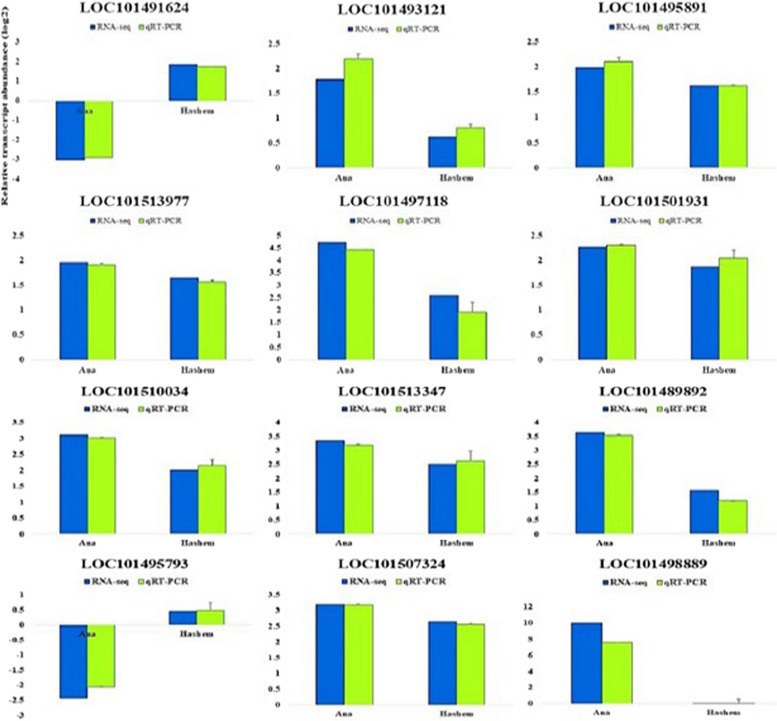
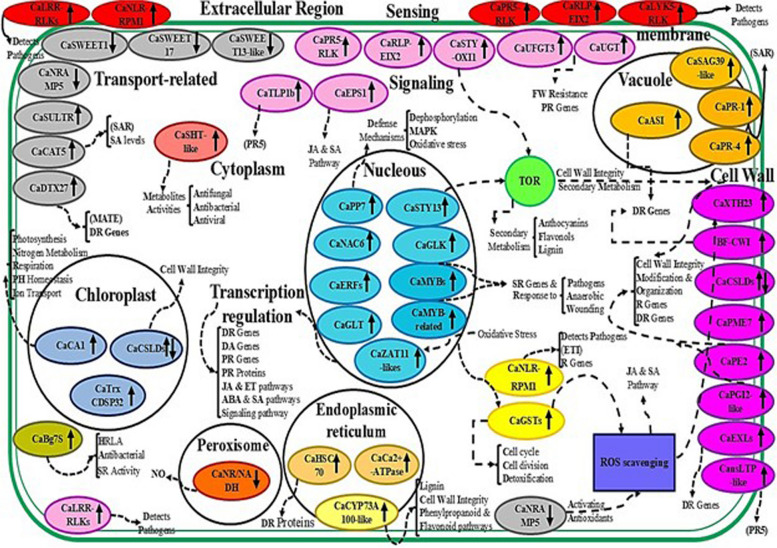
Results: To identify genes and pathways involved in resistance to race 6 of Foc, this study utilized transcriptome sequencing of two chickpea cultivars: resistant (Ana) and susceptible (Hashem) to Foc race 6. Illumina sequencing of the root samples yielded 133.5 million raw reads, with about 90% of the clean reads mapped to the chickpea reference genome. The analysis revealed that 548 genes (332 upregulated and 216 downregulated) in the resistant genotype (Ana) and 1115 genes (595 upregulated and 520 downregulated) in the susceptible genotype (Hashem) were differentially expressed under Fusarium wilt (FW) disease stress caused by Foc race 6. The expression patterns of some differentially expressed genes (DEGs) were validated using quantitative real-time PCR. A total of 131 genes were exclusively upregulated under FW stress in the resistant cultivar, including several genes involved in sensing (e.g., CaNLR-RPM1, CaLYK5-RLK, CaPR5-RLK, CaLRR-RLK, and CaRLP-EIX2), signaling (e.g., CaPP7, CaEPS1, CaSTY13, and CaPR-1), transcription regulation (e.g., CaMYBs, CaGLK, CaERFs, CaZAT11-like, and CaNAC6) and cell wall integrity (e.g., CaPGI2-like, CaEXLs, CaCSLD and CaCYP73A100-like).
Conclusions: The achieved results could provide insights into the molecular mechanism underlying resistance to FW and could be valuable for breeding programs aimed at developing FW-resistant chickpea varieties.
Keywords: Biotic stress; Chickpea; Fusarium wilt (race 6); RNA sequencing.
© 2025. The Author(s).
Conflict of interest statement
Declarations. Ethics approval and consent to participate: We declare that the plants used in this study complied with local or national guidelines. All plant materials used in this article are cultivated crop varieties (i.e. two Iranian chickpea cultivars) belonging to the Iranian Dryland Agricultural Research Institute (DARI). According to the rules of this institute, the researchers are permitted to use the plant materials for research purposes. Competing interests: The authors declare no competing interests.
Figures


References
-
- Wood JA, Grusak MA. Nutritional value of chickpea. Chickpea Breed Manag. 2007;101–42. Available from: 10.1079/9781845932138.005.
-
- Shiade G, Roghie S, Fathi A, Kardoni F, Pandey R, Pessarakli M. Nitrogen contribution in plants: recent agronomic approaches to improve nitrogen use efficiency. J Plant Nutr. 2024;47(2):314–31. Available from: 10.1080/01904167.2023.2278656. Cited 2021 Oct 16.
-
- FAO, FAOSTAT. FAOSTAT. 2021. Available from: https://www.fao.org/faostat.
-
- Hamida D, Gowda VT, Kundu A, Kaur R. Bag. and TK. Effect of culture filtrate containing fusaric acid of Fusarium oxysporum f. sp. ciceris on defence enzymes in chickpea. Indian Phytopathol. 2024;1–9. Available from: 10.1007/s42360-023-00702-0.
MeSH terms
Supplementary concepts
Grants and funding
LinkOut - more resources
Full Text Sources
Miscellaneous
