. 2025 Feb 4;23(1):79.
doi: 10.1186/s12951-025-03171-x.

Resetting the Hsc70-mediated lysosomal degradation of PD-L1 via a supramolecular meso peptide for the restoration of acquired anti-tumor T cell immunity

Affiliations

Resetting the Hsc70-mediated lysosomal degradation of PD-L1 via a supramolecular meso peptide for the restoration of acquired anti-tumor T cell immunity

Yujia Zhao et al. J Nanobiotechnology. .

Abstract

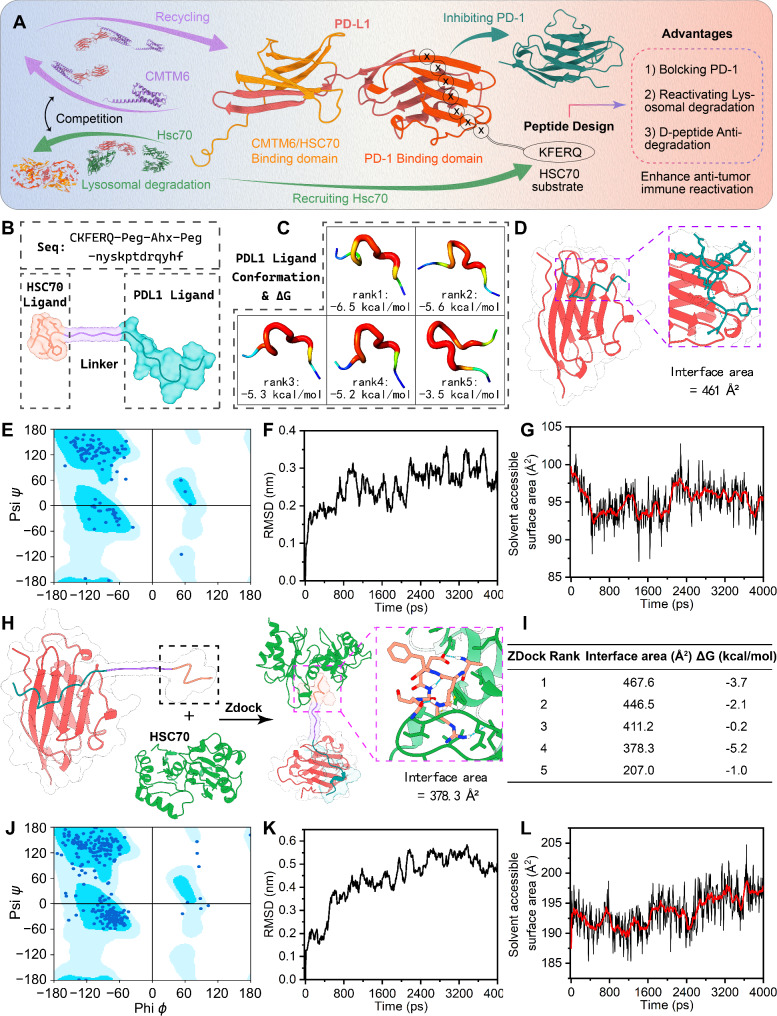
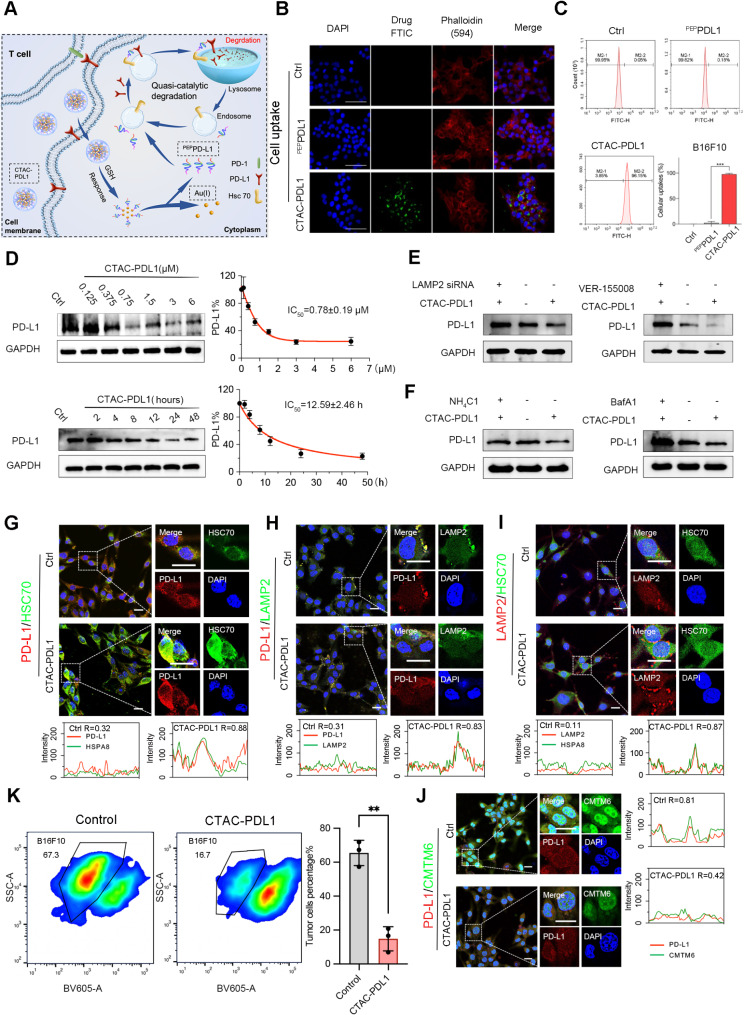
The reduction of cellular PD-L1 abundance through lysosomal degradation is recognized as essential for effective and sustained targeting of PD-L1-dependent immune evasion in cancer. While Hsc70 can interact with PD-L1 to promote its lysosomal degradation, the overexpression of CMTM6 competitively inhibits this interaction, leading to the blockade of PD-L1 lysosomal degradation. To overcome this issue, a meso chimeric peptide PEPPDL1 was designed to specifically bind the PD-1 binding domain of PD-L1 instead of the Hsc70/CMTM6 binding domain, while also binding to Hsc70 to facilitate the dragging of PD-L1 into Hsc70-mediated chaperone-mediated autophagy (CMA), thereby achieving lysosomal degradation. In order to enable internalization into tumor cells, supramolecular engineering techniques were employed through terminal modification involving sulfydryl and monovalent gold ion (Au(I)), both facilitating self-assembly of modified PEPPDL1 into supramolecular nanospheres termed CTAC-PDL1 driven by aurophilic interaction. Furthermore, based on bioinformatics analysis of mRNA expression data from 30 types of tumors obtained from TCGA database, malignant melanoma was identified as the most suitable indication for CTAC-PDL1 due to its specific characteristics of tumor immune. As expected, CTAC-PDL1 effectively reactivated Hsc70-mediated lysosomal degradation of PD-L1 and consequently restored anti-tumor T cell immunity in a B16F10-derived mouse model of malignant melanoma while maintaining a favorable safety profile. Overall, this work not only presents an alternative approach for targeting PD-L1-dependent cancer immune evasion, but also provides a modularized strategy for discovering specific regulators for target proteins in various diseases.

Keywords: Cellular abundance of PD-L1; Lysosomal degradation; Peptide; Supramolecule; Tumor immunotherapy.


Conflict of interest statement

Declarations. Ethics approval and consent to participate: All experimental procedures involving animals were conducted in accordance with Institution Guidelines and were approved by the Medical Ethics Committee of Xi’an Jiaotong University. Consent for publication: All authors of this study agreed to publish. Competing interests: The authors declare no competing interests.

Figures

Fig. 1
Fig. 1
The PEPPDL1 is designed to simultaneously bind both PD-L1 and Hsc70. A. Schematic diagram of PEPPDL1 peptide design that reactivates lysosomal degradation of PDL1 and blocks PD1. B. Schematic diagram of the synthesis of PEPPDL1. (C) The top five possible conformations of the PDL1 ligand moiety of PEPPDL1 bound to PDL1. (D) Mimic binding structure and local magnification of the PD1-binding domain of PD-L1 in complex with the PD-L1 ligand. (E) Ramachandran plot of PEPPDL1/PD-L1 complex. F&G, RMSD (F) and SASA (G) of PEPPDL1/PD-L1 complex over time in the simulation process. H. Docking and interactions of the PEPPDL1/PD-L1 complex with Hsc70. I. Gibbs energy and interaction area of the top five docked conformations in H. J. Ramachandran plot of the ternary complex (PEPPDL1/PD-L1/Hsc70 complex). K&L, RMSD (K) and SASA (L) of PEPPDL1/PD-L1/Hsc70 complex over time during simulation (Red line is the smoothed result of the black line in G&L)
Fig. 2
Fig. 2
The construction and characterization of CTAC-PDL1. (A) Schematic displaying the self-assembly of CTAC-PDL1. (B) Fourier transform infrared (FT-IR) of PEPPDL1 and CTAC-PDL1. (C) Characterization of synthesized PEPPDL1 and CTAC-PDL1 by UV-Vis spectrum. (D) TEM images of CTAC-PDL1. (E) Elemental analysis image of S, O, N, Au overlay with one representative particle of CTAC-PDL1 taken by HRTEM. (F) EDS quantitative element analysis of CTAC-PDL1. G&H. Hydrodynamic diameter (G) and ZETA potential (H) of CTAC-PDL1 assembled nanocluster measured in PBS buffer at pH 7.4. I.PEPPDL1 release curve of CTAC-PDL1 in 10 mM or 10 µM GSH PBS buffer, measured by HPLC. Data was presented as the mean ± SD. J. The stability of CTAC-PDL1 in 20% serum continuing 24 h
Fig. 3
Fig. 3
Skin cutaneous melanoma (SKCM) was identified as the most suitable indication for CTAC-PDL1. A. Heatmap of spearman correlation between expression of PD-L1 and TILs across human cancers. B. The correlation between expression of PD-L1 and immunoinhibitor including Treg abundance, IDO (Indoleamine 2,3-dioxygenase) and IL-10 expression respectively in SKCM. (C) The correlation between expression of PD-L1 and immunostimulator including active CD8 abundance, CD276 and PVR (Poliovirus receptor) expression in SKCM. (D) The correlation between expression of PD-L1 and HIPIR in SKCM; (E) Bubble diagram and Heatmap of correlation between expression of PD-L1 and multiple molecular chaperones in SKCM. (F) The expression quantity of Hsc70 between tumor and normal tissue in SKCM. (G) The correlation between expression of PD-L1 and Hsc70, LAMP2 and LAMP5 in SKCM. (H) Correlation analysis between CMTM6 and CD274, Hsc70 in GEPIA database in SKCM. (I) Schematic illustration for restoration of PD-L1 degradation to regulate anti-tumor activity
Fig. 4
Fig. 4
CTAC-PDL1 degraded PD-L1 via Hsc70/LAMP2-derived lysosomal degradation. A. Schematic diagram of lysosome-dependent degradation of PD-L1 in response to CTAC-PDL1 treatment in tumor cells. B&C. Cellular uptake of FITC-labeled PEPPDL1 and CTAC-PDL1 into B16F10 cells after 6 h incubation measured by Immunofluorescence with Laser Scanning Confocal Microscopy images (B) and flow cytometry (C) (Scale bar: 100 μm). D. After incubation with different concentration of CTAC-PDL1 for 24 h or different time of CTAC-PDL1 (0.75 µM), the expression of PD-L1 was measured by westen blot in B16F10 melanoma cells. E.The PD-L1 level responded to CTAC-PDL1 (50 µg/mL) with or without LAMP2-siRNA and VER-155,008 (HSPA8 inhibitor, 2.6 µM) by westen blot. F. The PD-L1 level responded to CTAC-PDL1 (50 µg/mL) with NH4Cl (250 mg/mL) or BafA1 (1 µM). G-J. immunofluorescence showed the colocalization between PD-L1 and HSPA8 (G), PD-L1 and LAMP2 (H), LAMP2 and HSPA8 (I) or CMTM6 and PD-L1 (J) after treated with CTAC-PDL1 (50 µg/mL) for 12 h. K. Flow cytometry analysis of percentages of tumor cells after CD8 + T cell co-cultured with B16F10 with or without CTAC-PDL1 (50 µg/mL) treatment. (**, p < 0.01)
Fig. 5
Fig. 5
CTAC-PDL1 effectively induced degradation of PD-L1 in vivo and revitalized the acquired immune response of T cells. A. Diagrammatic sketch of the B16F10 orthotopic melanoma model in C57BL/6 mice and the dosing regimen. (B16F10, 4*105 cells/mice). B&C. Immunohistochemical images (B) and IHC score (C) of PD-L1 in mice of B16F10 melanoma after indicated treatment (Scale bar: 50 μm). D&E. T-SNE plots showing cellular landscapes based on detailed cell typing in cancer cells both markers in cell types (D) and proportion of cell types (E). F. T-SNE plots showing the proportion of CD4 + and CD8 + cells in cancer cells. G. UMAP plots showing the expression of selected marker genes in CD8 + T cells. H. multichannel flow cytometry analysis of Treg in SKAM after different treatments. I. multichannel flow cytometry analysis of CTL cells in in SKAM after different treatments. J. The percentage of cell type after multichannel flow cytometry analysis. (*, p < 0.05; **, p < 0.01; ***, p < 0.001, ns mean no significant difference)
Fig. 6
Fig. 6
CTAC-PDL1 exhibited significant anti-tumor efficacy against B16F10-derived mice model of malignant melanoma. A-D. UMAP plots showing the expression of selected marker genes in cancer cells of proliferation (A), necroptosis (B), apoptosis (C) and ferroptosis (D). E. Representative H&E staining photos tumor sections. F. TUNEL staining images and quantitative analysis of tumor tissue sections after indicated treatment. G. Representative photos of the tumors isolated from mice at the end of the experiment. H. Tumor growth curves of Control, murine PD-1 monoclonal antibody and CTAC-PDL1 in mice subcutaneously inoculated with melanoma. Data are presented as Mean ± SEM. (n = 5/group). I-L. The Immunohistochemical images and IHC Score of CD80 (I), Perforin-1 (J), Granzyme A (K) and Granzyme B (L) in tumor sections with the indicated different treatments in mice of B16F10 melanoma. (Scale bar: 50 μm. *, p < 0.05; **, p < 0.01; ***, p < 0.001)

Similar articles

References

    1. Han Y, Liu D, Li L. PD-1/PD-L1 pathway: current researches in cancer. Am J Cancer Res. 2020;10:727–42. - PMC - PubMed
    1. Kim TK, Vandsemb EN, Herbst RS, Chen L. Adaptive immune resistance at the tumour site: mechanisms and therapeutic opportunities. Nat Rev Drug Discovery. 2022;21:529–40. - PubMed
    1. Zhou X, Yao Z, Bai H, Duan J, Wang Z, Wang X, Zhang X, Xu J, Fei K, Zhang Z, et al. Treatment-related adverse events of PD-1 and PD-L1 inhibitor-based combination therapies in clinical trials: a systematic review and meta-analysis. Lancet Oncol. 2021;22:1265–74. - PubMed
    1. Pang K, Shi Z-D, Wei L-Y, Dong Y, Ma Y-Y, Wang W, Wang G-Y, Cao M-Y, Dong J-J, Chen Y-A, et al. Research progress of therapeutic effects and drug resistance of immunotherapy based on PD-1/PD-L1 blockade. Drug Resist Updates. 2023;66:100907. - PubMed
    1. Li C-W, Lim S-O, Chung EM, Kim Y-S, Park AH, Yao J, Cha J-H, Xia W, Chan L-C, Kim T. Eradication of triple-negative breast cancer cells by targeting glycosylated PD-L1. Cancer Cell. 2018;33:187–201. e110. - PMC - PubMed

LinkOut - more resources