. 2025 Feb 4;23(1):151.
doi: 10.1186/s12967-025-06158-2.

Transcriptomic profiles of monocyte-derived macrophages exposed to SARS-CoV-2 VOCs reveal immune-evasion escape driven by delta

Affiliations

Transcriptomic profiles of monocyte-derived macrophages exposed to SARS-CoV-2 VOCs reveal immune-evasion escape driven by delta

Alessia Gallo et al. J Transl Med. .

Abstract

Background: Since the breakout of COVID-19, the mutated forms of severe acute respiratory syndrome coronavirus 2 (SARS-CoV-2) have shown enhanced rates of transmission and adaptation to humans. The variants of concern (VOC), designated Alpha, Beta, Gamma, Delta, and Omicron emerged independent of one another, and in turn rapidly became dominant. The success of each VOC, as well as the virus fitness, were enabled by altered intrinsic functional properties and, reasonably, to virus antigenicity changes, conferring the ability to evade a primed immune response.

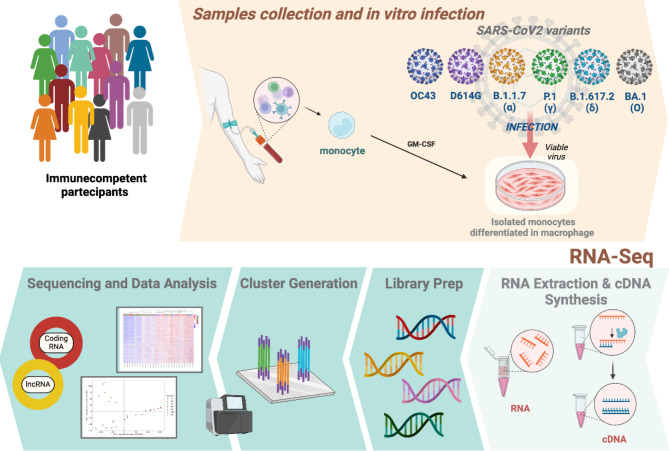
Methods: We analysed the gene expression profiles of monocyte-derived macrophages (MDM) isolated from whole blood of healthy participants exposed to the 5 different SARS-CoV-2 VOC: D614G, Alpha (B.1.1.7), Gamma (P1), Delta (B.1.617.2), and Omicron BA.1 (B.1.1.529), and to the HCoV-OC43 strain, a coronavirus already present in the population before the SARS-CoV-2 pandemic. Whole transcriptome RNA-Seq, for both coding and non-coding RNAs, was then made.

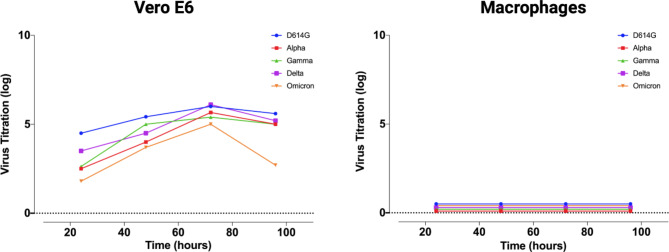
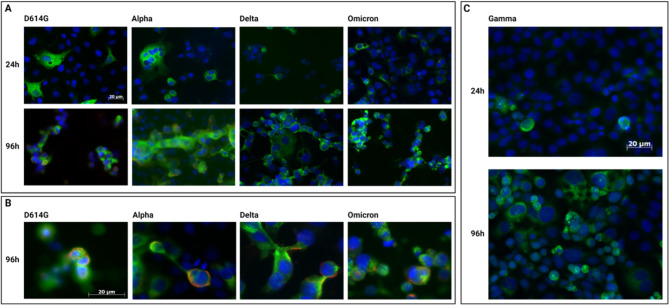
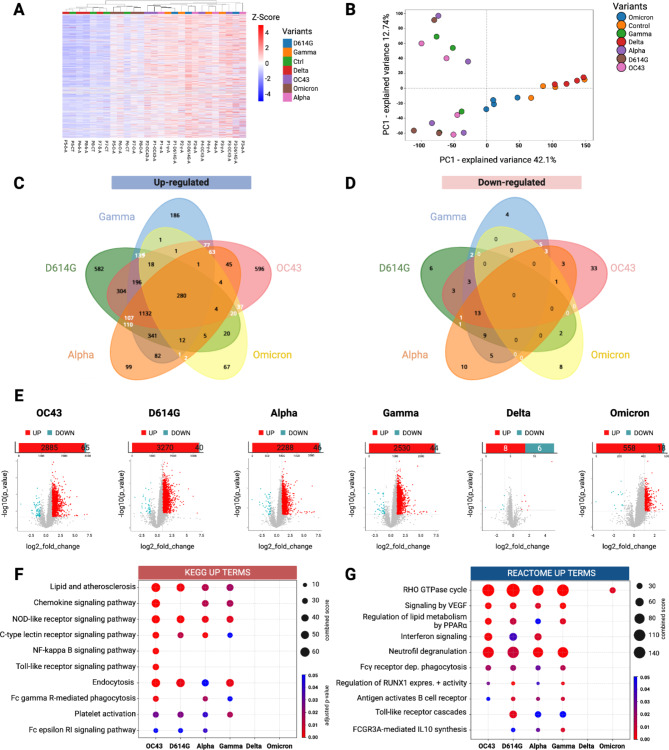
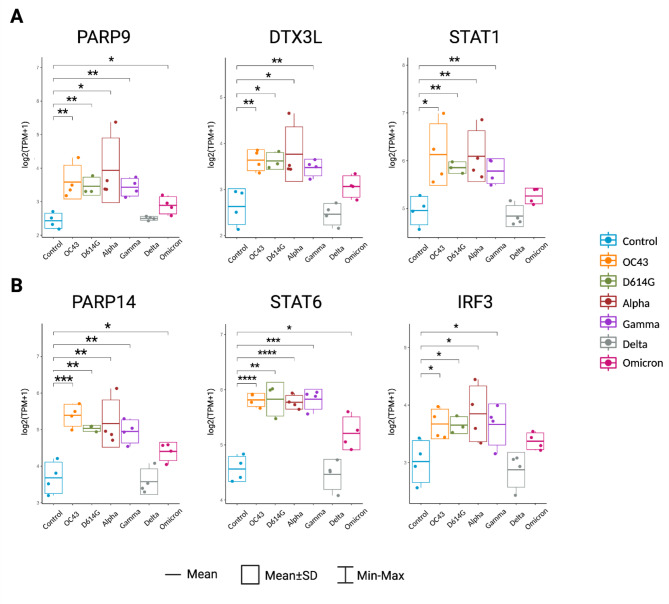
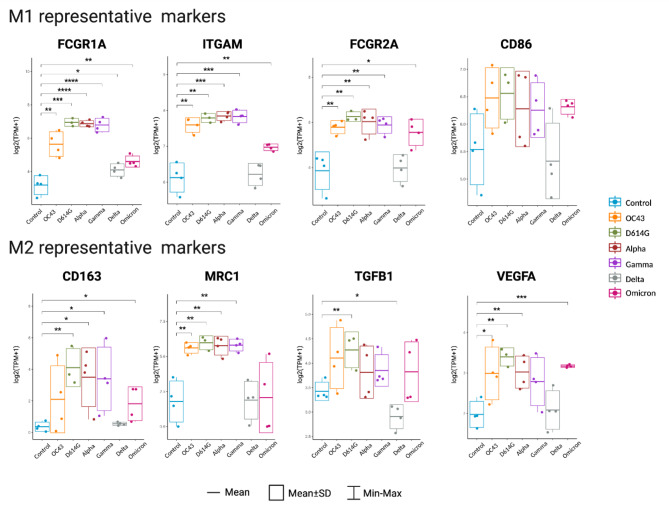
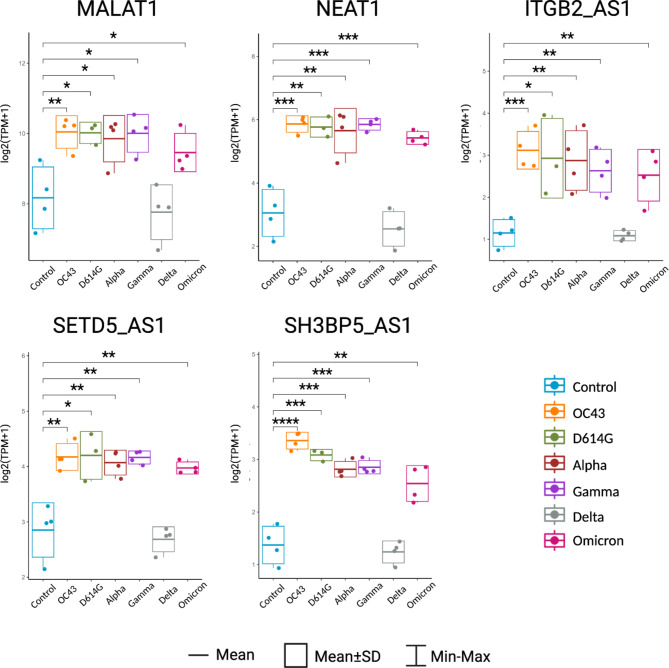
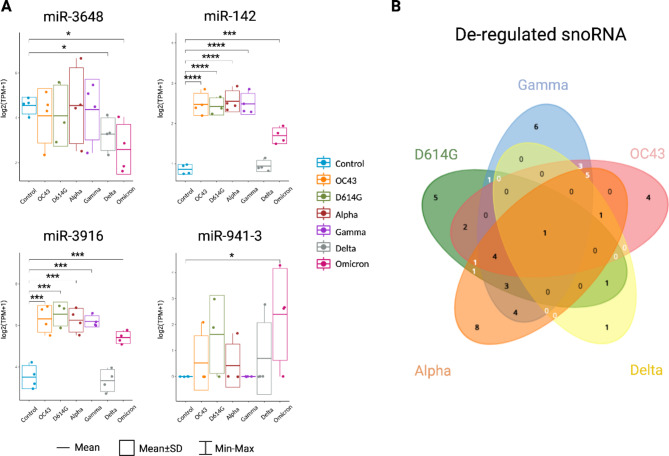
Results: After exposure to the 5 VOC of MDM, we initially assessed the presence of the viral SARS-CoV-2 transcripts to confirm viral entry. We then analysed the RNA-Seq data and observed a significant deregulation of both coding and non-coding RNAs. In particular, our RNA-Seq analysis showed a significant up-regulation of several genes involved in different immunological processes, such as PARP9/PARP14 axes, in macrophages exposed to D614G, Alpha, and Gamma variants. Surprisingly, our data showed that macrophages exposed to the Delta variant exhibited a transcriptional profile more similar to the naïve control group, while macrophages exposed to the Omicron variant showed intermediate differentially expressed genes (DEGs) between the two groups. By checking the canonical markers for M1/M2 differentiation states, we did not observe any expression in macrophages exposed to the Delta variant, suggesting an M0 status, comparable to the naïve control group. Finally, we observed a significant deregulation of 3 main types of non-coding RNAs (ncRNAs): long non-coding RNAs (lncRNAs), microRNAs (miRNAs), and small nucleolar RNAs (snoRNAs), some of which are common to coronaviruses, and some specific to SARS-CoV-2.

Conclusion: The SARS-CoV-2-dependent alteration of the transcriptome of monocyte-derived macrophage (MDM)-infected cells can be linked to the chronological order of the variants' appearance in the human population. Our data suggest an evolution of VOC in modulating the host immune response, with a strong change in pace beginning with the advent of the Delta variant. MDMs exposed to Delta showed a failure in the activation of the adaptive immune response, and this correlates with the more severe symptoms developed by people affected with this SARS-CoV-2 variant.


Conflict of interest statement

Declarations. Ethics approval and consent to participate: The study was approved (P_175_2021) by the Medical Ethics Committee of IRCCS Policlinico San Matteo of Pavia, and was conducted in accordance with the principles of the Helsinki Declaration. Written informed consent was obtained from all patients prior to enrollment. Consent for publication: Not Applicable. Competing interests: The authors declare that the research was conducted in the absence of any commercial or financial relationships that could be construed as a potential conflict of interest.

Figures

Fig. 1
Fig. 1
General workflow used in this study to characterize macrophages’ response to SARS-CoV2 exposure. Monocytes were isolated from PBMC collected from a group of immunocompetent human participants and were differentiated into macrophages. From macrophages exposed to SARS-CoV2 VOC, total RNA was extracted and used for preparation of libraries and whole transcriptome RNA-Seq analyses. This image was created using BioRender (https://www.biorender.com/)
Fig. 2
Fig. 2
Titration curves of VERO E6 cells and macrophages exposed to SARS-CoV-2 VOC. Tissue culture infective dose (TCID50) was determined for each variant in macrophages and VERO E6 cells used as positive control. Data show that all VOC were able to replicate in VERO E6 cells, while in macrophages viral proliferation was not detected. The TCID50 was calculated using the Reed–Muench method in 6 replicates, and expressed as the logarithm of virus titer
Fig. 3
Fig. 3
Nucleoprotein and Spike protein expression in macrophages exposed to SARS-CoV2 VOC. Representative immunofluorescence images of cells stained with the anti-nucleoprotein (green) and anti-spike protein (red). Nuclei were stained with DAPI (blue). Images were taken at 20X magnification for the nucleoprotein (left) and at 40X magnification for the spike protein (right). The nucleoprotein was detectable starting at 24 h (A), while the spike protein was detectable only after 96 h at higher magnification (B). The scale bar is reported in D614G exposed macrophages. (C) Fixed Gamma-exposed macrophages were coated with SARS-CoV-2 highly reactive human serum, and then stained with FITC conjugated (green) anti-hIgG antibody; nuclei were stained with DAPI (blue). Magnification 20X. The presence of viral proteins is identified by the green fluorescence. The scale bar is reported in the 24 h post-exposition panel
Fig. 4
Fig. 4
Heat map, PCA, Venn diagrams, volcano plots and bubble charts of the identified genes in macrophages exposed to OC43, D614G, Alpha, Delta, Gamma, and Omicron SARS-COV2 variants. (A-B) Heat map and PCA analyses of the 16’353 genes identified in the macrophages exposed to OC43, D614G, Alpha, Delta, Gamma, and Omicron variants and in control samples. C-D) Venn diagrams showing the total number of significantly up-regulated (C) and down-regulated (D) genes (p-value ≤ 0.05) across macrophages exposed to OC43, D614G, Alpha, Delta, Gamma, and Omicron variants. Venn diagrams were generated using the web-tool designed and maintained by A. Saurin (https://www.biotools.fr/misc/venny). E) Volcano plots showing the differentially expressed genes (DEGs, p < 0.05) in macrophages exposed to OC43, D614G, Alpha, Delta, Gamma, and Omicron variants. Red dots represent up-regulated genes, and blue dots the down-regulated genes. F) Bubble chart for KEGG pathway enrichment analysis showing 10 immunological up-regulated datasets across the different conditions. Combined scores are shown by the circle area, while the circle color represents the range of the adjusted p-value. G) Bubble chart for Reactome pathway enrichment analysis showing 10 immunological up-regulated datasets across the different conditions. Combined scores are shown by the circle area, while the circle color represents the range of the adjusted p-value. This image was created using BioRender (https://www.biorender.com/)
Fig. 5
Fig. 5
Relative gene expression of transcripts related to PARP9 and PARP14 pathways in macrophages exposed to OC43, D614G, Alpha, Delta, Gamma, and Omicron variants. A) Box plots showing the statistically differentially expressed genes of the PARP9 axis in macrophages exposed to OC43, D614G, Alpha, Delta, Gamma, and Omicron variants. B) Box plots showing the statistically differentially expressed genes of the PARP14 axis in macrophages exposed to OC43, D614G, Alpha, Delta, Gamma, and Omicron variants. Significance was calculated using Student t-tests. * p < 0.05, ** p < 0.01, *** p < 0.001, **** p < 0.0001. This image was created using BioRender (https://www.biorender.com/)
Fig. 6
Fig. 6
Relative gene expression of M1 and M2 representative markers in macrophages exposed to OC43, D614G, Alpha, Delta, Gamma, and Omicron variants. In the upper panel are shown box plots of the statistically significant M1 representative markers: FCGR1A, ITGAM, FCGR2A and CD86 genes in macrophages exposed to OC43, D614G, Alpha, Delta, Gamma, and Omicron variants. In the lower panel are shown box plots of the statistically significant M2 representative markers: CD163, MRC1, TGFB1 and VEGFA in macrophages exposed to OC43, D614G, Alpha, Delta, Gamma, and Omicron variants. Significance was calculated using Student t-tests. * p < 0.05, ** p < 0.01, *** p < 0.001, **** p < 0.0001. This image was created using BioRender (https://www.biorender.com/)
Fig. 7
Fig. 7
Relative gene expression of lncRNAs in macrophages exposed to OC43, D614G, Alpha, Delta, Gamma, and Omicron variants. Box plots showing the statistically differentially expression of the lncRNAs, MALAT1, NEAT1, ITGB2_AS1, SETD5_AS1 and SH3BP5_AS1 in macrophages exposed to OC43, D614G, Alpha, Delta, Gamma, and Omicron variants. Significance was calculated using Student t-tests. * p < 0.05, ** p < 0.01, *** p < 0.001, **** p < 0.0001. This image was created using BioRender (https://www.biorender.com/)
Fig. 8
Fig. 8
Relative gene expression of miRNAs and snoRNA in macrophages exposed to OC43, D614G, Alpha, Delta, Gamma, and Omicron variants A) Relative gene expression of miRNAs in macrophages exposed to OC43, D614G, Alpha, Delta, Gamma, and Omicron variants. B) Venn diagrams showing the total number of significantly deregulated snoRNAs (p-value ≤ 0.05) across macrophages exposed to OC43, D614G, Alpha, Delta, Gamma, and Omicron variants. The Venn diagram was generated using the web-tool designed and maintained by A. Saurin (https://www.biotools.fr/misc/venny). This image was created using BioRender (https://www.biorender.com/)

Similar articles

Cited by

References

    1. Stokes EK, Zambrano LD, Anderson KN, Marder EP, Raz KM, El Burai Felix S, et al. Coronavirus Disease 2019 Case Surveillance - United States, January 22-May 30, 2020. MMWR Morb Mortal Wkly Rep. 2020;69(24):759–65. - PMC - PubMed
    1. Walls AC, Park YJ, Tortorici MA, Wall A, McGuire AT, Veesler D. Structure, function, and Antigenicity of the SARS-CoV-2 Spike Glycoprotein. Cell. 2020;181(2):281–92. e6. - PMC - PubMed
    1. Hoffmann M, Kleine-Weber H, Schroeder S, Kruger N, Herrler T, Erichsen S, et al. SARS-CoV-2 cell entry depends on ACE2 and TMPRSS2 and is blocked by a clinically proven protease inhibitor. Cell. 2020;181(2):271–80. e8. - PMC - PubMed
    1. Sungnak W, Huang N, Becavin C, Berg M, Queen R, Litvinukova M, et al. SARS-CoV-2 entry factors are highly expressed in nasal epithelial cells together with innate immune genes. Nat Med. 2020;26(5):681–7. - PMC - PubMed
    1. Mason RJ. Thoughts on the alveolar phase of COVID-19. Am J Physiol Lung Cell Mol Physiol. 2020;319(1):L115–20. - PMC - PubMed

Supplementary concepts

LinkOut - more resources