

Machine learning for predicting severe dengue in Puerto Rico
- PMID: 39905498
- PMCID: PMC11796212
- DOI: 10.1186/s40249-025-01273-0
Machine learning for predicting severe dengue in Puerto Rico
Abstract
Background: Distinguishing between non-severe and severe dengue is crucial for timely intervention and reducing morbidity and mortality. World Health Organization (WHO)-recommended warning signs offer a practical approach for clinicians but have limited sensitivity and specificity. This study aims to evaluate machine learning (ML) model performance compared to WHO-recommended warning signs in predicting severe dengue among laboratory-confirmed cases in Puerto Rico.
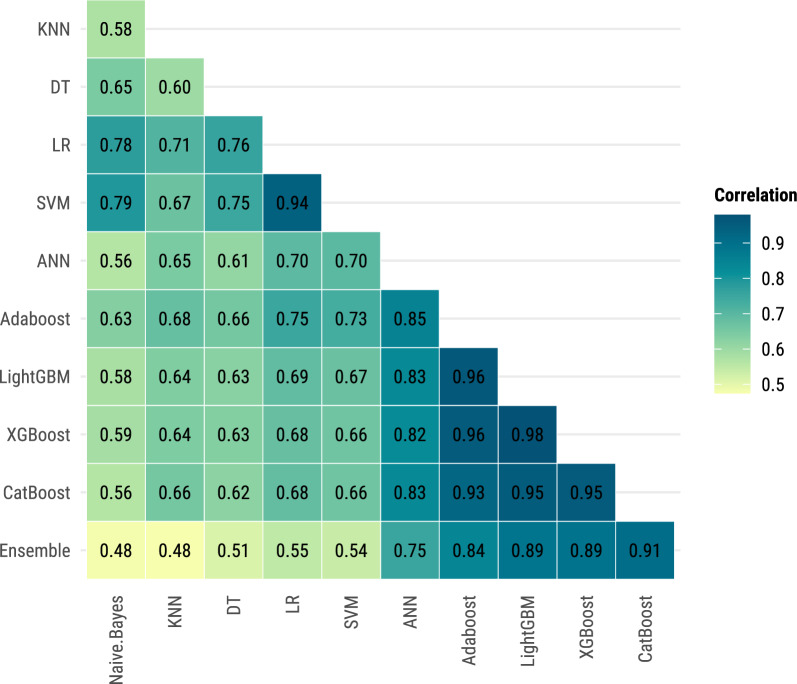
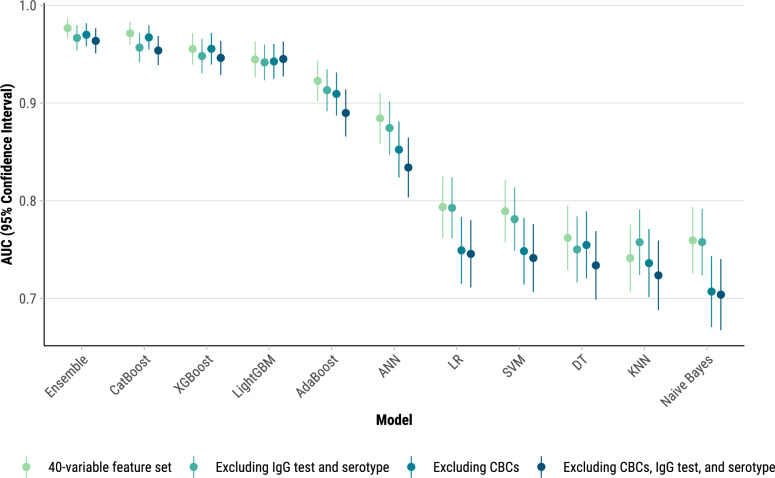
Methods: We analyzed data from Puerto Rico's Sentinel Enhanced Dengue Surveillance System (May 2012-August 2024), using 40 clinical, demographic, and laboratory variables. Nine ML models, including Decision Trees, K-Nearest Neighbors, Naïve Bayes, Support Vector Machines, Artificial Neural Networks, AdaBoost, CatBoost, LightGBM, and XGBoost, were trained using fivefold cross-validation and evaluated with area under the receiver operating characteristic curve (AUC-ROC), sensitivity, and specificity. A subanalysis excluded hemoconcentration and leukopenia to assess performance in resource-limited settings. An AUC-ROC value of 0.5 indicates no discriminative power, while values closer to 1.0 reflect better performance.
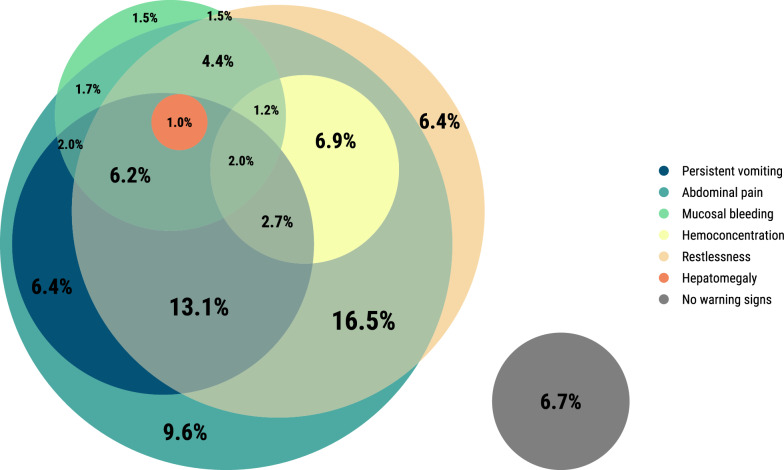
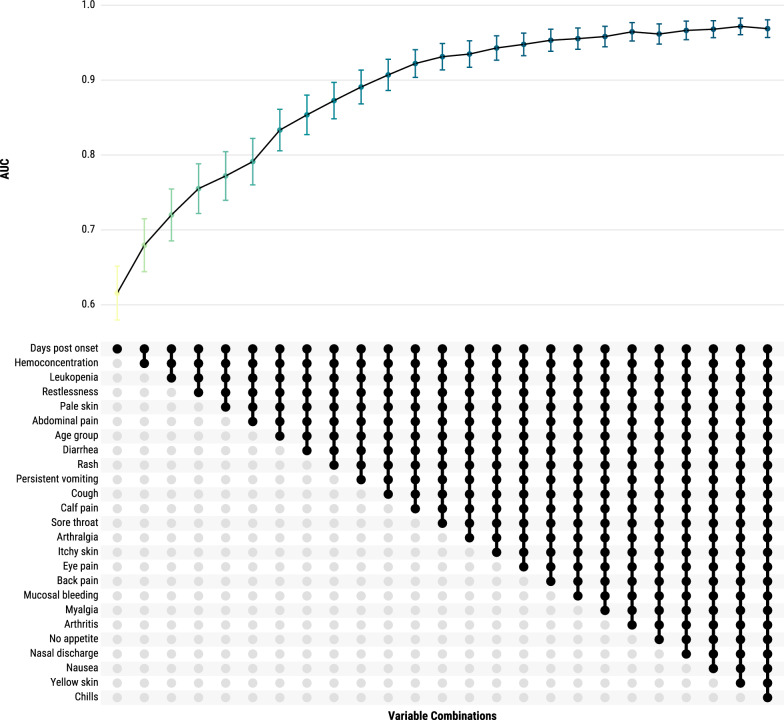
Results: Among the 1708 laboratory-confirmed dengue cases, 24.3% were classified as severe. Gradient boosting algorithms achieved the highest predictive performance, with an AUC-ROC of 97.1% (95% CI: 96.0-98.3%) for CatBoost using the full 40-variable feature set. Feature importance analysis identified hemoconcentration (≥ 20% increase during illness or ≥ 20% above baseline for age and sex), leukopenia (white blood cell count < 4000/mm3), and timing of presentation at 4-6 days post-symptom onset as key predictors. When excluding hemoconcentration and leukopenia, the CatBoost AUC-ROC was 96.7% (95% CI: 95.5-98.0%), demonstrating minimal reduction in performance. Individual warning signs like abdominal pain and restlessness had sensitivities of 79.0% and 64.6%, but lower specificities of 48.4% and 59.1%, respectively. Combining ≥ 3 warning signs improved specificity (80.9%) while maintaining moderate sensitivity (78.6%), resulting in an AUC-ROC of 74.0%.
Conclusions: ML models, especially gradient boosting algorithms, outperformed traditional warning signs in predicting severe dengue. Integrating these models into clinical decision-support tools could help clinicians better identify high-risk patients, guiding timely interventions like hospitalization, closer monitoring, or the administration of intravenous fluids. The subanalysis excluding hemoconcentration confirmed the models' applicability in resource-limited settings, where access to laboratory data may be limited.
Keywords: Caribbean; Clinical decision support; Dengue; Ensemble learning; Feature importance; Gradient boosting.
© 2025. This is a U.S. Government work and not under copyright protection in the US; foreign copyright protection may apply.
Conflict of interest statement
Declarations. Ethics approval and consent to participate: The Institutional Review Boards at the Centers for Disease Control and Prevention (CDC), Auxilio Mutuo, and Ponce Medical School Foundation approved the SEDSS study protocols 6214, and 120308-VR/2311173707, respectively. Written consent to participate was obtained from all adult participants and emancipated minors. For minors aged 14 to 20 years, written consent was obtained, and for those aged 7 to 13 years, parental written consent and participant assent were obtained. Consent for publication: Not applicable. Competing interests: The authors declare no conflict of interests.
Figures

Similar articles
-
Sentinel Enhanced Dengue Surveillance System - Puerto Rico, 2012-2022.MMWR Surveill Summ. 2024 May 30;73(3):1-29. doi: 10.15585/mmwr.ss7303a1. MMWR Surveill Summ. 2024. PMID: 38805389 Free PMC article.
-
[Constructing a predictive model for the death risk of patients with septic shock based on supervised machine learning algorithms].Zhonghua Wei Zhong Bing Ji Jiu Yi Xue. 2024 Apr;36(4):345-352. doi: 10.3760/cma.j.cn121430-20230930-00832. Zhonghua Wei Zhong Bing Ji Jiu Yi Xue. 2024. PMID: 38813626 Chinese.
-
Predicting dengue transmission rates by comparing different machine learning models with vector indices and meteorological data.Sci Rep. 2023 Nov 5;13(1):19129. doi: 10.1038/s41598-023-46342-2. Sci Rep. 2023. PMID: 37926755 Free PMC article.
-
Clinical manifestations of dengue hemorrhagic fever in Puerto Rico, 1990-1991. Puerto Rico Association of Epidemiologists.Rev Panam Salud Publica. 1997 May;1(5):381-8. doi: 10.1590/s1020-49891997000500007. Rev Panam Salud Publica. 1997. PMID: 9180059 Review.
-
Recent Advances in Dengue: Relevance to Puerto Rico.P R Health Sci J. 2015 Jun;34(2):65-70. P R Health Sci J. 2015. PMID: 26061055 Free PMC article. Review.
Cited by
-
Predicting and explaining high dead-on-arrival outcomes in meat-type ducks using deep learning: A path to improved welfare management.Poult Sci. 2025 Jun 13;104(9):105439. doi: 10.1016/j.psj.2025.105439. Online ahead of print. Poult Sci. 2025. PMID: 40541105 Free PMC article.
References
-
- Thayer MB, Marzan-Rodriguez M, Torres Aponte J, Rivera A, Rodriguez DM, Madewell ZJ, et al. Dengue epidemic alert thresholds: A tool for surveillance and epidemic detection. Medrxiv. 2024;11:9.
MeSH terms
Grants and funding
LinkOut - more resources
Full Text Sources
Medical
