. 2025 Feb 4;20(1):17.
doi: 10.1186/s13062-025-00610-5.

Fraxinellone-mediated targeting of cathepsin B leakage from lysosomes induces ferroptosis in fibroblasts to inhibit hypertrophic scar formation

Affiliations

Fraxinellone-mediated targeting of cathepsin B leakage from lysosomes induces ferroptosis in fibroblasts to inhibit hypertrophic scar formation

Wei Xu et al. Biol Direct. .

Abstract

Background: Hypertrophic scar (HS) is a common fibrotic skin disorder characterized by the excessive deposition of extracellular matrix (ECM). Fibroblasts are the most important effector cells involved in HS formation. Currently no satisfactory treatment has been developed.

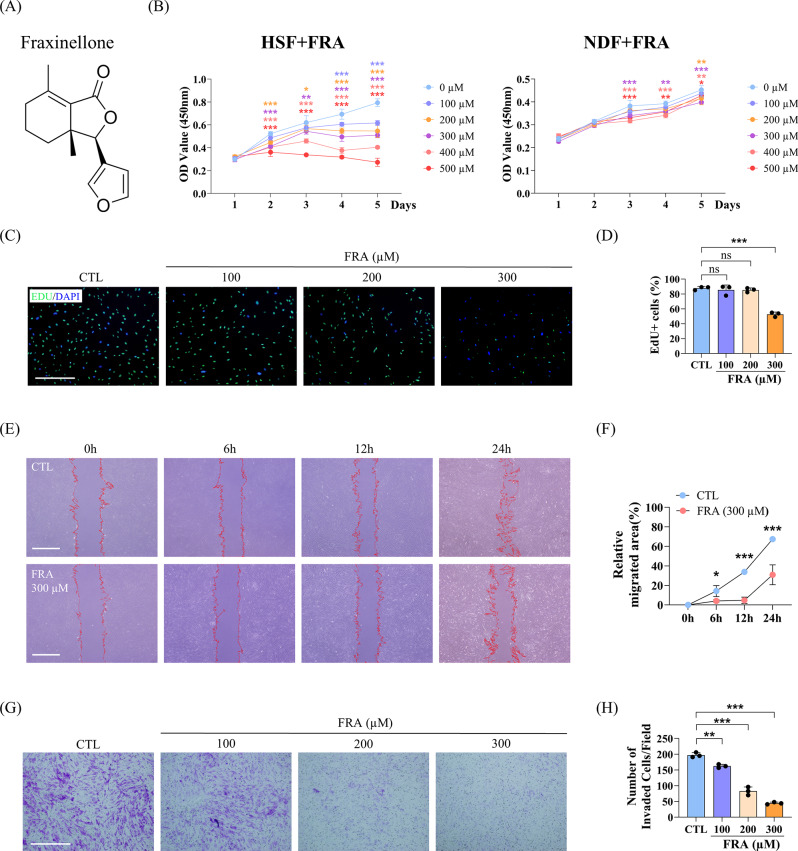
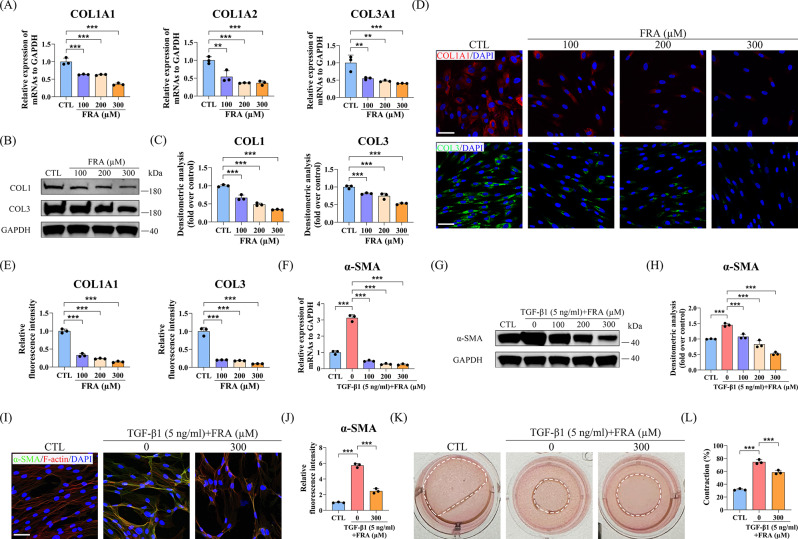
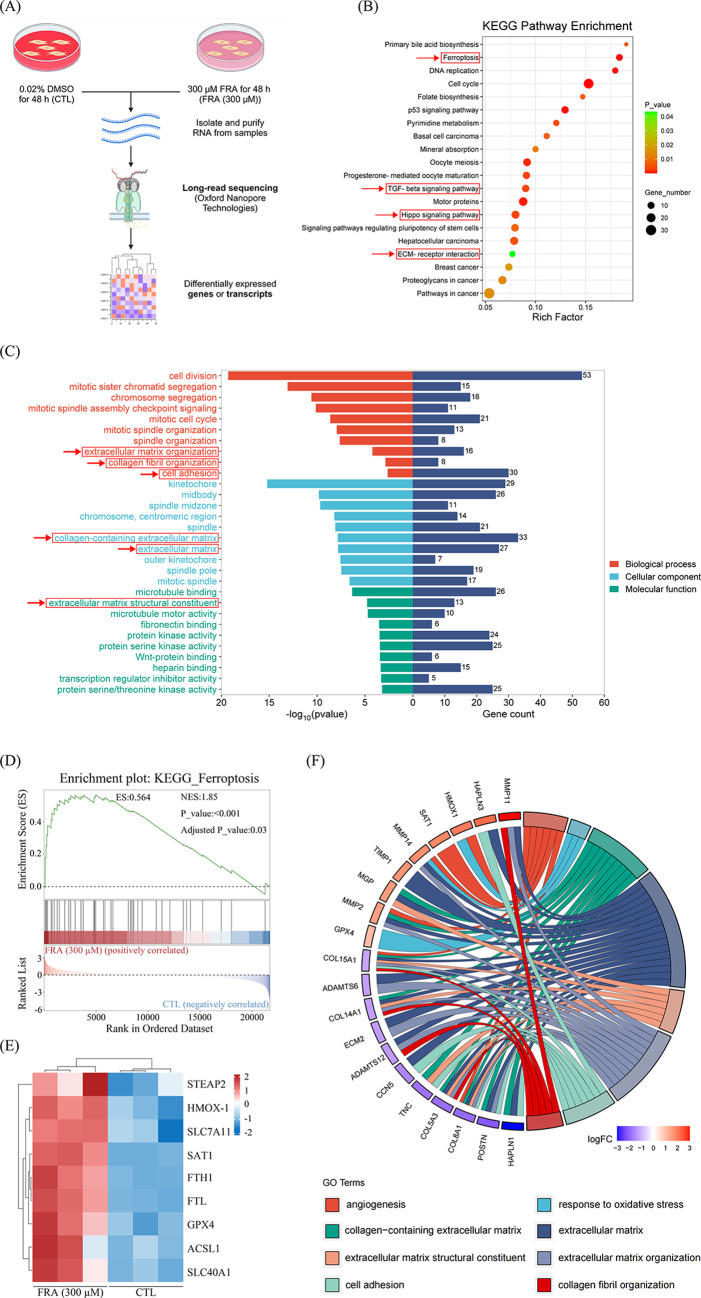
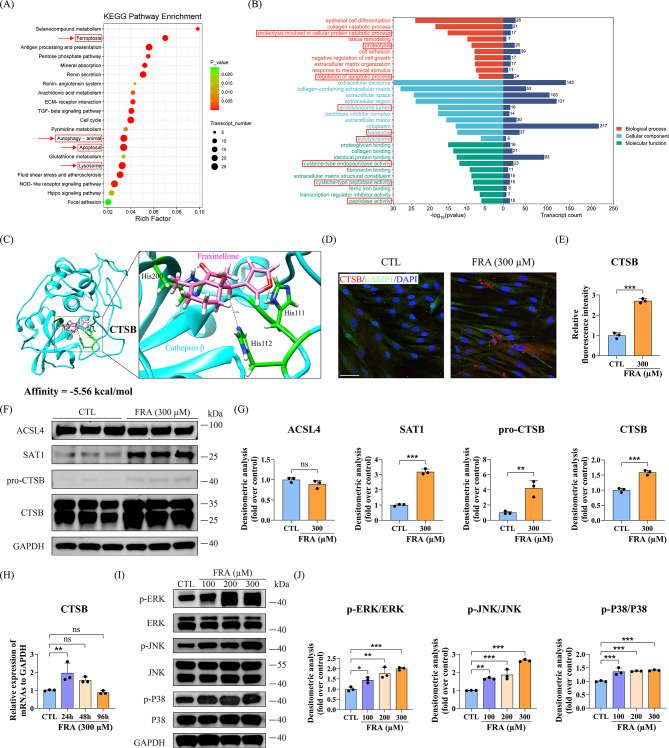
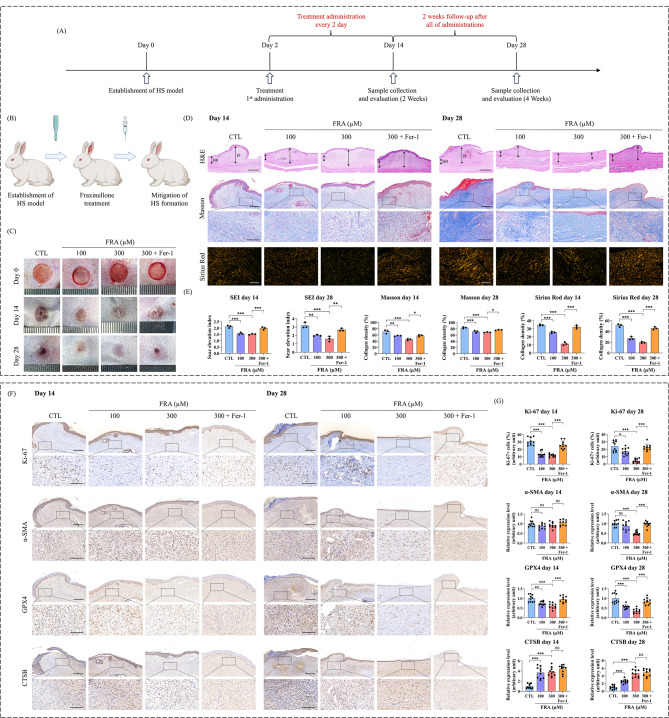
Methods: The impact of fraxinellone (FRA) on the proliferation and migration capacity of human hypertrophic scar-derived fibroblasts (HSFs) was assessed by EdU proliferation, wound healing and transwell assays. Quantitative real-time PCR (qRT‒PCR), Western blot (WB), immunofluorescence staining and collagen gel contraction assays were performed to evaluate the collagen production and activation capacity of HSFs. Oxford Nanopore Technologies long-read RNA sequencing (ONT long-read RNA-seq) revealed the occurrence of ferroptosis in HSF and ferroptosis executioner-cathepsin B (CTSB). The mechanisms underlying FRA-induced HSF ferroptosis were examined through fluorescence staining, qRT‒PCR, WB and molecular docking study. The therapeutic efficacy of FRA was further validated in vivo using a rabbit ear scar model.

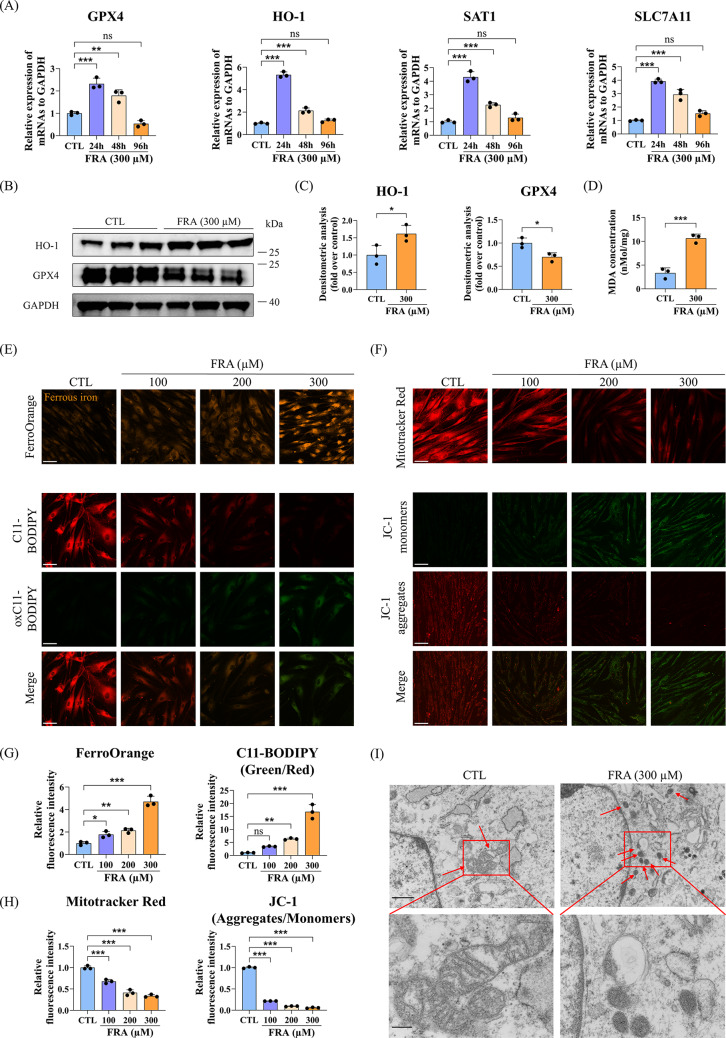
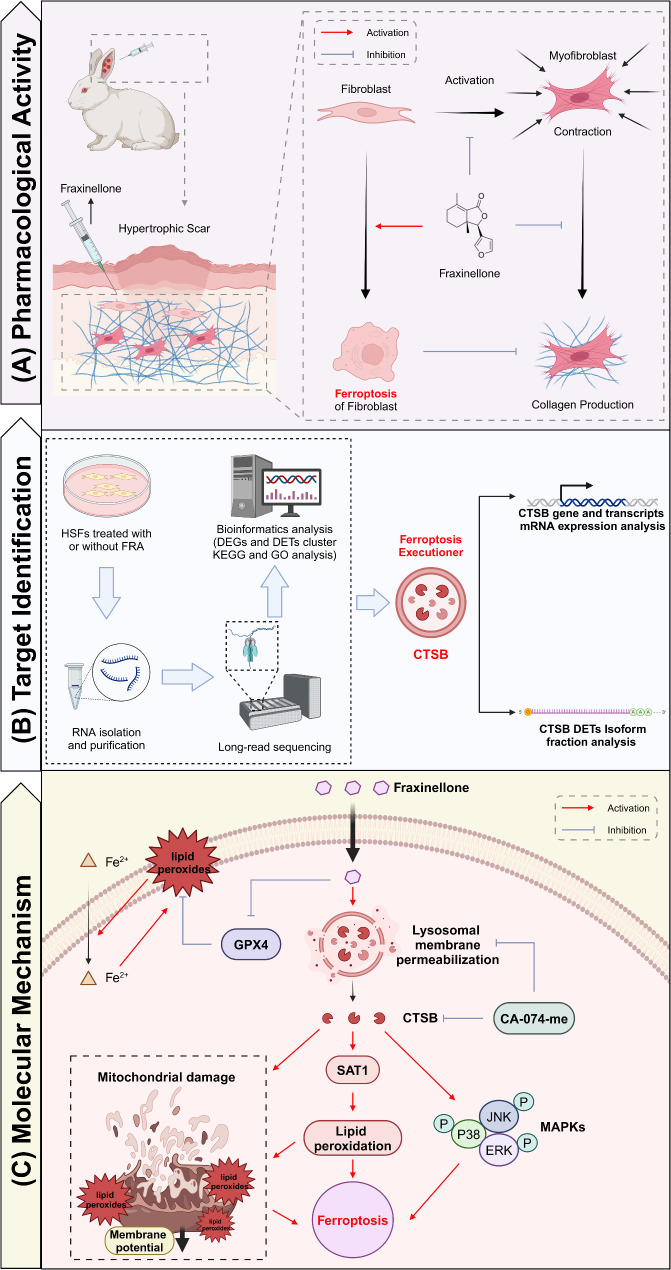
Results: FRA treatment significantly suppressed the proliferation, migration, collagen production and activation capacity of HSFs. ONT long-read RNA-seq discovered that FRA modulated the expression of transcripts related to ferroptosis and lysosomes. Mechanistically, FRA treatment reduced the protein expression level of glutathione peroxidase 4 (GPX4) and induced the release of CTSB from lysosomes into the cytoplasm. CTSB further induced ferroptosis via spermidine/spermine-N1-acetyltransferase (SAT1)-mediated lipid peroxidation, mitochondrial damage and mitogen-activated protein kinase (MAPK) signalling pathway activation, eventually affecting the function of HSFs. Moreover, FRA treatment attenuated the formation of HS in rabbit ears via CTSB-mediated ferroptosis. The antifibrotic effects of FRA were abrogated by pretreatment with a CTSB inhibitor (CA-074-me).

Conclusions: This study reveals that FRA ameliorates HS by inducing CTSB leakage from lysosomes, causing SAT1-mediated lipid peroxidation, mitochondrial damage and MAPK signalling pathway activation, thus mediating HSF ferroptosis. Therefore, FRA could be a promising therapeutic agent for treating HS.

Keywords: Cathepsin B; Ferroptosis; Fraxinellone; Hypertrophic scar; Long-read sequencing.


Conflict of interest statement

Declarations. Ethics approval and consent to participate: HS and normal skin samples were collected from patients at the Department of Plastic and Reconstructive Surgery, Shanghai Ninth People’s Hospital. Written informed consent was obtained from patients or their legal guardians in accordance with the Declaration of Helsinki and it was approved by the Human Research Ethics Committee of Shanghai Jiao Tong University School of Medicine affiliated ninth people’s hospital (SH9H-2022-T143-2). None of the patients had received any treatment prior to surgery. The animal experiments were approved by the Animal Ethical Committee of Shanghai Jiao Tong University Nongsheng Biotechnology Co., Ltd. (JDLL 20230908-1). Consent for publication: Not applicable. Competing interests: The authors declare no competing interests.

Figures

Fig. 1
Fig. 1
FRA suppressed the proliferation and migration of HSFs in vitro. (A) Chemical structure diagram of FRA. (B) HSFs and NDFs were treated with different concentrations of FRA for different durations and evaluated by a CCK-8 assay (n = 4). (C) EdU (green) proliferation assay for HSFs after incubation with various concentrations of FRA (100 µM, 200 µM and 300 µM) for 48 h (scale bar = 200 μm). (D) Quantitative analysis of EdU-positive cells. (E) Representative images of the wound healing assay of HSFs treated with or without FRA (300 µM) for 0, 6, 12 and 24 h (scale bar = 200 μm). The red lines indicate the wound boundaries. (F) The quantitative results are presented as the relative migration area, with 0% applied to the area measured at 0 h. (G) Representative images of the transwell assay of HSFs after treatment with FRA for 48 h (scale bar = 200 μm). (H) Quantitative results of the number of invaded cells per field. The data are shown as means ± SDs (n = 3 independent experiments unless otherwise specified). *P < 0.05, **P < 0.01, ***P < 0.001, ns = not significant
Fig. 2
Fig. 2
FRA affected collagen metabolism and HSFs activation in vitro. (A) qRT‒PCR results of the mRNA levels of COL1A1, COL1A2 and COL3A1 in HSFs after treatment with FRA (100 µM, 200 µM and 300 µM) for 48 h. GAPDH served as the control. (B) The protein levels of COL 1 and COL 3 in HSFs incubated with FRA for 48 h were determined by WB analysis. (C) Quantification of COL 1 and COL 3 expression based on WB analysis. (D) Immunofluorescence staining for COL1A1 and COL3 in HSFs after treatment with FRA for 48 h (scale bar = 50 μm). (E) The statistical results of the relative fluorescence intensity of COL1A1 and COL3. (F) α-SMA mRNA expression in HSFs after incubation with TGF-β1 (5 ng/ml) and different concentrations of FRA (0 µM, 100 µM, 200 µM and 300 µM) for 48 h was determined by qRT‒PCR. (G) WB analysis of α-SMA expression in HSFs subjected to the indicated treatments for 48 h. (H) Quantification of the α-SMA protein level based on WB analysis. (I) Immunofluorescence staining for α-SMA and F-actin in HSFs treated with TGF-β1 (5 ng/ml) and FRA (0 µM or 300 µM) for 48 h (scale bar = 50 μm). (J) Quantification of the relative fluorescence intensity of α-SMA. (K) Representative images of the collagen gel contraction assay in different treatment groups on day 3. The dashed white lines indicate the areas of collagen gel. (L) Quantitative results of the collagen gel contraction assay. The data are presented as means ± SDs (n = 3 independent experiments). **P < 0.01, ***P < 0.001
Fig. 3
Fig. 3
FRA activated ferroptosis in HSFs. (A) Schematic illustration of the experimental design and the process of HSFs preparation for ONT long-read RNA-seq. (B) KEGG pathway enrichment analysis of the DEGs between the CTL and FRA (300 µM for 48 h)-treated groups. The red boxes indicate the signalling pathways of interest. (C) GO analysis of the DEGs in different groups. The red boxes indicate the signalling pathways of interest. (D) GSEA plot of the ferroptosis pathway based on ONT long-read RNA-seq. (E) Heatmap of ferroptosis-related DEGs between the CTL and FRA-treated groups. Red: high expression levels. Blue: low expression levels. (F) Chord graph of the relationships between the DEGs and enrichment pathways
Fig. 4
Fig. 4
FRA affected HSFs behaviour by inducing ferroptosis. (A) The mRNA levels of GPX4, HO-1, SAT1 and SLC7A11 in HSFs treated with FRA (300 µM) for 24, 48 and 96 h were measured using qRT‒PCR. GAPDH was used as the internal reference gene. (B) WB results of the expression of GPX4 and HO-1 in HSFs incubated with or without FRA (300 µM) for 48 h. (C) Statistical analysis of the relative protein expression of GPX4 and HO-1 in HSFs. (D) MDA levels in different groups at 48 h were quantitatively evaluated by an MDA assay kit. (E) HSFs were treated with FRA (100 µM, 200 µM and 300 µM) for 48 h. Representative images of FerroOrange staining (scale bar = 50 μm) and C11-BODIPY staining (scale bar = 50 μm). (F) Representative images of MitoTracker staining (scale bar = 50 μm) and JC-1 staining (scale bar = 50 μm). Quantitative analysis of the relative fluorescence intensity of ferrous iron, lipid peroxide (G), MitoTracker Red area and the aggregate/monomer ratio (H). (I) TEM images of the mitochondrial ultrastructure in HSFs treated with or without FRA for 48 h (scale bar = 1 μm for the upper images; scale bar = 250 nm for the lower images). The results are expressed as the means ± SDs (n = 3 independent experiments). *P < 0.05, **P < 0.01, ***P < 0.001, ns = not significant
Fig. 5
Fig. 5
CTSB was identified as a crucial gene in FRA-induced HSFs ferroptosis. (A) KEGG pathway enrichment analysis of the DETs between the CTL and FRA (300 µM for 48 h)-treated groups. The red boxes indicate the signalling pathways of interest. (B) GO analysis of the DETs in different groups. The red boxes indicate the signalling pathways of interest. (C) Structural model of CTSB complexed with FRA. In the close-up view, the hydrogen bonds formed between the compound and the protein are depicted as dashed black lines, and the His111, His112, and His200 residues are involved in hydrogen bond interactions. (D) Immunofluorescence staining of CTSB and LAMP1 in HSFs incubated with or without FRA for 48 h (scale bar = 50 μm). (E) Quantification of the relative fluorescence intensity of CTSB. (F) The protein levels of ACSL4, SAT1, pro-CTSB and CTSB in HSFs treated with or without FRA for 48 h were analysed by WB. (G) Quantification of ACSL4, SAT1, pro-CTSB and CTSB protein levels based on WB analysis. (H) The mRNA expression of CTSB in HSFs treated with FRA (300 µM) for 24, 48 and 96 h was measured by qRT‒PCR. GAPDH was used as the internal reference gene. (I) WB analysis of the levels of MAPK signalling pathway proteins, including p-ERK/ERK, p‐JNK/JNK and p‐p38/p38, in HSFs treated with various concentrations of FRA (100 µM, 200 µM and 300 µM) for 48 h. (J) The p‐ERK/ERK, p‐JNK/JNK and p‐p38/p38 protein ratios were quantified based on WB analysis. The results are expressed as the means ± SDs (n = 3 independent experiments). *P < 0.05, **P < 0.01, ***P < 0.001, ns = not significant
Fig. 6
Fig. 6
FRA alleviated HS formation through ferroptosis in vivo. (A) Schedule of the different stages of the in vivo study. (B) Experimental schematic of FRA mitigated scar formation in a rabbit ear HS model. (C) Images of the wounds and the scars formed on day 0, 14 and 28 after treatment with various concentrations of FRA (100 µM and 300 µM) or FRA (300 µM) plus Fer-1 (2 µM) (scale bar = 18 mm). (D) Representative H&E staining, Masson Trichrome staining, and Sirius Red staining images of the wounds and the scars formed on day 14 and day 28 after different treatments. Scale bar, 1 mm in H&E staining images, 500 μm in Masson Trichrome staining images (top), 200 μm in Masson Trichrome staining images (enlarged) and 100 μm in Sirius Red staining images. (E) Quantification of the SEI, collagen density (%) based on Masson Trichrome staining and collagen density (%) based on Sirius Red staining on day 14 and day 28. (F) Immunohistochemical staining of Ki-67, α-SMA, GPX4 and CTSB on day 14 and day 28 after different treatments. Scale bar, 500 μm in the top images and 200 μm in the enlarged images. (G). Quantification of Ki-67-positive cells and relative expression levels of α-SMA, GPX4 and CTSB on day 14 and day 28 (n = 10, arbitrary units). The results are presented as the means ± SDs (n = 3 independent experiments unless otherwise specified). *P < 0.05, **P < 0.01, ***P < 0.001, ns = not significant
Fig. 7
Fig. 7
CTSB inhibition attenuated the effect of FRA on HSFs ferroptosis in vitro. (A) Immunofluorescence staining of CTSB and LAMP1 in HSFs pretreated with or without CA-074-me (20 µM) for 2 h and then incubated with FRA (300 µM) for 48 h (scale bar = 50 μm). (B) Quantification of the relative fluorescence intensity of CTSB. (C) The protein levels of Pro-CTSB, CTSB, ACSL4, SAT1 and GPX4 under the indicated treatments were determined by WB. (D) The mRNA levels of SAT1 and CTSB in HSFs subjected to the indicated treatments were determined by qRT‒PCR. GAPDH was used as the internal reference gene. (E) MDA concentration in HSFs under the indicated treatments was assessed using an MDA assay kit. (F) Representative images of FerroOrange staining (scale bar = 50 μm) and C11-BODIPY staining (scale bar = 50 μm) in different treatment groups. (G) Quantitative analysis of the relative fluorescence intensity of ferrous iron and lipid peroxide. (H) Representative images of MitoTracker staining (scale bar = 50 μm) and JC-1 staining (scale bar = 50 μm). (I) Quantitative analysis of the relative fluorescence intensity of the MitoTracker Red area and the aggregate/monomer ratio. (J) Representative images of the collagen gel contraction assay of HSFs under the indicated treatments on day 3. The dashed white lines indicate the areas of collagen gel. (K) Quantitative results of the collagen gel contraction assay. (L) WB results of the expression of α-SMA, COL1 and COL3 in HSFs after the indicated treatments. The results are expressed as the means ± SDs (n = 3 independent experiments). *P < 0.05, **P < 0.01, ***P < 0.001
Fig. 8
Fig. 8
Schematic illustration of the study. (A) FRA affects fibroblasts behaviour by inducing ferroptosis to ameliorate hypertrophic scar. (B) ONT long-read RNA-seq reveals that FRA induces ferroptosis of fibroblasts by CTSB. (C) FRA can mediate CTSB leakage from lysosomes in fibroblasts, and CTSB induces ferroptosis via SAT1-mediated lipid peroxidation, mitochondrial damage and MAPK signalling pathway activation. Schematic plots were created in BioRender.com

Similar articles

Cited by

References

    1. Jeschke MG, Wood FM, Middelkoop E, Bayat A, Teot L, Ogawa R, Gauglitz GG, Scars. Nat Rev Dis Primers. 2023;9(1):64. - PubMed
    1. Finnerty CC, Jeschke MG, Branski LK, Barret JP, Dziewulski P, Herndon DN. Hypertrophic scarring: the greatest unmet challenge after burn injury. Lancet. 2016;388(10052):1427–36. - PMC - PubMed
    1. Lv K, Xia Z. Chinese consensus panel on the p, treatment of s: Chinese expert consensus on clinical prevention and treatment of scar(). Burns Trauma. 2018;6:27. - PMC - PubMed
    1. Zhao B, Guo W, Zhou X, Xue Y, Wang T, Li Q, Tan LL, Shang L. Ferroptosis-Mediated Synergistic Therapy of Hypertrophic Scarring Based on Metal–Organic Framework Microneedle Patch. Adv Funct Mater. 2023;33(27).
    1. Shook BA, Wasko RR, Rivera-Gonzalez GC, Salazar-Gatzimas E, Lopez-Giraldez F, Dash BC, Munoz-Rojas AR, Aultman KD, Zwick RK, Lei V et al. Myofibroblast proliferation and heterogeneity are supported by macrophages during skin repair. Science. 2018;362(6417). - PMC - PubMed

LinkOut - more resources