. 2025 Mar 4;124(5):818-828.
doi: 10.1016/j.bpj.2025.01.024. Epub 2025 Feb 3.

Temperature dependence of membrane viscosity of ternary lipid GUV with Lo domains

Affiliations

Temperature dependence of membrane viscosity of ternary lipid GUV with Lo domains

Julia Tanaka et al. Biophys J. .

Abstract

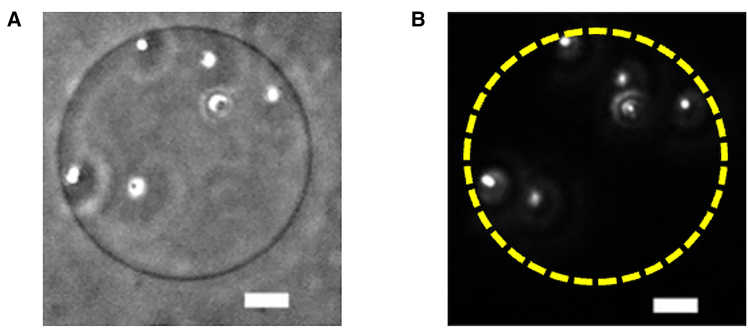
In the cell membrane, it is considered that saturated lipids and cholesterol organize liquid-ordered (Lo) domains in a sea of liquid-disordered (Ld) phases and proteins relevant to cellular functions are localized in the Lo domains. Since the diffusion of transmembrane proteins is regulated by the membrane viscosity, we investigate the temperature dependence of the membrane viscosity of the ternary giant unilamellar vesicles (GUVs) composed of the saturated lipid 1,2-dipalmitoyl-sn-glycero-3-phosphocholine, the unsaturated lipid 1,2-dioleoyl-sn-glycero-3-phosphocholine (DOPC), and cholesterol to understand the effect of the phase separation on the membrane viscosity using a microinjection technique. In the microinjection method, membrane viscosity is estimated by comparing the flow pattern induced on a spherical membrane with a hydrodynamic model. For phase-separated GUVs, the flow pattern is visualized by the motion of the domains. In this study, we developed a method to visualize the flow patterns of homogeneous GUVs above the phase separation temperature by using beads attached to the GUVs. We succeeded in measuring the membrane viscosity of ternary GUVs both above phase separation temperature and in the phase-separated region and found that the membrane viscosity decreases dramatically by phase separation. In the phase-separated region, i.e., GUVs with Lo domains, the membrane viscosity is determined by that of the Ld phase, ηLd, and shows weak temperature dependence compared to that of the DOPC single-component GUV, which is a main component of the Ld phase. We revealed that the Moelwyn-Hughest model, which takes into account the effects of the membrane composition, viscosity of the pure component, and interaction between components, well describes the obtained membrane viscosity of the ternary GUV both above the phase separation temperature and in the phase-separated region. The drastic decrease of the membrane viscosity by the phase separation plays an important role in regulating the mobility of constituents in multi-component membranes.


Conflict of interest statement

Declaration of interests The authors declare no competing interests.

Figures

Figure 1
Figure 1
Microscope images of the beads adhered on a GUV. (A) Phase contrast image. (B) Fluorescence image. The broken circle denotes the contour of the GUV. Scale bars represent 10 μm.
Figure 2
Figure 2
Snapshots of raw (top row) and analyzed (bottom) data. A vortex flow is induced by microinjection. A domain indicated by an arrow draws the smallest path line. In the analyzed data, the contour of the domains is indicated by a yellow line, and the domain trajectory is denoted by a light blue line. The vortex center is estimated from the smallest path line. Scale bars represent 10 μm.
Figure 3
Figure 3
The flow field visualized by a bead attached onto the GUV membrane (A) and by a domain formed by phase separation (B). The membrane viscosity measurement was performed with the same GUV composed of DPPC/DOPC/CHOL = 30:50:20 at 13°C. Scale bars represent 10 μm.
Figure 4
Figure 4
Membrane viscosity of the GUV. (A) GUV compositions in which membrane viscosity measurement was performed. The green square, yellow diamond, and red circle indicate compositions DPPC/DOPC/CHOL= (a) 40:40:20, (b) 30:50:20, and (c) 20:60:20, respectively. The dashed line denotes the boundary of the Ld-Lo coexistence region at 20°C taken from (17). Violet, blue, green, and orange lines are the tie lines through composition a at 19°C, 23°C, 27°C, and 32°C, respectively, obtained by SANS measurements (see supporting material S3). Inset: microscope images of the GUVs at 20°C with compositions a, b, and c from right to left. Scale bars represent 10 μm. (B) Temperature dependence of ηm,mix of the GUV with compositions a, b, and c and that of ηm,demix, as well as that of ηDPPC/DOPC and ηDOPC. Squares, diamonds, and circles indicate the membrane viscosity of GUVs with compositions a, b, and c, respectively. Up triangles and down triangles denote the membrane viscosity of the GUVs composed of DPPC/CHOL and DOPC, respectively. Dashed lines are drawn to guide the eye. The temperature dependence of ηDOPC has a steep slope compared to the other compositions. The error bars express mean ± SE.
Figure 5
Figure 5
Membrane viscosity of the GUV with Lo domains. (A) The phase diagram of DPPC/DOPC/CHOL ternary system at 20°C. Cross symbols denote compositions DPPC/DOPC/CHOL = (i) 20/60/20, (ii) 27/53/20, and (iii) 37.5/37.5/25 on the same tie line indicated by a solid line. The dashed line denotes the boundary of the Ld-Lo coexistence region at 20°C taken from (17). The red circle indicates the composition DPPC/DOPC/CHOL = 12:70:18, which is in a single phase. Inset: microscope image of the GUV with composition i. Scale Bar represents 10 μm. (B) ΦLo dependence of the membrane viscosity of the GUVs composed of DPPC/DOPC/CHOL, which are on the same tie line at 20°C. The dashed line denotes the fitting curve expressed by ηm,demix=ηLd(1+εΦLo). The fitting gives ηLd=7.9±0.2 nPa · s · m and ε=2.0±0.1. The error bars express mean ± SE.
Figure 6
Figure 6
Relation between domain radius, Rd, and apparent membrane viscosity for composition a at 23°C. There is no correlation between the domain radius and the apparent membrane viscosity at the same composition and temperature. Error bars express mean ± SE.
Figure 7
Figure 7
ηLds for compositions a, b, and c, ηDOPC, and ηDPPC/CHOL=1:1 as a function of the temperature. Solid lines denote the fitting results by ηLd=Aexp(B/Tabs), where A is the numerical constant, B is the slope of the temperature dependence of membrane viscosity, and Tabs is the absolute temperature. The temperature dependence of ηDOPC has a steep slope compared to the other compositions. The black solid line and dashed line denote the calculated ηLd by simply taking the weighted average of the DPPC/CHOL complex and DOPC and the MH model, respectively. The error bars express mean ± SE.

References

    1. Simons K., Ikonen E. Functional rafts in cell membranes. Nature. 1997;387:569–572. - PubMed
    1. Simons K., Toomre D. Lipid rafts and signal transduction. Nat. Rev. Mol. Cell Biol. 2000;1:31–39. - PubMed
    1. Tsui-Pierchala B.A., Encinas M., et al. Johnson E.M., Jr. Lipid rafts in neuronal signaling and function. Trends Neurosci. 2002;25:412–417. - PubMed
    1. Deans J.P., Li H., Polyak M.J. CD20-mediated apoptosis: signaling through lipid rafts. Immunology. 2002;107:167–182. - PMC - PubMed
    1. Edidin M. The state of lipid rafts: from model membranes to cells. Annu. Rev. Biophys. Biomol. Struct. 2003;32:257–283. - PubMed

MeSH terms

LinkOut - more resources