. 2025 Jan 28;2(1):ugaf001.
doi: 10.1093/narmme/ugaf001. eCollection 2025 Jan.

Combining CRISPR activation and interference capabilities using dCas9 and G-quadruplex structures

Affiliations

Combining CRISPR activation and interference capabilities using dCas9 and G-quadruplex structures

Mohammad Lutful Kabir et al. NAR Mol Med. .

Abstract

We demonstrate that both Clustered regularly interspaced short palindromic repeats (CRISPR) interference and CRISPR activation can be achieved at RNA and protein levels by targeting the vicinity of a putative G-quadruplex (GQ)-forming sequence (PQS) in the c-Myc promoter with nuclease-dead Cas9 (dCas9). The achieved suppression and activation in Burkitt's Lymphoma cell line and in in vitro studies are at or beyond those reported with alternative approaches. When the template strand (contains the PQS) was targeted with CRISPR-dCas9, the GQ was destabilized and c-Myc mRNA and protein levels increased by 2.1- and 1.6-fold, respectively, compared to controls in the absence of CRISPR-dCas9. Targeting individual sites in the nontemplate strand (NTS) with CRISPR-dCas9 reduced both the c-Myc mRNA and protein levels (by 1.8- and 2.5-fold, respectively), while targeting two sites simultaneously further suppressed both the mRNA (by 3.6-fold) and protein (by 9.8-fold) levels. These were consistent with cell viability assays when single or dual sites in the NTS were targeted (1.7- and 4.7-fold reduction in viability, respectively). We also report extensive in vitro biophysical studies which are in quantitative agreement with these cellular studies and provide important mechanistic details about how the transcription is modulated via the interactions of RNA polymerase, CRISPR-dCas9, and the GQ.


Conflict of interest statement

None declared.

Figures

Graphical Abstract
Graphical Abstract
Figure 1.
Figure 1.
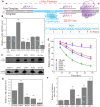
Experiments in which the vicinity of PQS was targeted with CRISPR–dCas9 in Burkitt’s lymphoma cells (Ramos cells). (A) Schematic of the DNA construct and CRISPR–dCas9 target sites 1–4 on the template and NTSs. The PQS and the G-tracts are indicated in the schematic. The binding site for transcription factor SP1 is indicated with red bases. (B) RT-qPCR studies illustrating suppression and elevation of c-Myc RNA levels. RNP2 + 3 refers to targeting sites 2 and 3 simultaneously. (C and D) Image of western blot and quantitation of c-Myc protein levels. (E and F) Cell viability studies in cells targeted with RNP1, RNP2, RNP3, RNP1 + RNP2, or with RNP2 + RNP3. The symbols are data points and lines are Hill function fit to the respective data. Due to small level of inhibition in cell viability in the TR-only (in the absence CRISPR–dCas9 targeting) and RNP1 cases, the data could not be fitted reliably. (F) The relative cell inhibition is quantified with respect to the TR-only case after 48 h of introducing CRISPR–dCas9 to the cells. In (B, C, and F), the bars represent the average values of at least three measurements and the error bars are the standard errors associated with these measurements. The ** symbol in (B), D), and (F) indicates a statistically significant difference compared to TR-only case with P< .01.
Figure 2.
Figure 2.
Schematic of in vitro transcription assay. (A) DNA construct indicating the relative positions of the RNAP promoter, the PQS, and one of the dCas9 target sites. (B) In the absence of any blockade, RNAP completes the transcription of DNA, resulting in a full-length RNA product. (C and D) GQ and CRISPR–dCas9 could stall RNAP progression, resulting in truncated RNA products.
Figure 3.
Figure 3.
In vitro fluorescence beacon assays. (A and B) Schematic of the assay. The beacon strands contain a fluorophore (Cy3 or Cy5) at one end and a broadband quencher at the other. When free in solution, the fluorescence signal is quenched due to proximity of the fluorophore and quencher. The Cy3/Cy5 beacon strand is complementary to an RNA sequence upstream/downstream of PQS and the dCas9 target sites. The fluorophore and the quencher separate from each other when the beacon strands bind to the complementary RNA, which results in emission of fluorescence signal. (C, D, F, and G) Cy3 and Cy5 fluorescence emission intensities as a function of time for the WT (contains the PQS) and GQ-mutant (PQS is mutated) DNA construct, respectively. The circles around the lines are the data points obtained from five independent measurements and the lines are the average of these measurements. (E and H) The ratio of Cy5/Cy3 intensities at saturation (the average of last 10 points before 120 min) for the WT and GQ-mutant constructs, respectively. The bars are the average of five measurements and the error bars are the standard error. The ** symbol in (E) and (H) indicates a statistically significant difference compared to TR-only case with P< .01.
Figure 4.
Figure 4.
The schematic of a model representing different modes of collision between RNAP and dCas9. (A) When dCas9 targets the TS, RNAP, and dCas9 collide in a PAM-distal mode in which RNAP is more likely to dislodge dCas9 and proceed with transcription. (B) When dCas9 targets the NTS, RNAP and dCas9 collide in a PAM-proximal mode in which RNAP is more likely to be stalled or dislodged from the DNA, both resulting in a truncated RNA transcript.
Figure 5.
Figure 5.
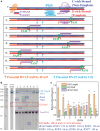
Gel electrophoresis measurements analyzing the products of an in vitro transcription assay (RNAP stop assay). (A) Schematic of the DNA construct that includes a T7 RNAP promoter, PQS, and dCas9 target sites. The PQS and dCas9 target sites are downstream of RNAP promoter; therefore, stalling of the RNAP at these sites results in truncated RNA transcripts. In the schematic below, the seven dCas9 target sites are indicated, in addition to GQ stall sites (cyan arrows) and dCas9 stall sites (red arrows). The expected RNA transcripts corresponding to these stalls are listed on the right (under (C)). (B) Gel image showing the products of the in vitro transcription assay. GQ stalls are indicated with a red rectangle and dCas9 stalls are indicated with dark blue rectangles. The green band in lane 3 could be due to an additional GQ stall or an off-target site for CRISPR–dCas9. (C) Quantitation of stall bands for the control sample (TR-only in which CRISPR–dCas9 was excluded from the assay) and the seven CRISPR–dCas9 target sites (RNP1–7). The bars represent averages of at least three measurements and the error bars are the standard error of these measurements. The ** symbol in (C) indicates a statistically significant difference compared to TR only case with P< .01.

Update of

References

    1. Horvath P, Barrangou R CRISPR/Cas, the immune system of bacteria and archaea. Science (1979). 2010; 327:167–70. - PubMed
    1. Barrangou R, Fremaux C, Deveau H et al. . CRISPR provides acquired resistance against viruses in prokaryotes. Science (1979). 2007; 315:1709–12. - PubMed
    1. Qi LS, Larson MH, Gilbert LA et al. . Repurposing CRISPR as an RNA-guided platform for sequence-specific control of gene expression. Cell. 2013; 152:1173–83.10.1016/j.cell.2013.02.022. - DOI - PMC - PubMed
    1. Larson MH, Gilbert LA, Wang X et al. . CRISPR interference (CRISPRi) for sequence-specific control of gene expression. Nat Protoc. 2013; 8:2180–96.10.1038/nprot.2013.132. - DOI - PMC - PubMed
    1. Konermann S, Brigham MD, Trevino AE et al. . Genome-scale transcriptional activation by an engineered CRISPR–Cas9 complex. Nature. 2015; 517:583–88.10.1038/nature14136. - DOI - PMC - PubMed

LinkOut - more resources