. 2025 Jan 22;16(9):4075-4084.
doi: 10.1039/d4sc01693a. eCollection 2025 Feb 26.

Uncovering the potent antimicrobial activity of squaramide based anionophores - chloride transport and membrane disruption

Affiliations

Uncovering the potent antimicrobial activity of squaramide based anionophores - chloride transport and membrane disruption

Luke E Brennan et al. Chem Sci. .

Abstract

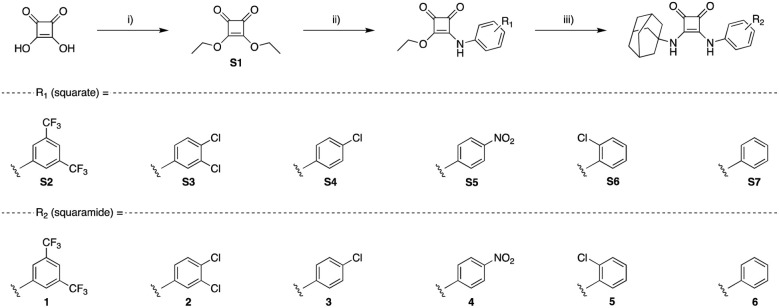
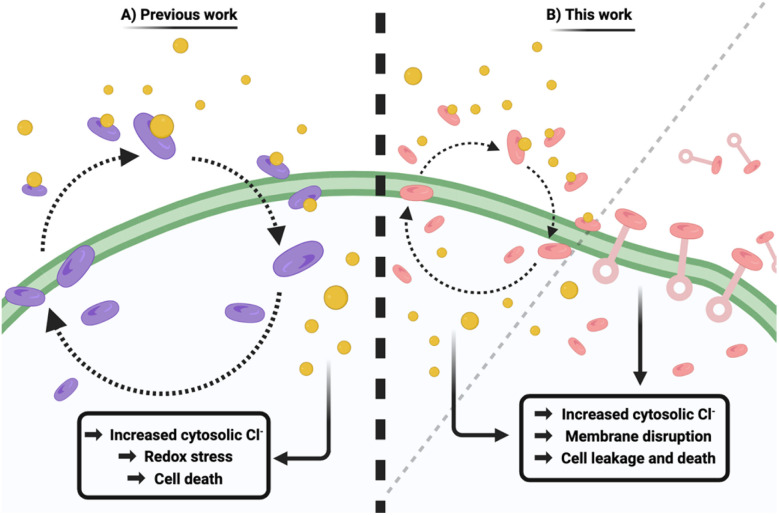
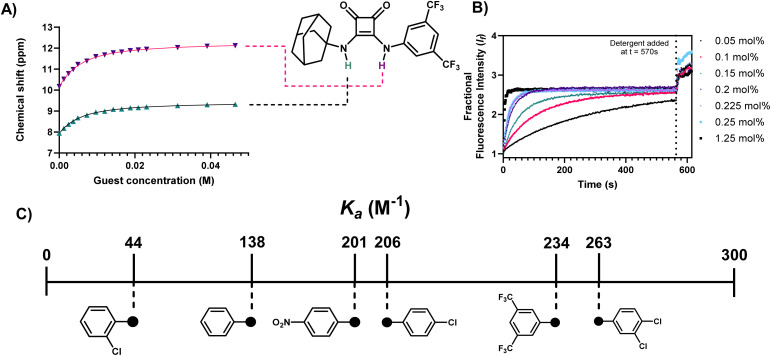
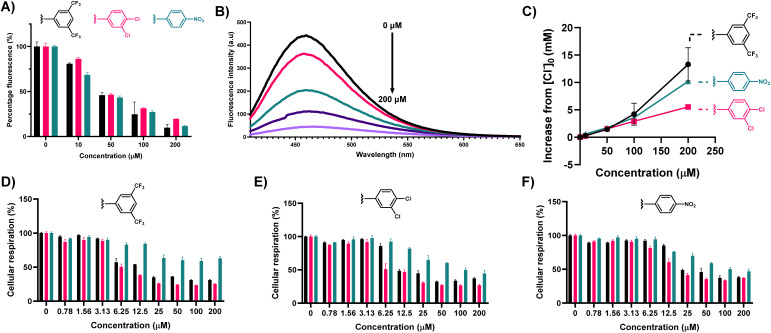
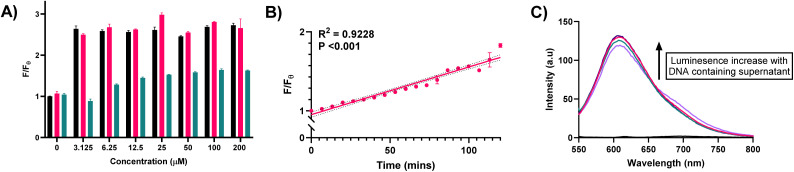
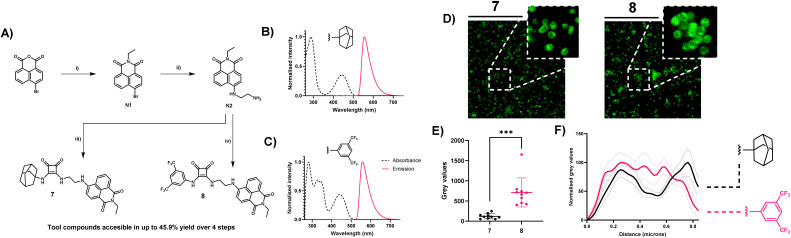
Antimicrobial resistance (AMR) - often referred to as a silent pandemic, is at present the most serious threat to medicine, and with constantly emerging resistance to novel drugs, combined with the paucity of their development, is likely to worsen. To circumvent this, supramolecular chemists have proposed the applicability of synthetic anion transporters in the fight against AMR. In this article we discuss the synthesis, supramolecular characterisation and biological profiling of six structurally simple squaramide anion transporters. Through a combination of spectroscopic techniques, and cellular assays we have deduced the mode of action of these antimicrobial agents to be as a result of both anion transport and membrane disruption. Furthermore, through the synthesis of two fluorescent analogues we verified this membrane-localised activity using Super-Resolution nanoscopy methods. These compounds represent particularly active antimicrobial anionophores and compliment similar reports showing the applicability of agents such as these in the fight against AMR.


Conflict of interest statement

There are no conflicts to declare.

Figures

Scheme 1
Scheme 1. Synthetic pathways towards adamantyl-squaramides. Reagents and conditions: (i) triethyl orthoformate, EtOH, reflux, 72 h, 90%; (ii) substituted aniline, Zn(OTF)2 (20 mol%), EtOH, rt, 24 h, 23–79%; (iii) adamantylamine, TEA, EtOH, rt, 24 h, 21–67%.
Fig. 1
Fig. 1. Schematic illustrating previous and current approaches to supramolecular antimicrobial development. (A) “Squindole” anion transporters can carry out anion transport “in cellulo” resulting in potent antimicrobial activity through increasing cytosolic Cl concentration, which yields redox stress and ultimately cell death. (B) Adamantyl-squaramides act as antimicrobials through a combination of anion transport, and disruption of membrane integrity.
Fig. 2
Fig. 2. Cl binding and transport results for 1 and a schematic summary of overall binding propensities for each receptor. (A) 1H NMR Fitted binding isotherm for the titration of 1 (2.5 mM) in the presence of increasing concentrations of Cl (0–22 eq., TBACl) in DMSO-d6/0.5% H2O where data is fitted to a 1 : 1 binding model and illustrates the migration of NH signals throughout the titration. Relevant protons constituting the binding cleft are annotated within the structure of 1; (B) results of the lucigenin Cl/NO3 exchange assay carried out in the presence of incrementally increasing concentrations of 1 (molar% relative to LUV's at a fixed concentration of 0.4 mM); (C) schematic summary of the overall binding affinities of each receptor.
Fig. 3
Fig. 3. Compounds 1, 2, and 4 can effectively influx chloride into S. aureus cells, and removal of Na+ and Cl from solution does not alter the effect of 1, 2, and 4 on cellular respiration. (A) Percentage fluorescence of MQAE compared to control, when treated with a series of concentrations of each compound. Blue = 1, red = 2, green = 4; (B) fluorescence spectrum of MQAE upon addition of 1 at varying concentrations, illustrating the collisional quenching effect of chloride influx, mediated by 1; (C) plot of increasing Cl concentration from [Cl]0, upon increasing concentration of 1, 2, and 4; (D) MTT assay monitoring the effect of 1 on cellular respiration in S. aureus; (E) MTT assay monitoring the effect of 2 on cellular respiration in S. aureus; (F) MTT assay monitoring the effect of 4 on cellular respiration in S. aureus. For MTT assays, black = HBSS buffer, red = Cl free HBSS buffer, green = Na+ free HBSS buffer.
Fig. 4
Fig. 4. Determination of the ability of xompounds 1, 2, and 4 to disrupt the membrane integrity of S. aureus. (A) Quantification of propidium iodide fluorescence from S. aureus cells upon treatment with various concentrations of 1, 2, and 4. Black = 1, red = 2, green = 4; (B) graph of propidium iodide fluorescence from S. aureus cells over time upon treatment with 50 μM 1, with fitted linear regression of mean data points, with 95% CI shown (dotted line); (C) DNA leakage assay quantified by Ru(Phen)2(DPPZ)Cl2 luminescence turn-on in culture supernatant. Black = sterile nutrient broth (baseline signal), purple = no treatment, pink = 100 μM 1, green = 100 μM 2, violet = 100 μM 4.
Fig. 5
Fig. 5. (A) Synthesis and photophysical characteristics of compounds 7 and 8. Reagents and conditions: (i) ethylamine hydrochloride, 1,4-dioxane, reflux, 18 h, 90%; (ii) 1,2-diaminoethane, toluene, reflux, 18 h, 75%; (iii) S8, TEA, EtOH, reflux, 18 h, 68%; (iv) S2, TEA, EtOH, reflux, 18 h, 65%; (B) normalised excitation and emission spectrum of compound 7; (C) normalised excitation and emission spectrum of Compound 8. (D) stimulated emission depletion nanoscopy (STED) analysis of the cellular distribution of 7 and 8 derived fluorescence in S. aureus. STED images are of S. aureus treated with 3 μM 7 or 8 for 30 min, with an overlay of a zoomed representative region of interest (ROI) illustrating cellular distribution of 7 in single cells (E) mean grey value abundance of 7 and 8 at the centre of single cells (0.5 μm) previously identified as ROI's. (F) Normalised mean grey value distribution of both 7 (black) and 8 (red) within ROI's, which were identified as single cells. Mean grey values are represented as mean distribution ± SEM of 10 individual cells selected at random from three distinct nanoscopy images acquired from differing regions of the slide.

Similar articles

References

    1. Wong K. Ma J. Rothnie A. Biggin P. C. Kerr I. D. Towards understanding promiscuity in multidrug efflux pumps. Trends Biochem. Sci. 2014;39(1):8–16. doi: 10.1016/j.tibs.2013.11.002. https://dx.doi.org/10.1016/j.tibs.2013.11.002 - DOI - DOI - PubMed
    1. Munita J. M. Arias C. A. Mechanisms of Antibiotic Resistance. Microbiol. Spectr. 2016;4(2) doi: 10.1128/microbiolspec.VMBF-0016-2015. - DOI - PMC - PubMed
    1. Brogan D. M. Mossialos E. A critical analysis of the review on antimicrobial resistance report and the infectious disease financing facility. Glob. Health. 2016;12(1):8. doi: 10.1186/s12992-016-0147-y. https://dx.doi.org/10.1186/s12992-016-0147-y - DOI - DOI - PMC - PubMed
    1. Pendleton J. N. Gorman S. P. Gilmore B. F. Clinical relevance of the ESKAPE pathogens. Expert Rev. Anti Infect. Ther. 2013;11(3):297–308. doi: 10.1586/eri.13.12. https://dx.doi.org/10.1586/eri.13.12 - DOI - DOI - PubMed
    1. Nowak P. Paluchowska P. Acinetobacter baumannii: biology and drug resistance - role of carbapenemases. Folia Histochem. Cytobiol. 2016;54(2):61–74. doi: 10.5603/FHC.a2016.0009. - DOI - PubMed

LinkOut - more resources