Acetic acid enabled nuclear contrast enhancement in epi-mode quantitative phase imaging
- PMID: 39906483
- PMCID: PMC11792252
- DOI: 10.1117/1.JBO.30.2.026501
Acetic acid enabled nuclear contrast enhancement in epi-mode quantitative phase imaging
Abstract
Significance: The acetowhitening effect of acetic acid (AA) enhances light scattering of cell nuclei, an effect that has been widely leveraged to facilitate tissue inspection for (pre)cancerous lesions. Here, we show that a concomitant effect of acetowhitening-changes in refractive index composition-yields nuclear contrast enhancement in quantitative phase imaging (QPI) of thick tissue samples.
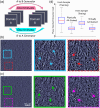
Aim: We aim to explore how changes in refractive index composition during acetowhitening can be captured through a novel epi-mode 3D QPI technique called quantitative oblique back-illumination microscopy (qOBM). We also aim to demonstrate the potential of using a machine learning-based approach to convert qOBM images of fresh tissues into virtually AA-stained images.
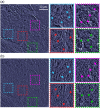
Approach: We implemented qOBM, an imaging technique that allows for epi-mode 3D QPI to observe phase changes induced by AA in thick tissue samples. We focus on detecting nuclear contrast changes caused by AA in mouse brain samples. As a proof of concept, we also applied a Cycle-GAN algorithm to convert the acquired qOBM images into virtually AA-stained images, simulating the effect of AA staining.
Results: Our findings demonstrate that AA-induced acetowhitening leads to significant nuclear contrast enhancement in qOBM images of thick tissue samples. In addition, the Cycle-GAN algorithm successfully converted qOBM images into virtually AA-stained images, further facilitating the nuclear enhancement process without any physical stains.
Conclusions: We show that the acetowhitening effect of acetic acid induces changes in refractive index composition that significantly enhance nuclear contrast in QPI. The application of qOBM with AA, along with the use of a Cycle-GAN algorithm to virtually stain tissues, highlights the potential of this approach for advancing label-free and slide-free, ex vivo, and in vivo histology.
Keywords: acetic acid; microscopy; nuclear contrast; quantitative phase imaging.
© 2025 The Authors.
Figures


References
-
- Park Y. K., Depeursinge C., Popescu G., “Quantitative phase imaging in biomedicine,” Nat. Photonics 12(10), 578–589 (2018). 10.1038/s41566-018-0253-x - DOI
Publication types
MeSH terms
Substances
Grants and funding
LinkOut - more resources
Full Text Sources
Research Materials

