. 2025 Jan 4;28(2):111747.
doi: 10.1016/j.isci.2025.111747. eCollection 2025 Feb 21.

A 5-transcript signature for discriminating viral and bacterial etiology in pediatric pneumonia

Affiliations

A 5-transcript signature for discriminating viral and bacterial etiology in pediatric pneumonia

Sandra Viz-Lasheras et al. iScience. .

Abstract

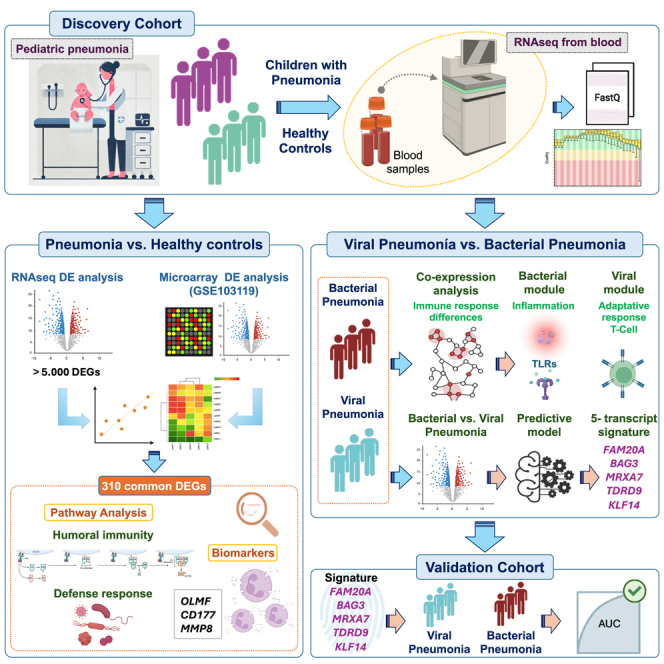
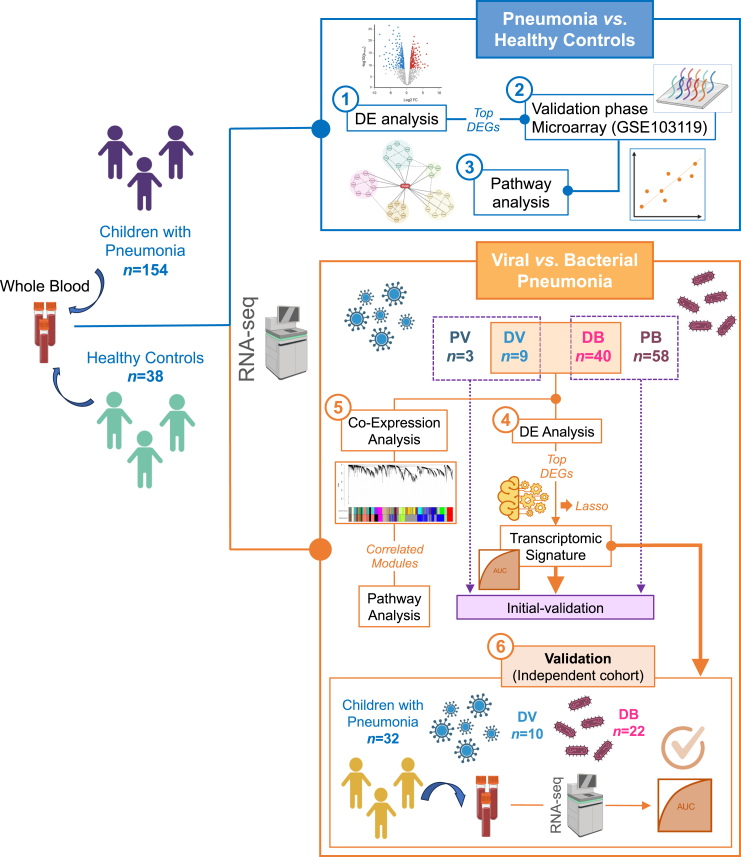
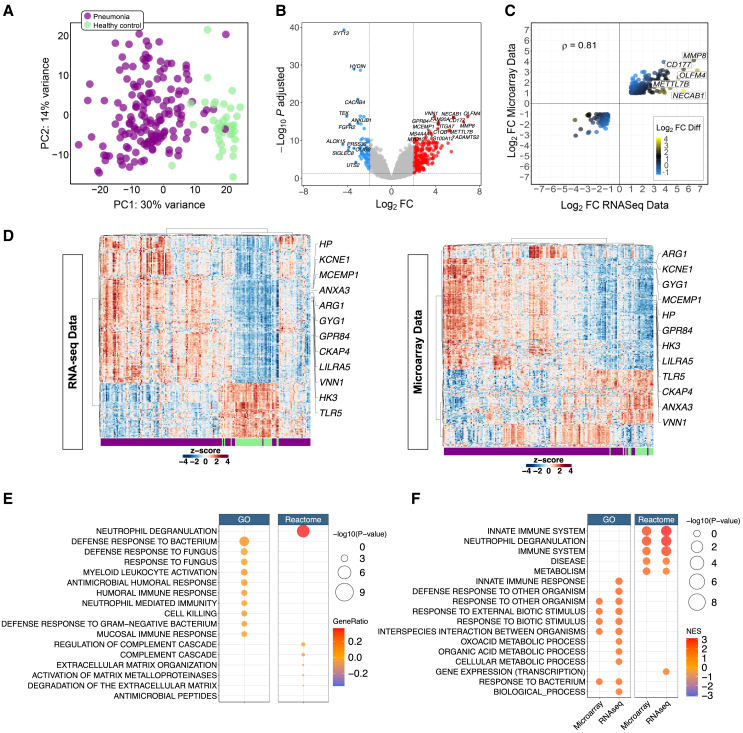
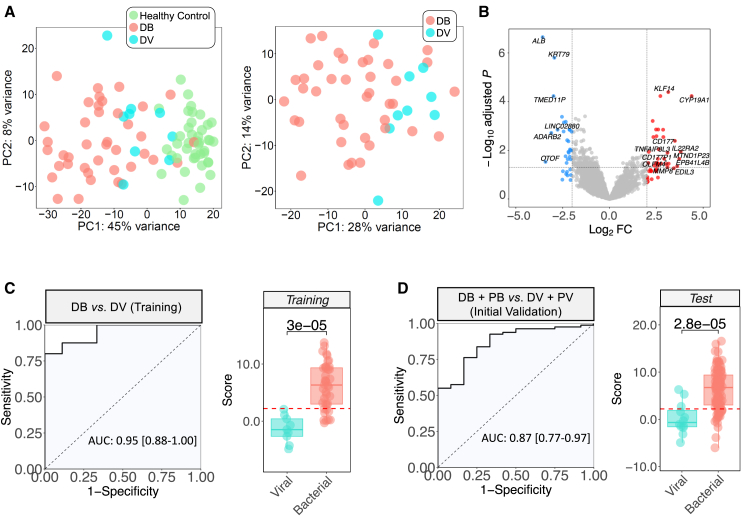
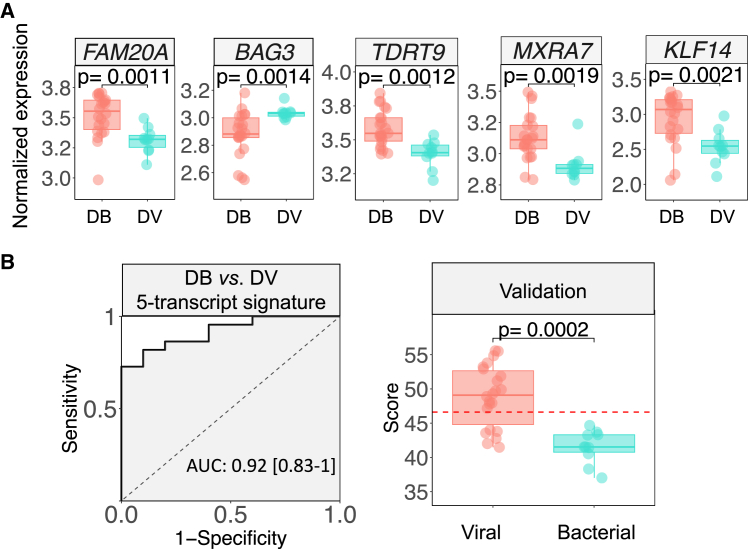
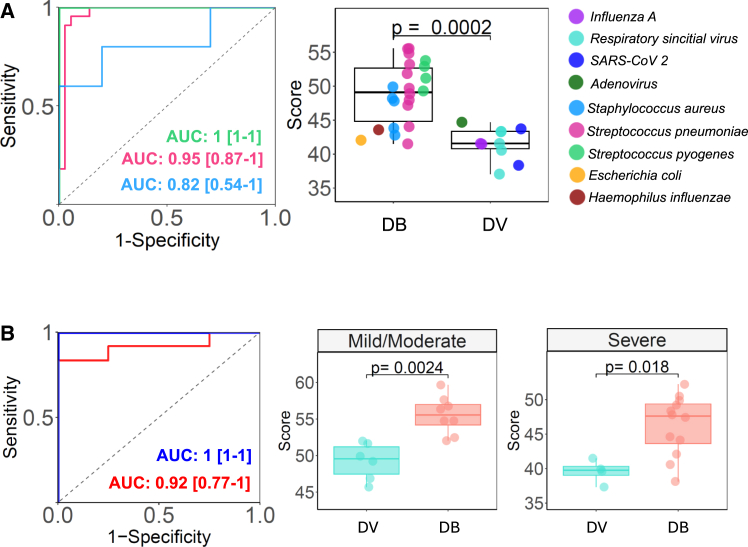
Pneumonia stands as the primary cause of death among children under five, yet current diagnosis methods often result in inadequate or unnecessary treatments. Our research seeks to address this gap by identifying host transcriptomic biomarkers in the blood of children with definitive viral and bacterial pneumonia. We performed RNA sequencing on 192 prospectively collected whole blood samples, including 38 controls and 154 pneumonia cases, uncovering a 5-transcript signature (genes FAM20A, BAG3, TDRD9, MXRA7, and KLF14) that effectively distinguishes bacterial from viral pneumonia (area under the curve (AUC): 0.95 [0.88-1.00]). Initial validation using combined definitive and probable cases yielded an AUC of 0.87 [0.77-0.97], while full validation in a new prospective cohort of 32 patients achieved an AUC of 0.92 [0.83-1.00]. This robust signature holds significant potential to enhance diagnostics accuracy for pediatric pneumonia, reducing diagnostic delays and unnecessary treatments and potentially transforming clinical practice.

Keywords: Body substance sample; Clinical microbiology; Diagnostics; Pediatrics; Transcriptomics.


Conflict of interest statement

The authors have a European patent application related to this work under the identification number EP24382240.

Figures

None
Graphical abstract
Figure 1
Figure 1
Scheme of the study design The figure was built using BioRender resources; created in BioRender. BioRender.com/b32x666.
Figure 2
Figure 2
Pneumonia patients vs. healthy controls (A) PCA of transcriptome profiles from pneumonia and healthy control samples. Two first principal components (PC1 and PC2) are shown. (B) Volcano plot showing the DEGs between conditions: pneumonia vs. healthy control. Downregulated genes are colored blue, and upregulated genes are colored red (thresholds: adjusted p value = 0.05, log2FC = |2|). (C) Correlation between log2FC of DEGs obtained from the comparison pneumonia vs. healthy controls in RNA-seq/microarray data. Only genes with adjusted p value < 0.05 and log2FC > |1| are displayed. The color scale represents the differences between the log2FC values of both analyses. The p value of the correlation is 2.2e−16, and only names of genes with a Log2FC > |5| are shown. (D) Two-way hierarchical clustering analysis heatmap of DEGs between pneumonia and healthy control samples in RNA-seq and microarray validation cohorts. Each row represents one transcript; each column represents one patient. The bar at the bottom indicates the sample phenotype. Only genes with a log2FC > |1| and adjusted p value < 0.05 were represented in the heatmap, and only the genes that were common in the top 40 with the lower p value in both analysis were printed. Expression intensity is indicated by color (red, high expression; blue, low expression). (E) Dot plot from over-representation analysis (ORA) pathway analysis of common DEGs between RNA-seq and microarray cohort with adjusted p value (FDR) < 0.05 and a log2FC > |1.5| for the comparison pneumonia patients vs. healthy controls using Gene Ontology (GO) and Reactome as reference. Size along the x axis indicates the number of genes in the input list that are annotated to the corresponding term/number of genes in the input list (gene ratio). Dot colors correspond to the different FDR p values associated with the pathways. (F) Dot plot from GSEA pathway analysis of common DEGs between RNA-seq and microarray cohort with FDR p value < 0.05 and a log2FC > |1.5| for the comparison pneumonia patients vs. healthy controls using GO and Reactome as reference. Size of the dots corresponds to FDR p values associated with the pathways. Dot colors correspond to the pathway normalized enrichment scores (NESs) values.
Figure 3
Figure 3
Viral and bacterial pneumonias (A) PCA of transcriptome profiles of DV and DB pneumonias and healthy control samples. Two first principal components (PC1 and PC2) are shown. (B) Volcano plot showing the DEGs between conditions: DB pneumonia vs. DV pneumonia (DV). Downregulated genes are colored blue, and upregulated genes are colored red (thresholds: adjusted p value = 0.05, log2FC = |2|). (C) Receiver operating characteristic (ROC) curves based on the specific 5-transcript signature from the training cohort including the area under the curve (AUC) and 95% confident intervals (CIs) values (left). Boxplots of the predicted values using the optimal model in the training cohort. Wilcoxon p value is also displayed (right). (D) Receiver operating characteristic (ROC) curves based on the specific 5-transcript signature from the test cohort including the area under the curve (AUC) and 95% confident intervals (CIs) values (left). Boxplots of the predicted values using the optimal model in the training cohort. Wilcoxon p value is also displayed (right). Red dashed line represents the optimal cutpoint. The boxes are defined by the upper and lower quartile (Q1 and Q3); whiskers extend to the most extreme data point, which is no more than 1.5 times the IQR from the box; the median is shown as a bold-colored horizontal line.
Figure 4
Figure 4
Validation cohort (A) Boxplots showing the expression values of the genes included in the 5-transcript signature in the validation cohort. The boxes are defined by the upper and lower quartile (Q1 and Q3); the median is shown as a bold-colored horizontal line; whiskers extend to the most extreme data point, which is no more than 1.5 times the IQR from the box. (B) ROC curve, AUC value with confidence interval, and boxplot of the predicted value obtained from applying the 5-transcript viral/bacterial signature coefficients in the validation cohort. Wilcoxon test p values are displayed in the boxplots.
Figure 5
Figure 5
Performance of the 5-transcript signature (A) ROC curves, AUC values, and boxplots of the performance of the 5-transcript signature in pneumonias with different causal pathogens. Only bacterial groups with more than 3 samples were considered for the AUC and ROC analysis. The boxes are defined by the upper and lower quartile (Q1 and Q3); the median is shown as a bold-colored horizontal line; whiskers extend to the most extreme data point, which is no more than 1.5 times the IQR from the box. (B) ROC curves, AUC values, and boxplots of the performance of the 5-transcript signature in pneumonias with different severities (severe or mild/moderate).
Figure 6
Figure 6
Co-expression analysis of viral vs. bacterial pneumonia (A) Hierarchical clustering eigengene dendrogram and heatmap showing relationships among the modules and pneumonia etiology (DB and DV pneumonias). Gene names on the left of the heatmap are the hub genes of each module. (B) Correlation values heatmap between co-expression modules and DB and DV conditions (DV was considered the reference group). Values show individual correlations of the module with DB phenotype (left). Correlation values are also indicated with different colors (legend gradient color bar). p values of these correlations are represented in brackets (lower values). Plots showing comparison between MM (module membership) and GS (correlation with bacterial/viral condition) of genes from the most significant modules detected. (C) Top 15 statistically associated GO biological processes detected for each of the significantly correlated modules. (D) Top 15 statistically associated Reactome pathways detected for each of the significantly correlated modules.

Similar articles

References

    1. Vos T., Lim S.S., Abbafati C., Abbas K.M., Abbasi M., Abbasifard M., Abbasi-Kangevari M., Abbastabar H., Abd-Allah F., Abdelalim A. Global burden of 369 diseases and injuries in 204 countries and territories, 1990–2019: a systematic analysis for the Global Burden of Disease Study 2019. Lancet. 2020;396:1204–1222. - PMC - PubMed
    1. World Health Organization (WHO) 2022. Pneumonia in children.
    1. Haq I.J., Battersby A.C., Eastham K., McKean M. Community acquired pneumonia in children. Br. Med. J. 2017;356:j686. - PubMed
    1. Shoar S., Musher D.M. Etiology of community-acquired pneumonia in adults: a systematic review. Pneumonia. 2020;12:11. - PMC - PubMed
    1. Lynch J.P., III Hospital-acquired pneumonia: risk factors, microbiology, and treatment. Chest. 2001;119:373S–384S. - PubMed