. 2025 Jan 4;28(2):111703.
doi: 10.1016/j.isci.2024.111703. eCollection 2025 Feb 21.

Mind wandering enhances statistical learning

Affiliations

Mind wandering enhances statistical learning

Teodóra Vékony et al. iScience. .

Abstract

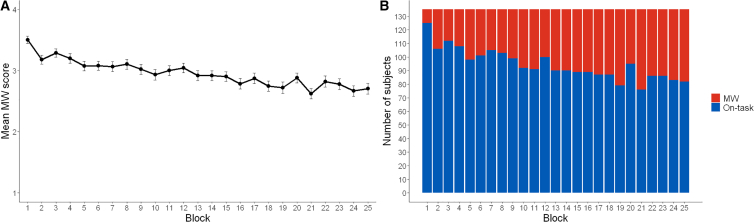
The human brain spends 30-50% of its waking hours engaged in mind-wandering (MW), a common phenomenon in which individuals either spontaneously or deliberately shift their attention away from external tasks to task-unrelated internal thoughts. Despite the significant amount of time dedicated to MW, its underlying reasons remain unexplained. Our pre-registered study investigates the potential adaptive aspects of MW, particularly its role in predictive processes measured by statistical learning. We simultaneously assessed visuomotor task performance as well as the capability to extract probabilistic information from the environment while assessing task focus (on-task vs. MW). We found that MW was associated with enhanced extraction of hidden, but predictable patterns. This finding suggests that MW may have functional relevance in human cognition by shaping behavior and predictive processes. Overall, our results highlight the importance of considering the adaptive aspects of MW, and its potential to enhance certain fundamental cognitive abilities.

Keywords: Psychology.


Conflict of interest statement

The authors declare no competing interests.

Figures

None
Graphical abstract
Figure 1
Figure 1
Experimental design and task structure of the ASRT task (A) In the ASRT task, participants had to press keys corresponding to the location of the target stimulus (dog’s head), where every second trial was part of an 8-element probabilistic sequence. Random elements were inserted among pattern elements to form the sequence. (B) The experiment consisted of 25 blocks with thought probes administered after each block of 80 trials. Participants were asked to reflect on their thoughts and respond to three questions aimed at distinguishing between (1) on-task and MW (off-task) periods, (2) MW and mind blanking (MB) periods, and (3) deliberate vs. non-deliberate/spontaneous episodes. (C) Formation of triplets in the task. Pattern elements are represented by red backgrounds (they constantly appear at that position throughout the task), and random elements are represented by blue backgrounds (they are always chosen from the four possible positions randomly). Every trial was categorized as the third element of three consecutive trials (a triplet). The probabilistic sequence structure resulted in a higher occurrence of some triplets (high-probability triplets) than others (low-probability triplets). (D) The formation of high-probability triplets could have involved the occurrence of either two pattern trials and one random trial at the center, in 50% of trials, or two random trials and one pattern trial at the center (12.5% of trials). In total, 62.5% of all trials constituted the final element of a high-probability triplet, while the remaining 37.5% were the final elements of a low-probability triplet.
Figure 2
Figure 2
Change of MW over the course of the ASRT task (A) Mean MW score per block, as reported by participants. The x axis represents the block number, and the y axis shows the average MW score (on a scale of 1–4, the lower score indicates more MW). The error bar indicates SEM. (B) The number of participants engaged in MW in a given block. The x axis indicates the block number, while the y axis reflects the number of participants. Stacked bars differentiate between participants who reported MW (red) and those who reported on-task focus (blue). As the task progressed, both the overall MW and the number of participants reporting MW increased.
Figure 3
Figure 3
Visuomotor performance and statistical learning over the course of the task in the MW vs. on-task periods measured by reaction times (A) Reaction time in ms plotted as a function of task progress. Red boxes indicate data from the MW (off-task) periods, and blue boxes that of the on-task periods. The lower and upper hinges correspond to the first and third quartiles (the 25th and 75th percentiles), whiskers show 1.5 × IQR, and horizontal notches show the median. (B) Raw statistical learning scores (difference between high- and low-probability trials) over the course of the task in the MW vs. on-task periods. The y axes indicate learning scores calculated and the x axes mark the blocks of the task. The red color indicates MW periods, and the blue color the on-task periods. Higher values represent better statistical learning (larger difference between high- and low-probability trials). (C) Estimated marginal means of reaction time learning scores. Error bars and bands represent standard errors. (B and C) Statistical learning was larger at the beginning of the task during MW periods (Triplet Type × MW × Block interaction). See also Table S5.
Figure 4
Figure 4
Visuomotor performance and statistical learning over the course of the task in the MW vs. on-task periods measured by accuracy (A) Accuracy in percentage plotted as a function of task progress. Red boxes indicate data from the MW (off-task) periods, and blue boxes that of the on-task periods. The lower and upper hinges correspond to the first and third quartiles (the 25th and 75th percentiles), whiskers show 1.5 × IQR, and horizontal notches show the median. During MW periods, participants were less accurate than during on-task periods. (B) Raw statistical learning scores (difference between high- and low-probability trials) over the course of the task in the MW vs. on-task periods. The y axes indicate learning scores calculated and the x axes mark the blocks of the task. The red color indicates MW periods, and the blue color the on-task periods. Higher values represent better statistical learning (larger difference between high- and low-probability trials). (C) Estimated marginal means of accuracy learning scores. Error bars and bands represent standard errors. (B and C) Statistical learning was larger during MW periods (Triplet Type × MW interaction). See also Table S6.

Similar articles

Cited by

References

    1. Killingsworth M.A., Gilbert D.T. A wandering mind is an unhappy mind. Science. 2010;330:932. doi: 10.1126/science.1192439. - DOI - PubMed
    1. Buckner R.L., Carroll D.C. Self-projection and the brain. Trends Cogn. Sci. 2007;11:49–57. doi: 10.1016/j.tics.2006.11.004. - DOI - PubMed
    1. Stawarczyk D., Majerus S., Maj M., Van der Linden M., D’Argembeau A. Mind-wandering: Phenomenology and function as assessed with a novel experience sampling method. Acta Psychol. 2011;136:370–381. doi: 10.1016/j.actpsy.2011.01.002. - DOI - PubMed
    1. Smallwood J., Schooler J.W. The science of mind wandering: Empirically navigating the stream of consciousness. Annu. Rev. Psychol. 2015;66:487–518. doi: 10.1146/annurev-psych-010814-015331. - DOI - PubMed
    1. Schooler J.W., Smallwood J., Christoff K., Handy T.C., Reichle E.D., Sayette M.A. Meta-awareness, perceptual decoupling and the wandering mind. Trends Cogn. Sci. 2011;15:319–326. doi: 10.1016/j.tics.2011.05.006. - DOI - PubMed

LinkOut - more resources